Joana Fernandes Alberto Wilton Pereira
Licenciada em Bioquímica
Electrochemical characterization of Dps, a DNA-protecting
protein
Dissertação para obtenção do Grau de Mestre em
Biotecnologia
Orientador: Doutora Cristina Maria Grade Couto da Silva
Cordas, Investigadora Auxiliar, DQ-FCT-UNL
Co-orientador: Pedro António de Brito Tavares, Professor
Auxiliar, DQ-FCT-UNL
“Copyright”
Electrochemical characterization of Dps, a DNA-protecting
protein
Joana Fernandes Alberto Wilton Pereira
Faculdade de Ciências e Tecnologia / Universidade Nova de Lisboa
Universidade Nova de Lisboa
Dedicatória e agradecimentos
Em primeiro lugar, gostaria de agradecer aos meus orientadores, Doutora Cristina Cordas e Professor Doutor Pedro Tavares, por todo o seu trabalho na orientação da minha dissertação de Mestrado em Biotecnologia.
À Doutora Cristina Cordas, ficarei sempre grata pela oportunidade, pela orientação sempre no sentido de me tornar independente e pela relação que criámos ao longo do ano. Mais do que uma orientadora, foi uma mentora durante todos estes meses, incentivando-me sempre para trabalhar cada vez melhor, como a minha maior crítica, apoiante e encorajadora q.b., desde a fase de planeamento do trabalho aos toques finais deste documento.
Ao Professor Pedro Tavares, o meu muito e muito obrigada pelas conversas esclarecedoras e intensivas acerca do mecanismo da Dps e pelo incentivo em melhorar noutras áreas que não a ciência. À Professora Doutora Alice Pereira, à Doutora Cristina Timóteo e ao Doutor Filipe Folgosa, muito obrigada pelo apoio imprescindível durante a purificação da proteína. À Professora Alice Pereira, agradeço também a ajuda atenta e disponível durante todo o ano. Ao Doutor Filipe Folgosa, muito e muito obrigada pelas críticas e elogios sempre sinceros, que me fizeram aprender e tornar mais humilde à medida que os meses passavam e me apercebia cada vez mais do esforço a dispender para traçar o meu próprio caminho na ciência.
Gostaria também de agradecer aos meus colegas estudantes e/ou bolseiros que trabalharam no laboratório 425 e em muito contribuíram para o ambiente laboratorial agradável: Daniela Silva, Magda Reis (obrigada pela ajuda nas traduções!), Inês Graça, Tânia Cardoso, Sérgio Portovedo, Madalena Lourenço e João Froes. De igual forma, gostaria de agradecer aos restantes colegas - Doutores Rui Almeida e Susana Ramos, Leonor Morgado, Ana Pina, Sara Santana, Inês Camacho, Renato Santos.
Não posso esquecer também os meus amigos toda a paciência para me aturar quando me esquecia que estava fora do laboratório e toda a conversa acabava em trabalho, especialmente nos últimos tempos. Filipa, obrigada pelas conversas e perguntas difíceis e acutilantes; Ana, muito e muito obrigada pela empatia e cafés semestrais; João e Mariana, muito me alegrei em fazer com que futuros Engenheiros Civis percebam mais sobre as biocoisas desta vida.
Resumo
Os objectivos do presente trabalho foram a purificação e caracterização electroquímica da proteína Dps e o estudo do seu mecanismo de armazenamento de ferro na presença de H2O2.
Uma miniferritina bacteriana (Dps) proveniente de Pseudomonas (Ps.) nautica 617 foi expressa em células de
E. coli BL21(DE3) transformadas com o vector plasmídico pET21c(+)-1dps. A sobreexpressão da proteína pelas células transformadas foi realizada em meio rico (LB) contendo 100 µg/mL de ampicilina. A Dps recombinante foi purificada através de dois passos: cromatografia de permuta iónica fraca (resina DEAE Sepharose Fast Flow XK 26/40) e cromatografia de permuta iónica forte (resina Q Resource). A concentração da proteína foi determinada por espectroscopia UV/Visível.
O estudo electroquímico foi realizado por voltametria cíclica, de onda quadrada e cronoamperometria, com a proteína solubilizada ou adsorvida ao eléctrodo de trabalho. Utilizou-se como electrólito suporte o tampão 200 mM MOPS/ 200 mM NaCl, pH 7.1. Os ensaios foram realizados em ambiente aeróbio e anaeróbio e na presença de Dps, iões Fe(II) e H2O2, ambos co-substratos da proteína. Para diferentes ensaios, foram utilizados eléctrodos de ouro, carbono vítreo e grafite, com diferentes resultados e conclusões. Foi estudada a incorporação deste no centro ferroxidático e a ocorrência de formação de core mineral, tendo sido possível obter resultados por transferência electrónica directa. De salientar, entre os resultados obtidos, a observação da oxidação do ferro durante a incubação na proteína e a prova da produção de oxigénio durante o mecanismo catalítico. Do ponto de vista da protecção ao DNA, não foi possível obter resultados conclusivos, embora haja indícios de protecção pela Dps à oxidação electroquímica.
Palavras-Chave
Abstract
The objectives of the present work were the purification and electrochemical characterization of Dps and study its iron incorporation mechanism in the presence of hydrogen peroxide.
A bacterial miniferritin (Dps) from Pseudomonas (Ps.) nautica617 was expressed in BL21(DE3) E. coli cells transformed with pET21c(+)-1dps plasmid vector. Protein overexpression was performed in nutritionally rich LB medium containing 100 µg/mL ampicillin. Recombinant Dps was purified through a two-step process: weak ionic exchange chromatography (DEAE Sepharose Fast Flow XK 26/40 resin) and strong ionic exchange chromatography (Q Resource resin). Protein concentration was determined through UV/Visible spectroscopy. The electrochemical study was performed through cyclic voltammetry, square wave voltammetry and chronoamperometry; Dps was either in solution or adsorbed to the working electrode. The chosen supporting electrolyte was 200 mM MOPS pH 7.1 buffer with 200 mM NaCl. Electrochemical assays were performed in aerobic and anaerobic environment and in the presence of Dps and Fe(II) and H2O2, both of Dps co-substrates. For the different assays, working electrodes made of gold, glassy carbon and graphite were used with different results and conclusions. The iron incorporation in the ferroxidase centers and mineral core formation were studied. Assay results were obtained through direct electron transfer. Among the observed results, iron oxidation during protein incubation and oxygen production during the catalytic mechanism were observed. DNA-Dps interaction results were inconclusive, although some unconfirmed evidence exists of DNA protection by Dps from electrochemical oxidation.
Keywords
Table of Contents
Dedicatória e agradecimentos ... VI
Resumo ... VIII
Abstract ... X
Table of Contents ... XII
Figure Index ... XIV
Table Index ... XVIII
Symbols and Abbreviations ... XX
Symbols ... XX
Abbreviations ... XXII
Chapter I – Introduction ... 1
I.1 Iron – an essential element ... 1
I.2 Ferritin family proteins ... 3
1.2.1 Dps proteins ... 4
I.2.1.1 Iron incorporation ... 7
I.2.1.2 Cell defense mechanisms: oxidative stress ... 10
I.2.1.3 Cell defense mechanisms: DNA interaction ... 11
Chapter II – Instrumental Methods ... 15
II.1 Electrochemical fundamentals: Bioelectrochemistry as a tool for studying biological systems ... 15
II. 2 Electrochemical techniques ... 16
II.2.1 Cyclic voltammetry ... 16
II.2.2 Square wave voltammetry ... 19
II.2.3 Chronoamperometry ... 19
II.3 Dps electrochemical studies ... 20
II.3.1 Electrochemical set-up ... 20
II.3.2 Dps immobilization procedure ... 22
II.4 DNA-Dps interaction ... 22
II.4.1 Electrochemical set-up ... 22
II.4.2 DNA immobilization procedure ... 22
Chapter III – Recombinant Dps from
Pseudomonas nautica
617 ... 25
III.1 Recombinant production of Dps from P. nautica 617 in E. coli ... 25
III.2 Dps purification ... 27
III.3 ICP assays ... 30
Chapter IV – Results and Discussion ... 31
IV.1 Dps iron incorporation assays in the presence of H2O2 (Cyclic voltammetry) ... 31
IV.1.1 Sample graphite electrode ... 32
IV.1.2 Commercial graphite – Adsorption assays ... 34
IV.1.3 Solution assays with glassy carbon WE ... 41
Dps direct assays ... 43
Phased assays: ... 52
Comparison between phased vs. direct Dps solution assays ... 57
Prolonged elecrochemical behavior monitorization: Dps phased multicycle assays ... 59
IV.2 Monitorizing oxygen production in the Dps electrochemical system: assays on the Clark electrode (Chronoamperometry) ... 63
IV.4.1 Dps quantification ... 72
IV.4.2 Dps activity at 310 nm ... 72
Chapter V – Conclusion ... 75
VI. Future perspectives ... 77
Bibliography ... 79
Appendices ... 81
A - Culture medium utilized for Dps overexpression in E.coli ... 81
A.1 LB (Lysogeny Broth) ... 81
A.2 Antibiotic – Ampicillin ... 81
B – General protocols for biochemical methods used in Dps purification ... 82
B.1 Cell disintegration ... 82
B.2 Denaturing polyacrylamide gel electrophoresis ... 82
B.3 Transformation protocol of competent E. coli BL21 (DE3) cells ... 84
C – Methods and protocols used in extraction, purification and Dps electrochemical and spectroscopic assays ... 85
C.1 DEAE Sepharose Fast Flow (FF) Column ... 85
C.2 Q Resource Column ... 85
C.3 Dps concentration ... 85
C.4 Iron quantification ... 86
C.5 Hydrogen peroxide quantification ... 88
C.6 Glassy carbon electrode test ... 88
C.7 Clark oxygen consumption calibration table ... 89
C.8 Formal reduction potentials of important electrochemical species ... 89
C.9 DNA quantification at 260 nm ... 90
D – Alternative purification series results ... 91
E – Instrumentation ... 93
E.1 Weighing ... 93
E.2 pH Electrode ... 93
E.3 Simultaneous agitation and incubation ... 93
E.4 Centrifugation ... 93
E.5 Autoclaving ... 93
E.6 Spectrophotometer ... 93
E.7 Electrophoresis and Camera ... 93
E.8 French Press ... 93
E.9 Material used in Ionic Exchange chromatography ... 93
E.10 Concentration through ultrafiltration ... 94
E.11 Potentiostat ... 94
E.12 Gloved chamber ... 94
E.13 Chronoamperometry assay materials ... 94
F – Sequence alignment data ... 95
F.1 Interspecies Dps sequence alignment ... 95
F.2 Organism under study ... 96
G– DNA sequence data ... 97
H – Other important electrochemical assays ... 98
Adsorption assays ... 98
Solution assays ... 104
Figure Index
Figure 1.1 – Reduction potentials of various oxygen species……….…...…… 2
Figure 1.2 – Dps homododecamer from E. coli (PDB source file: 1dps), drawn on Chimera…….…. 5
Figure 1.3 – A) Dps homododecamer (12 chains); B) Incomplete Dps homodecamer, both drawn on Chimera53 (PDB source file: 1dps)……….……….………... 5
Figure 1.4 – E. coli Dps surface electrostatic charge (PDB source file: 1dps)………...……… 6
Figure 1.5 –Dps monomer from E. coli (PDB source file: 1dps) showing 4 antiparallel helices and the ferroxidase center……….……….………. 6
Figure 1.6 – Possible iron paths in Dps. ……….……….……. 8
Figure 1.7 - Dps ferroxidase centers from E. coli, showing the high affinity A and the low affinity B site.……….……… 9
Figure 1.8 – A. 3D scheme B-form DNA, showing differently colored antiparallel strands with major and minor grooves; B. 2D molecular DNA scheme showing 3 types of chemical interactions……….………...… 11
Figure 2.1 – Scheme of a cyclic voltammetry assay…..……….………. 17
Figure 2.2 – A typical result for a square wave voltammetry assay……….………... 19
Figure 2.3 – A typical result for a chronoamperometry assay………..………... 19
Figure 2.4 – Aerobic electrochemical set-up……….……….………. 20
Figure 2.5 – Gloved chamber (UniLab) with controlled atmosphere……….……..…... 20
…… Figure 3.1 – Schematization representing the heterologous overexpression of Dps in E. coli ...…. 26
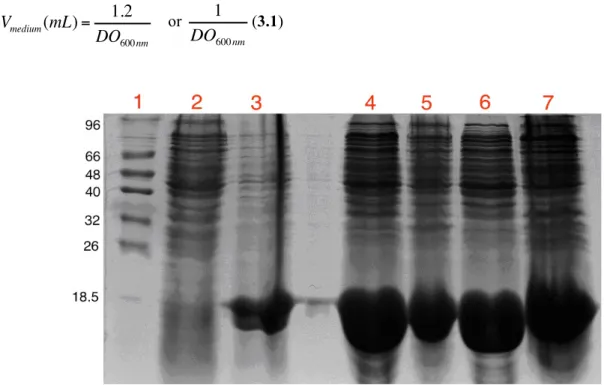
Figure 3.2 – SDS-PAGE assessing the overexpression of Dps in E.coli.……….…………...……… 27
Figure 3.3 – Elution profile of DEAE Sepharose Fast Flow chromatographic column (2.6 x 30 cm) used for Dps purification ………..………... 28
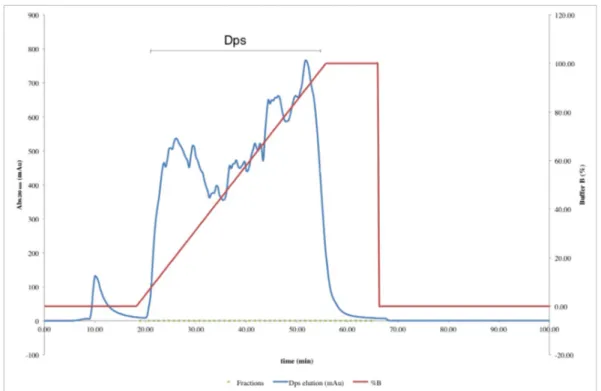
Figure 3.4 – Elution profile of Q Resource chromatographic column used in Dps purification………...………..………... 29
Figure 3.5 – SDS-PAGE (3-12% acrylamide gradient) assessing the whole Dps purification protocol. ………….……….………...………. 30
Figure 4.1 – Prototype electrode viewed transversally…...……….……… 32
Figure 4.2 – Voltammograms for the first potential scans of the control assay (supporting electrolyte) at 50 mV/s scan rate on pyrolytic graphite.……… ………...…………...…... 33
Figure 4.3 – Voltammograms from cycle 2 of apoDps and electrolyte (200 mM MOPS pH 7.1 / 200 mM NaCl) at 50 mV/s………...………...………...…………..……... 34
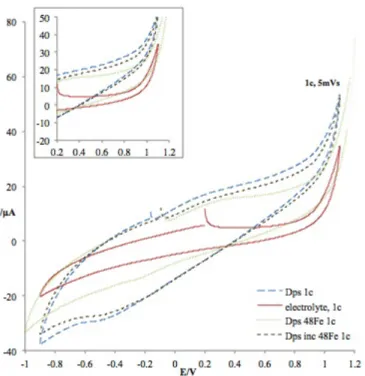
Figure 4.4 – Voltammograms from cycle 2 of Dps with 24Fe ratio added at the time of adsorption and electrolyte at 5 mV/s ………..………... 35
Figure 4.5 – Voltammograms from cycle 2 of Dps with 24 Fe ratio added at adsorption in the presence and absence of H2O2, comparing with electrolyte at 50 mV/s.……….…………. 36
Figure 4.6 – Voltammograms from cycle 1 of apoDps, electrolyte, Dps with 24 Fe added at adsorption and Dps incubated with 24 Fe at 5 mV/s ..…...………....………... 37
Figure 4.7 – Voltammograms from cycle 2 of apoDps, electrolyte, Dps with 24 Fe added at adsorption and Dps incubated with 24 Fe at 5 mV/s ...….……….…...………... 38
Figure 4.9 – Voltammograms from cycle 2 of apoDps, electrolyte, Dps with 48 Fe added at adsorption and Dps incubated with 48 Fe at 5 mV/s ….……….…… 39 Figure 4.10 – Schematization of both solution assay protocols……….………. 42 Figure 4.11 – Voltammograms from cycle 1 of supporting electrolyte and apoDps at 50 mV/s…………...………....……….……… 43 Figure 4.12 – Voltammograms from cycle 1 of apoDps, supporting electrolyte, direct assay Dps:6Fe:6x15 H2O2, 6x15 H2O2 and 6Fe: 6x15 H2O2 at 50 mV/s ……...……….……… 44
Figure 4.13 – Voltammograms from cycle 2 of apoDps, supporting electrolyte, direct assay Dps:6Fe:6x15 H2O2 and 6x15 H2O2 at 20 mV/s……….………..….………... 45
Figure 4.14 – Voltammograms from cycle 1 of apoDps, supporting electrolyte and direct assay Dps:12Fe:12x15 H2O2 at 50 mV/s …...………..………...………... 46
Figure 4.15 – Voltammograms from cycle 2 of apoDps, supporting electrolyte, direct assay Dps:12Fe:12x15 H2O2 and 6x15 H2O2 at 20 mV/s …...………....……... 46
Figure 4.16 – Voltammograms from cycle 1 of apoDps, supporting electrolyte, direct assay Dps:24Fe:24x15 H2O2, 24 Fe : 24x15 H2O2 and 24x15 H2O2 at 50 mV/s …...…………...……..… 47
Figure 4.17 – Voltammograms from cycle 1 of apoDps, supporting electrolyte and direct assay Dps:36Fe:36x15 H2O2 at 50 mV/s ………...………..……….……… 48
Figure 4.18– Voltammograms from cycle 1 of apoDps, supporting electrolyte, direct assay Dps:48 Fe:48x15 H2O2 at 50 mV/s ………...…...……….……… 48
Figure 4.19 – Voltammograms from cycle 2 of apoDps, supporting electrolyte, direct assay Dps:96Fe:96x15 H2O2 and 96Fe:96x15 H2O2 at 50 mV/s .…...……….………..… 49
Figure 4.20 – Voltammograms from cycle 1 at 50 mV/s, comparing direct assays Dps: 6;12;24;36;48 and 96Fe; excess proportional H2O2 addition ...……….……….. 50
Figure 4.21 - Voltammograms from cycle 2 at 50 mV/s, comparing direct assays Dps: 6;12;24;36;48 and 96Fe; excess proportional H2O2 addition ...………… ………...51
Figure 4.22 – Voltammograms from cycle 1 (A) and 2 (B) at 50 mV/s comparing direct Dps:24 Fe:H2O2 and respective control assays containing iron ………..……….…… 51
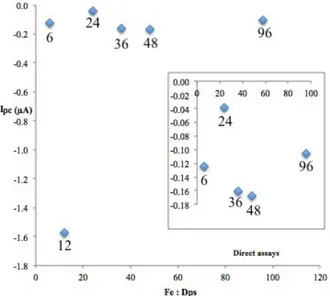
Figure 4.23 – Direct assay cathodic peak current intensity variation at approximately -0.2 V with increasing Fe:Dps ratios, from cycle 2 at 20 mV/s………...…………...…….52 Figure 4.24 – Voltammograms from cycles 1 (A) and 2 (B) at 50 mV/s, comparing phased assays Dps: 6;12;24;36;48 and 96 Fe ……...………... 53 Figure 4.25 – Voltammograms from cycle 2 at 20 mV/s, comparing phased assays Dps: 6;12;24;36;48 and 96Fe ………...…...……… 53 Figure 4.26 – Phased assay cathodic peak current intensity variation at approximately -0.2 V with increasing Fe:Dps ratios, from cycle 2 at 20 mV/s………..………. 54 Figure 4.27 – Phased assay anodic peak current intensity variation at approximately 0.12 V with increasing Fe:Dps ratios, from cycle 2 at 20 mV/s………...………… 55 Figure 4.28 – Voltammograms from cycle 1 (A) and 2 (B) at 50 mV/s, comparing Dps phased assays (Dps: 6;12;24;36 and 48 Fe : excess proportional H2O2 addition) ...……….……... 55
Figure 4.29 – Voltammograms from cycle 1 at 20 mV/s, comparing Dps phased assays (Dps: 6;12;24;36;48 and 96Fe : excess proportional H2O2 addition …………..………..………... 56
Figure 4.30 – Phased assay cathodic peak current intensity variation at approximately -0.22 V with varying Fe:Dps ratios in the presence of H2O2, from cycle 2 at 20 mV/s….……….. 56
Figure 4.31 – Voltammograms from cycle 2 of apoDps, 6Fe, 24 Fe and 96Fe at 50 mV/s……….. 57 Figure 4.32 – Voltammograms from cycle 1 of Dps:36 Fe:36x15 H2O2 (direct assay) Dps:36 Fe,
Figure 4.33 – Voltammograms from cycle 1 of Dps multicycle phased assays (Dps: 6;12;24;36;48;96 Fe) at 20 mV/ ………...……….……...……….………... 59 Figure 4.34 – Voltammograms from cycle 10 of Dps multicycle phased assays (Dps: 6;12;24;36;48;96 Fe) at 20 mV/ ………...……….…...………... 60 Figure 4.35 – Comparison graph between cathodic peak current intensity of cycles 1 and 10 at 20 mV/s of increasing Fe:Dps ratios (6 to 96) in multicycle phased assays………...…...…… 60 Figure 4.36 – Comparison graph between anodic peak current intensity of cycles 1 and 10 at 20 mV/s of increasing Fe:Dps ratios (6 to 96) in multicycle phased assays……..………. 61 Figure 4.37 – Comparison graph between current subtractions of both cathodic and anodic peak currents of cycles 1 and 10 at 20 mV/s of increasing Fe:Dps ratios (6 to 96) in multicycle phased assays. ………...………...……… 61 Figure 4.38 – Schematization of a Clark electrode with a built-in cell, used in the chronoamperometric assays………...……… 63 Figure 4.39 – A – Oxygen calibration chronoamperogram, using a Clark electrode as WE (polarized at -0.7 V vs. SCE RE) with 0.7 s interval between current measurements; B – Oxygen calibration curve showing current increase after O2 additions……...……….………... 64
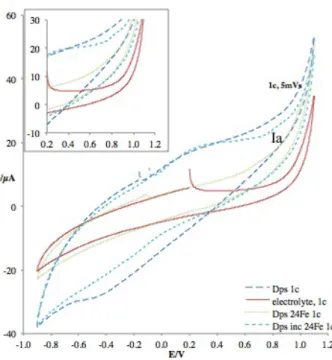
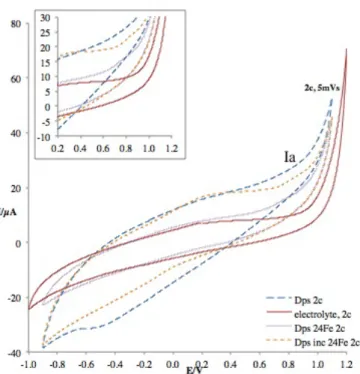
Figure 4.40 – A and B: Chronoamperometric duplicate assays of Dps:12Fe………….……… 64 Figure 4.41 – Chronoamperometric control assay with ………...………... 65 Figure 4.42 – Cyclic voltammograms from cycle 1 using a bare Au working electrode with electrolyte (Au 1c, blue line), the same WE incubated with MilliQ water for 20 h (Au inc 1c,) and ssDNA (green line) incubated on the WE for 20 h ………...………... 66 Figure 4.43 – Square wave voltammograms from the bare (blue line) and WE soaked in H2O MilliQ
for 20 h (red line), moving in the oxidative direction………... ……….……….. 67 Figure 4.44 – Square wave voltammograms from the bare and WE soaked in H2O MilliQ and ssDNA
incubated for 20 h on the Au WE ………..………..……… 67 Figure 4.45 – Square wave voltammograms from ssDNA assays and sequential addition of Dps, Fe and H2O2 at the Au WE. ssDNA + Dps + Fe + H2O2 assays were performed, respectively,
immediately and after H2O2 addition stabilization ………...……...……… 68
Figure 4.46 – Square wave voltammograms from the dsDNA and Dps influence at the Au WE, moving in the oxidative direction ……...……… 69 Figure 4.47 – Square wave voltammograms from dsDNA assay with sequential addition of Dps, Fe and H2O2 at the Au WE, moving in the oxidative direction ……… 70
Figure 4.48 – Square wave voltammograms from dsDNA assays with propanethiol added before hybridization showing influence of Dps and iron at the Au WE ……..………..………… 70 Figure 4.49 – Square wave voltammograms from dsDNA assays with propanethiol added before hybridization upon sequential addition of Dps, Fe and H2O2 at the Au WE ………....…….. 71
Figure D.1 - – SDS-PAGE (12.5% acrylamide) assessing Dps overexpression in E. coli………... 91
Figure D.2 – Elution profile of DEAE Sepharose Fast Flow chromatographic column (2.6 x 30 cm) used in Dps purification………....……… 91
Figure D.3 – Elution profile of Q-Resource chromatographic column (6 mL capacity, GE Healthcare) used as a second purification step of Dps..………..………. 92
Figure D.4 – SDS-PAGE (12.5 % acrylamide) presenting Dps purification steps……….… 92
Figure F.1 – Dps sequence alignment data... 95
Figure F.2 – Alignment tree data for Dps from bacterial organisms……….…………. 96
Figure G.1 – Forward and reverse primer DNA sequence and purification state as ordered from StabVida……....………..……… 97
Figure H.1 – Voltammograms from cycle 2 of Dps with 24 Fe ratio added at the time of adsorption and electrolyte at 50 mV/s………...……….. 98
Figure H.2 – Voltammograms from cycle 2 of Dps with 24 Fe ratio added at the time of adsorption and electrolyte at 100 mV/s……….…… 98
Figure H.3 – Voltammograms from cycle 2 of Dps with 24 Fe added at the time of adsorption in the absence and the presence of H2O2versus control with electrolyte and H2O2 at 50 mV/s …...……… 99
Figure H.4 – Voltammograms from cycle 2 of Dps with 24 Fe added at the time of adsorption in the absence and the presence of H2O2versus control with electrolyte and H2O2 at 100 mV/s ....………. 99
Figure H.5 – Voltammograms from cycle 1 of apoDps, electrolyte, Dps with 24 Fe added at the time of adsorption and Dps incubated with 24 Fe at 50 mV/s ……..………...……….. 100
Figure H.6 – Voltammograms from cycle 2 of apoDps, electrolyte, Dps with 24 Fe added at the time of adsorption and Dps incubated with 24 Fe at 50 mV/s …………...………..……….. 100
Figure H.7 – Voltammograms from cycle 1 of apoDps, electrolyte, Dps with 24 Fe added at the time of adsorption and Dps incubated with 24 Fe at 100 mV/s….………..…….…. 101
Figure H.8 – Voltammograms from cycle 2 of apoDps, electrolyte, Dps with 24 Fe added at the time of adsorption and Dps incubated with 24 Fe at 100 mV/s ………..……..……….... 101
Figure H.9 – Voltammograms from cycle 1 of apoDps, electrolyte, Dps with 24 Fe added at the time of adsorption and Dps incubated with 48 Fe at 50 mV/s ………...…. 102
Figure H.10 – Voltammograms from cycle 2 of apoDps, electrolyte, Dps with 24 Fe added at the time of adsorption and Dps incubated with 48 Fe at 50 mV/s ………..…………..….. 102
Figure H.11 – Voltammograms from cycle 1 of apoDps, electrolyte, Dps with 24 Fe added at the time of adsorption and Dps incubated with 48 Fe at 100 mV/s …..………….…………..……….. 103
Figure H.12 – Voltammograms from cycle 2 of apoDps, electrolyte, Dps with 24 Fe added at the time of adsorption and Dps incubated with 24 Fe at 100 mV/s ………...……… 103
Figure H.13 – Voltammograms from cycle 2 of apoDps, supporting electrolyte, Dps : 6Fe : 6x15 H2O2 and 6x15 H2O2 at 20 mV/s …………...……… 104
Figure H.14 – Voltammograms from cycle 2 of apoDps, supporting electrolyte, Dps : 12Fe : 12x15 H2O2 and 6x15 H2O2 at 20 mV/s ………...……….……. 104
Figure H.15 – Voltammograms from cycle 2 of apoDps, supporting electrolyte, Dps : 24Fe : 24x15 H2O2, 24x15 H2O2 and 24 Fe:24x15 H2O2 at 20 mV/s ….………...…….……….. 105
Figure H.16 – Voltammograms from cycle 2 of apoDps, supporting electrolyte and Dps : 36Fe : 36x15 H2O2 at 20 mV/s …………...………..……...……….. 105
Figure H.17 – Voltammograms from cycle 2 of apoDps, supporting electrolyte, and Dps : 48Fe : 48x15 H2O2 at 20 mV/s ………...…… 106
Table Index
Table II.I – Correspondence table between reference electrode potentials used in this project vs.
Standard Hydrogen Electrode (SHE) ………...…..……….. 16
Table 4.I – Control assay cycle 2 peak potentials ……….……….. 33
Table 4.II – Possible occurring electrochemical processes in the above iron-loaded Dps voltammogram ……...……….………. 35
Table4.III – Redox peak potentials and currents for the anodic and cathodic peaks in the Dps assays and controls done in solution ………...………. 62
Table 4.IV – Pure Dps absorbance and concentration data ………...…...……….. 72
Table 4.V – Dps activity assay absorbance for apo and iron-incubated forms of Dps at 310 nm ... 73
Table A.1– Composition for 1 L LB culture medium ………...……… 81
Table B.I Stock solutions used for SDS-PAGE ………..………....………..…….…. 83
Table B.II Solutions used for manufacturing 1 SDS-PAGE 12.5 acrylamide gel …….………. 84
Table C.I – Rectified control results used to calculate the calibration curve. Corrections were made averaging the absorbance of zero iron ... 87
Table C.II – Differences between supposed iron ratios and experimental ratios in all stoichiometries used in the electrochemical assays ………...…………...……….… 87
Table C.III – Oxygen consumption at the Clark electrode for calibration ... 89
Table C.IV– Formal reduction potentials of electrochemical species studied in this work ..…….… 89
Symbols and Abbreviations
Symbols
Absx – Absorbance (x nm)
c – concentration (M)
ε - molar extinction coefficient (M-1 cm-1) E – redox potential (V)
EOCP – open circuit potential (V)
Ep – peak potential (V)
Epa – anodic peak potential (V)
Epc – cathodic peak potential (V)
E0’ – formal reduction potential (V)
ΔE – potential difference (V) I – electrical current (A)
Icat – catalytic electrical current (A)
Ip – maximum electrical peak current (A)
Ipa – maximum anodic electrical peak current (A)
Ipc - maximum cathodic electrical peak current (A)
MW – molecular weight n – number of electrons rpm – rotations per minute T – temperature (K)
Abbreviations
AES – Atomic Emission Spectroscopy Amp – Ampicillin
apoDps – Dps apoprotein bp – (DNA) base pairs CE – counter electrode CV – cyclic voltammetry DNA – deoxyribonucleic acid
Dps – DNA-binding protein from starved cells ds – double stranded
E. coli – Escherichia coli
ICP – Inductively Coupled Plasma
IPTG – Isopropyl-ß-D-1-thiogalactopyranoside
LB – Lysogeny Broth (aka Luria Broth / Luria Bertani) mUA – milliunits of absorbance
M. aquaeolei – Marinobacter aquaeolei
MOPS – 3-(N-morpholino)propanesulfonic acid MWCO – molecular weight cut-off
ODx – optical density (x nm)
PDB – Protein Data Bank ppm – parts per million PSA – Ammonium persulfate
SCE –Saturated Calomel Electrode SDS – Sodium Dodecyl Sulfate
SDS-PAGE – Sodium Dodecyl Sulfate Polyacrylamide Gel Electrophoresis ss – single stranded
SHE – Standard Hydrogen Electrode
TEMED – N,N,N’,N’-tetramethylethylenodiamine UV – ultraviolet radiation
Chapter I – Introduction
I.1 Iron – an essential element
As the second most abundant metal on Earth1, iron has been broadly available throughout evolution as a versatile cell component, for protein incorporation and as an electron carrier or a cell cofactor for several cell mechanisms – photosynthesis, respiration, nitrogen fixation or DNA (deoxyribonucleic acid) synthesis. Since it can adopt different oxidation states, spin states and redox potentials, depending on the surrounding ligand environment, it has long been considered as the ideal choice for protein incorporation dating back to early life and is now almost ubiquitous in all lifeforms2.
Iron chemical properties show its versatility as a protein cofactor transversally present in the three domains of life1. The cellular oxidant environment displaces the iron redox equilibrium favoring the formation of ferric iron. At physiological pH, iron is mostly present in two redox states, Fe(II) - relatively soluble ferrous iron (typically 10-8 M free cellular iron, s = 0.1 M) – and Fe(III) - insoluble ferric iron (s = 10-18 M cellular iron)3,4. Fe(II) is thermodynamically more stable than Fe(III), due to its standard redox potential (0.77 V vs. Standard Hydrogen Electrode, SHE 5).
Fe(III) reacts with several key cell anions (e.g. hydroxide anion, OH- 6), forming insoluble complexes in equilibrium with free iron, which lowers its bioavailability and thus hinders cell growth, rendering iron a limiting nutrient since the optimal iron concentration for bacterial growth is ~10-7 M. This situation interferes with normal cellular functions even in the short-term; thus, cells have ferritin-like iron storage proteins for cellular iron complexation3,6.
However, living organisms have to achieve efficient iron homeostasis, scavenging it to maintain adequate cellular supplies without reaching toxic concentrations. Iron storage as an inorganic mineral solubilized inside a protein core is one possible solution to maintain iron available inside the cell in an inherently non-toxic, easily accessible form6.
Another important cellular consequence in iron metabolism is its potential toxicity, due to formation of iron oxides and, further along, reactive oxygen species (ROS) according to the following reactions:
Fe
2++
O
2!
Fe
3++
O
2. (1.1)(1.2)
(1.3, Fenton reaction)
Addition of molecular oxygen to Fe(II) triggers iron oxidation and formation of ROS, mainly superoxide (O2-), hydroxy (OH-), hydroxyl radical (OH.), water (H2O) and hydrogen peroxide (H2O2).
2
O
2 !
+
2
H
+"
H
2
O
2+
O
2The Fenton reaction rate increases in the presence of bound iron7, from 76 M-1 Fe(II) s-1 to 2000-6000 M-1 s-1, upon binding of iron to DNA or nucleotides8. Consequently, even low H2O2 cellular levels
have a physiologically significant effect on DNA damage7.
While OH. and H2O2 are very reactive towards biological systems, participating in rapid biomolecular
degradation such as lipid peroxidation and DNA destruction9, H2O2 is inevitably formed during
aerobic respiration10,11, reacting rapidly with Fe(II) as is demonstrated on reaction 1.3. Hydrogen peroxide diffuses across cell membranes and is lethal to E. coli cells in both low (1-2 mM) and high (>20 mM) concentrations 12. At low H2O2 concentrations, cell death is considered to occur through
DNA damage mediated by H2O2-Fe(II)interaction9,13. Fe(III) can be reduced to Fe(II) through the
Haber-Weiss catalytic cycle14, involving several cytoplasmic reductants, among which .O2-:
(iron reduction, inverse 1.1) (1.3)
(1.4, Haber-Weiss reaction)
The iron-catalyzed Haber-Weiss reaction, which uses Fenton chemistry to obtain hydroxyl radical, is considered to be the main mechanism through which this radical is induced in biological systems14. In some cases, either .O2- or H2O2 can be directly implicated in cell damage or indirectly leading to
formation of increasingly oxidant species OH.7, as is presented in Figure 1.1.
Figure 1.1 – Reduction potentials of various oxygen species, assuming 1 M starting O2 concentration (adapted
from 7).
OH. is the main species mediating cell injury, targeting proteins, DNA and lipids. However, since OH. action is limited by diffusion, once formed it is unlikely to travel before oxidizing an available substrate. Consequently, OH. generation will mediate cell injury directly when near a vital cell7,9,15. ROS as a whole have a direct effect on DNA damage, increasing its general propensity for genetic mutations and transcription disregulation. DNA damage is caused by direct interaction (base or nucleotide damage), interference on DNA repair mechanisms, affecting cell division through carcinogen activation promotion.
O
2!+
Fe
3+"
Fe
2++
O
2H
2O
2+
Fe
2+!
OH
.+
OH
"+
Fe
3+O2
!+
H2O2
Fe catalysis
According to Andrews et al. 2, bacteria use several different strategies to ensure intracellular iron management:
1. Scavenging iron after high-affinity transport from the outside environment.
2. Deposition of intracellular iron as an additional iron source to be used when external supplies are limited.
3. Launch redox stress resistance systems inside the cell (repair of stress-induced damage and degradation of iron-induced ROS)
4. Control of iron cellular levels through down-regulating expression of iron-containing proteins under iron-restricted conditions.
5. Iron-sensitive regulatory system that coordinates expression of the aforementioned iron homeostatic machinery according to intracellular iron availability.
These strategies are differentially employed according to cell phylogeny, surrounding environment and ecological niche. However, ferritins protein are mainly responsible for iron storage (strategy 2) and a subset of them is also responsible for iron-induced cell repair (strategy 3). Namely, two types of iron storage ferritin proteins are currently recognized in eubacteria: maxiferritins and miniferritins, formed respectively by 24 and 12 homo-oligomers, which will be discussed below on section I.2.
I.2 Ferritin family proteins
Ferritins are ubiquitous iron storage proteins responsible for the control of iron phase transition between solid and solution, through effective utilization of oxygen to concentrate iron for protein biosynthesis. They are involved in several crucial cellular processes, such as respiration, nitrogen fixation, photosynthesis or DNA synthesis, precisely the same processes that need high levels of iron16.
Ferritins scavenge Fe(II) inside the cell and deposit it in the hollow central cavity in the oxidized ferric form. Namely, fast ferritins within which Dps are included have an iron incorporation mechanism that includes a ferroxidation step catalyzed in the ferroxidase centers located within the protein shell. The amino acid residues forming this site are highly conserved throughout both groups and interact with Fe(II), binding it on the first step of the iron uptake process, which will be discussed below.
joining together to form a nearly spherical shell surrounding a central hollow cavity that stores iron. n
varies between the subfamilies but not inside them. Thus, ferritins control the intracellular microenvironment, determining the mineral phase formed – if the protein is present, ferrihydrite is the iron precipitate formed; if no ferritin is present, the prevalent hydrous iron oxide is lepdocrocite or goethite17.
Maxiferritins (ferritin and bacterioferritin proteins) are composed of 24 identical subunits with one central ferroxidase center per monomer. They can accommodate a minimum of 2000-3000 iron atoms, while miniferritins (Dps) are composed of 12 identical subunits and can hold until ~500 iron atoms. Dps proteins have 2 ferroxidase centers per dimer, located at the two-fold interface between each two subunits18. In conclusion, maxi- and miniferritins have similar iron deposition properties, despite having different iron ferroxidation processes.
Ferritins are used as supramolecular templates for synthesis of nanoparticles inside the protein shell19 for several technological applications, because of their intrinsic mineralization capability and robustness at inhospitable conditions. Highlighting applications include construction platforms for antigen and vaccine development, cancer therapy, drug delivery and molecular imaging20. Future prospects for these proteins include study of iron core formation and mechanism of iron release in different cellular conditions and the elucidation of the DNA-binding mechanism, where applicable.
1.2.1 Dps proteins
In the last two decades, it has been recognized that a protein subfamily other than maxiferritins possesses both iron storage and detoxification capacity in bacterial cells. The Dps family (DNA-binding proteins from starved cells) is highly conserved throughout Bacteria (shown on Appendix G.1), which make 97% or the family 20-23 or contain similarities with other ferritin proteins24; some related proteins have also been found in Archaea25,26. Dps proteins were named after the discovery of the prototype originating from Escherichia coli, expressed under starvation or oxidative stress22 and were found to be crucial for long-term stationary-phase viability under starvation conditions27.
Originally, Dps proteins were found to protect DNA from oxidative damage through extremely stable complexation without sequence specificity28, size or topology both in vitro and in vivo. Cells lacking Dps alter their protein expression pattern dramatically during starvation and do not develop starvation-induced resistance to H2O2 22. Dps synthesis is induced upon the late stationary growth
cage in which iron is transiently stored or made available to cells, but also a trap for oxidant molecules and free electrons that are otherwise generated31.
More recent findings recognized that Dps proteins have ferritin-like properties such as detoxification mechanisms upon exposure to both iron and H2O2. Several Dps proteins have been identified over the
last decades21,23,30,32-42, not all of which bind DNA30,43-45. Furthermore, Dps proteins have been found to protect DNA from pH stress27,46 and ionizing and ultraviolet radiation27,33. Other possible functions of Dps proteins include managing copper homeostasis27,47, zinc removal48 increased survival of virulent bacteria35, a negative role in regulation of antibiotic resistance49, in vitro and in vivo
neurotoxin50, temperature resistance27 and virulence51,52.
With 23-point-group symmetry, the Dps protein is a homododecamer with a ~40 Å central cavity that can store up to 500 irons. The ~20 kDa monomers spontaneously fold to 4-helix (A–D) bundles and then to the quaternary structure (as four trimers at tetrahedron vertices) which resembles a hollow sphere with 8-9 Å external and 4-5 Å internal diameter (Figures 1.2 and 1.3).
Figure 1.2 – Dps homododecamer from E. coli (PDB source file: 1dps), drawn on Chimera53.
Figure 1.3 – A) Dps homododecamer (12 chains); B) Incomplete Dps homodecamer (excluding one monomer), both drawn on Chimera53 (PDB source file: 1dps).
Figure 1.4 – E. coli Dps surface electrostatic charge (PDB source file: 1dps). The homododecamer is shown in 3D with positive residues shown in blue, neutral residues in white and negative residues in red. This figure was drawn on Swiss Pdb Viewer54, using Poisson-Boltzmann computation method, 0.4 M ionic strength and default dielectric constants (4 for Dps and 80.1 for solvent).
Figure 1.5 –Dps monomer from E. coli (PDB source file: 1dps) showing 4 antiparallel helices and the
ferroxidase center (green sphere). This figure was drawn on Chimera 53.
No mineral core formation has been detected in the protein assembly process – Fe(II) is scavenged to form the mineral after the first incorporation step (ferroxidation). The ferroxidation sites are located at the subunit dimer interface opposite the mineralization cavity. Each ferroxidation site is formed by amino acid residues from the 2 adjacent subunits and is highly conserved throughout eubacteria20,57. The molecule symmetry means that two different channel types are present along the three-fold axes, one of which is hydrophilic and is proposed to be the one through which Fe(II) accesses the central Dps cavity6,58.
Several studies have been conducted to understand the consequences of DNA binding to Dps, and it has been found that in E. coli, Dps is induced in two situations:
- during cell growth, OxyR, a redox-sensitive transcriptional activator present in gamma-Proteobacteria59,60 acts as a metabolic feedback for the cell and the community through H2O2
level regulation61;
- at stationary phase, σS is a transcription initiation factor which directs RNA polymerase core enzyme to activate mainly stress-related promoters, while IHF histone-like protein controls some Dps dependent expression20,62.
Dps is also regulated by growth-phase dependent degradation upon the action of ClpXP and ClpAP proteases63. As a regulatory protein, it is also one of the main participants of DNA structure regulation during environmental stress, promoting transition from unpacked to condensed nucleoid, which is critical for DNA-Dps crystallization64-66. On the other hand, Dps levels are also controlled by proteolysis during carbon-abundant conditions20,63.
While the results obtained by Zhao et al. pointed to a dual protective action being done by Dps, through physical association with DNA and nullification of the toxic combination of Fe(II) and H2O267, Dps function was found until recently to be mutually exclusive20. To achieve cell viability in
the stationary growth phase, iron incorporation leads to H2O2 elimination and avoidance of Fenton
chemistry, storing Fe(III) oxides in the Dps core. This process will be discussed in the next section.
I.2.1.1 Iron incorporation
The iron oxidation reaction path has been determined in both Listeria innocua and E. coli Dps45,67 and involves five consecutive phases schematized in Figure 1.6:
1. iron entry inside the protein;
Figure 1.6 – Possible iron paths in Dps. Fe(II) enters the dodecamer through N-terminal pores (1),binds to the ferroxidase center (2) oxidizes to Fe(III) (3) and mineralizes in ferrihydrite form from a nucleation/core center. Fe(III) can reduce back to Fe(II) and leave the Dps shell through C-terminal pores (adapted from 20).
The ferroxidation reaction with H2O2 as an oxidant occurs as follows:
(1.5)
(1.6 - iron oxidation) (1.7- iron core mineralization)20,67
PZ represents the Dps apoprotein and [Fe2-P]Z+2 the bimetallic iron complexed to the ferroxidase center. In reaction 1.6, Fe(II) oxidizes to Fe(III) as [Fe2O2(OH)-P]Z, an oxidized iron complex in the
ferroxidase center. Afterwards, iron suffers mineralization as hydrous Fe(III) oxide (FeOOH). In Dps proteins, the ferric core formation happens faster than the ferroxidation reaction45,67 and enables Dps to obtain up to 500 Fe (III) per dodecamer. Several Dps structures have been presented with either one or two bound irons or two H2O molecules, indicating influence of the second metal coordination
shell55. Dps water ligands, in particular, are highly conserved and may be involved in protein stability, flexibility and continuing subunit association68. Iron in ferritin biominerals occurs differently in vitro
and in vivo, albeit always in an acidic formation surface16.
Dps can also utilize O2 as an oxidant, albeit with 1000-fold lower intensity45,67. This reaction path is
shown below:
(1.5)
(1.8) (1.9)
[
]
2 22
2Fe ++PZ → Fe −P z+ +2H+
[
]
2(
)
2 2 2 2 2 2
3
Z Z
Fe
−
P
++
H O
+
H O
→
⎡
Fe O
OH
−
P
⎤
+
H
+⎣
⎦
2 3
2 2 2
2 2 2 4
core
Fe ++H O + H O→ Fe +OOH + H+
[
]
2 22
2Fe ++PZ → Fe −P z+ +2H+
[
]
2[
]
2
1
2
2 2 2(
)
22
Z Z
Fe
−
P
++
O
+
H O
→
Fe OH
−
P
+
H
+2
2 2
Each binding site of the 12 bimetallic ferroxidase centers in the Dps antiparallel dimer is composed of four highly conserved amino acid residues from both symmetry-related subunits as is shown below on Figure 1.7 – two histidines (His), one aspartic acid (Asp) and one glutamic acid (Glu) – as well as two conserved residues: one tryptophan (Trp) ~3Å away from site A, present on 99% of reported Dps sequences and a nearby tyrosine (Tyr), that form short-lived intraprotein species that act as radical traps31,55.
Figure 1.7 - Dps ferroxidase centers from E. coli, showing the high affinity A site (coordinated by histidine and
carboxylate residues) and the low affinity B site (coordinated by carboxylate residues). One Dps monomer provides both histidine residues, while the remaining monomer provides two carboxylate residues (adapted from 55).
Dps proteins have 23 symmetry points; hence, the dodecameric structure has a total of eight trimeric interfaces, formed at the N- or C-terminus ends. Hydrophilic pores formed at the N-terminus are 10 Å long, negatively charged and between 9-17 Å (external diameter) and 7-11 Å (internal) wide, based on distances between Cα; their cationic transport function is characteristic of both Dps and ferritins: negatively charged pores attract positive metallic ions through an electrostatic gradient, from the outside environment to the ferroxidase center and onwards to the Dps core; the same pores are also thought to be useful as an iron exit route. Hydrophobic, less conserved pores formed at the C-terminus are 7-21 Å long, between 6-14 Å (external diameter) and 8-10 Å (internal) wide, based on distances between Cα. Because of these properties, C-terminus pores have been considered to be either a iron exit route or an auxiliary cation passage route after protein rearrangements, since their hydrophobicity makes them an unlikely target for main cation passage20,33.
According to Zhao et al.67, this mineralization reaction, as well as the ferroxidation reaction, occurs with rapid and complete ferrous ion oxidation with 2Fe(II): H2O2 stoichiometry. Hydrogen peroxide
is, consequently, a more efficient oxidant for Dps than O2. It has also been discovered that the
Although the ferritin studies began to provide answers to some ferritin-related questions, such as the exploitation of the ferritin cage-like structure for novel (nano)materials and drug-delivery systems20, some questions concerning ferritin proteins remain grossly unanswered, such as understanding protein nanocage and cavity assembly and information about the physiological electron and proton donors to the iron mineral.
According to Bellapadrona et al. 31, conserved amino acid residues in Dps trap oxidants inside the protein shell. Furthermore, free cytoplasmatic Fe(II) levels are very low under stationary-phase conditions, which makes the earlier accepted mechanism unlikely to occur45 and further validates the model proposed by Bellapadrona, in which odd numbers of electrons and consequently of intraprotein radicals trapped in the protein shell are of greatest coherence to the protective role of Dps. The aforementioned Trp adopts a radical form on iron oxidation by addition of H2O2, preventings ROS
diffusion into the cellular environment and consequent DNA damage31.
Nucleation sites at the Dps core manage early stages of oxidized iron mineralization as ferrihydrite. Dps nucleation site residues include non-conserved amino acid residues common to L-chain ferritin (at the twofold symmetry axis), aided by several negatively charged amino acids surrounding the ferroxidase center that can direct nucleation. As the nucleated ferric mineral grows, Fe(II) ions flowing into the core can oxidize at the surface of the growing mineral, as has been observed in ferritins20.
Greater cellular iron bioavailability in the cell is largely due to Dps, as it has been proposed that a small amount of iron is cyclically released from and re-deposited into the Dps core20. The two different types of iron core in Dps have been extensively studied by a variety of techniques including Mössbauer, X-ray absorption and polarized single-crystal absorption spectroscopies. The native core is present in purified Dps without further iron additions, as well as an in vitro loaded Dps core, formed after iron addition. This core normally contains iron atoms with different phosphate ratios32, although other metals can also be present – Zn, Cu, Cr, Mn, Co, Ni and Mo69. The in vitro core contains up to 500 iron atoms and is structurally irregular, possibly existing as a mixture of octahedrally and tetrahedrally coordinated ferrihydrite32. This core is consistent with cellular iron distribution needs, making iron more readily available than the crystalline state of the native core.
I.2.1.2 Cell defense mechanisms: oxidative stress
Fenton chemistry avoidance by Dps appears to only be fully achieved if Fe(II) and H2O2 are added in
Excess amounts of iron and superoxide radicals were found to be responsible for OH. generation and consequent formation of DNA lesions and hypermutability70. Consersely, it has been discovered that Dps knockout organisms have extreme sensitivity to H2O2 even at low concentrations (0.5 mM), with
96% decline in survival71.
I.2.1.3 Cell defense mechanisms: DNA interaction
DNA structure was discovered in 1953 by Watson and Crick, from X-ray diffraction data obtained by Wilkins and Franklin. DNA is more frequently found double-stranded (ds), formed by 2 antiparallel nucleotide chains, each in the 5’-3’ direction and connected through chemical interactions shown below in Figure 1.8 in the most frequently found B-form DNA. Nucleotides are composed of pentose rings connected to a phosphate group and a nucleobase (adenine (A), cytosine (C), guanine (G) and thymine (T)). Less stable single stranded DNA (ssDNA) is also found inside cells.
Figure 1.8 – A. 3D scheme B-form DNA, showing differently colored antiparallel strands with major and minor grooves; B. 2D molecular DNA scheme showing 3 types of chemical interaction: I – phosphodiester bond between a phosphate group and 2 pentoses (5-carbon rings); II – hydrogen bonds between 2 nucleobases (2 for AT, 3 for CG); III – weak hydrophobic interactions between adjacent nucleobases in the same nucleotide chain (adapted from 72).
Nucleic acids suffer spontaneous decomposition in solution, releasing free base residues (guanine and adenine) as a function of pH, temperature, ionic strength and secondary structure. In vivo, B-DNA present in metabolically active cells is expected to undergo depurination at similar rates to that in solution74. A 1972 study estimated the depurination rate of Bacillus subtilis DNA75 as 0.5 purine bases lost on the bacterial genome per generation.
A study by Frienkel-Krispin et al. 76 has shown that bacterial cytoplasm has hierarchical spatial organization, both with non-random protein and genomic DNA localization. This is only possible through permanent energy consumption, to obtain a non-uniform organization and polarized exchanges. However, during stationary growth phase, bacteria become increasingly ineffective at managing energy, switching from a dynamic order to a stepwise structure assembly consisting of DNA-Dps co-crystals that physically sequester DNA molecules. According to this study, during starvation DNA lies between a lipid layer and hexagonally packed Dps76.
Ferritin regulation in bacteria has only one genetic target – DNA – responding to several different environmental signals during growth or stationary state, whether it is through iron levels or other stationary state levels, or nutrient and ROS levels during active growth77.
When Dps was discovered in E. coli with non-sequence specific binding and DNA co-crystallization was found to be resistant to detergents, solvents and temperature up to 100ºC 22, consistent with a generic defense strategy for efficient protection against environmental stress. Dps induction in E. coli
allows for continuous cell growth, revealing that Dps evolution rendered it capable of two different activities under different cell environments; during cell growth, iron sequestration appears to be sufficient to protect DNA from ROS during log growth phase; in contrast, the predominant Dps function during the stationary growth phase is DNA protection11.
The direct, physical protection of Dps is ensured through efficient DNA complexation, also known as stress-induced biocrystallization21,64, which provides generalized wide-range DNA protection crucial for prokaryote survival, as a growth-phase-dependent mechanism. Doubly charged cations are crucial to DNA-Dps co-crystallization, acting as ion bridges to the negatively charged Dps dodecamer during the late stationary phase. Specifically, when Mg2+ levels are lower than 5 mM, crystal formation and consequent DNA protection are possible21.
Dps prevents DNA strand breaks and mutagenic events introduced by H2O2in vivo, independently of
addition order of Fe(II) and H2O2 and focusing particularly on guanine protection62. However, Dps
overexpression during log growth phase does not cause co-crystallization due to high nutrient availability for bacterial multiplication21.
seems to require a flexible N-terminal domain79, while self-aggregation and DNA condensation need at least one lysine residue. When protonated, the last 3 N-terminus Lys residues interact with unprotonated surface carboxyl groups from adjoining Dps molecules78. Non-DNA binding Dps, either contain shorter or less flexible N-terminal regions18,43, also protect DNA from stress conditions42. The indirect, chemical in vitro DNA protection by Dps does not require DNA-Dps complexation, but rather Dps ability to scavenge iron from the cell compartment and limit ROS formation under starvation conditions34,43. According to Martinez and Kolter62, complete in vitro DNA-Dps binding elicits maximum protection against oxidative stress in a 1.4 bp DNA : Dps ratio, given that Dps binds both major and minor grooves in DNA.
Chapter II – Instrumental Methods
II.1 Electrochemical fundamentals: Bioelectrochemistry as a tool for studying biological
systems
Electrochemistry is primarily concerned with the connection between the chemical and electrical effects on substances. Since the invention of the electrochemical cell in 1800 by Volta, several electrochemical techniques have been developed to perform quantitative, qualitative and monitoring biochemical analysis for many purposes80.
The main principle of electrochemistry is the occurrence of redox reactions, which involve simultaneous gain (reduction) and loss (oxidation) of electrons by two different chemical species, monitored by an electrode in a controlled environment:
Red à Ox + ne- (2.1),
where Red and Ox are respectively the reduced and oxidized species and n is the number of electrons. The resulting current is proportional to the electrode reaction rate, and depends on the rates of the processes listed below:
1. Mass transfer (e.g., transport of Red or Ox to the electrode surface) 2. Electron transfer at the electrode surface
3. Chemical reactions occuring at or before the electron transfer
4. Physical reactions at the electrode surface (adsorption, desorption, crystallization).
Two main types of techniques can be distinguished in analytical electrochemistry81:
- Potentiometry determines the potential (E) of electrochemical cells at approximately zero current, where E is proportional to the activity of the species under study, in relation to a standard reference electrode (e.g., the ubiquitous pH meter);
- Amperometry is significantly more versatile, since it is based on passing current (I) whose intensity is proportional to the electrolyte concentration, through a polarizable electrode. It can be further divided into several other techniques, among which voltammetry and chronoamperometry, which have been used on this thesis.
II. 2 Electrochemical techniques
The observed potentials at which any redox reaction occur on the electrochemical assays will always be shown with respect to their reference potentials (Saturated Calomel Electrode (SCE) or silver/silver chloride (Ag/AgCl peek – polyether ketone)). As such, Table II.I below shows each reference electrode potential with respect to the Standard Hydrogen Electrode (SHE), whose potential has been conventionally decided as zero.
Table II.I – Correspondence table between reference electrode potentials used in this project vs. Standard Hydrogen Electrode (SHE).
Reference electrode Electrode potential (vs. SHE), at T=25ºC
SCE 0.2412 V
Ag/AgCl 0.236 V
II.2.1 Cyclic voltammetry
Cyclic voltammetry is efficient for rapid observations of redox behavior throughout a broad range of potential. It is also a good methodology for quantitative determination and mechanism elucidation, since Ip (current peak) is proportional to the analyte concentration.
During a voltammetry assay, electrode potential is linearly swept and the resulting current is monitored as a result of working electrode polarization (driving the potential away from equilibrium or open-circuit conditions, as a function of time). In this 3 electrode technique, electrochemical behavior is monitored at the working electrode (WE), immersed in an electrolyte solution containing ions which allow conductivity passage; a reference electrode (RE) with a fixed, known potential is used to measure a potential difference between the WE and the RE. The absolute voltage value can then be calculated through the standard hydrogen electrode (SHE) corresponding Table II.I above. The remaining electrode is the counter electrode (CE), used to favor current passage at the WE. Therefore, while WE potential is measured with respect to the RE which is itself at equilibrium, WE current is observed with respect to the CE; it should be noted that the WE and the CE should have approximate surface areas.
Peak current has two components: capacitive current is the initial adjustment of superficial analyte concentration to its equilibrium constant through double layer unloading (given by the Nernst equation); whereas faradaic current is controlled by diffusion. The capacitive component decays rapidly as the diffusion layer extends progressively farther away from the WE surface.
Regarding cyclic voltammetry, the electrode potential is varied from the equilibrium value (EOCP, at
the open circuit potential) to a vertex potential, where the potential scan direction is reversed, according to
(2.2, 2.3)
Figure 2.1 summarizes the technique. The electrochemical sign reads as a triangular potential vs. time wave between vertex potentials; measured current is plotted against potential resulting in a cyclic voltammogram.
Figure 2.1 – Scheme of a cyclic voltammetry assay, including electrochemical cell (A), potential scan over time plot (B) and a voltammogram showing current variation as a function of applied potential (C). Legend: ipc/a=cathodic/anodic peak current; Epc/a=cathodic/anodic peak potential82.
The cyclic voltammogram above shows two redox peaks (Epc/a=cathodic/anodic peak potential),
belonging to the forward and reverse sides of the plot, of similar shape and identical intensity. Thus, these peaks are indicative of an electrochemically reversible reaction or system. If the mass transport is controlled by diffusion, molecule movement in solution will obey Fick’s Law:
(2.4),
which asserts that molecular diffusion flux (J) moves from high concentration to low concentration areas (concentration ϕ) in a finite compartment of length x, depending on the diffusion coefficient D.
(
)
(
)
0 ,
, 2
i
i
t E E t
t E E t
λ ν
λ νλ υ
< ≤ = −
> = − +
J=!D
!"
Reversible systems/reactions obey five rules:
1. (2.5, equal current intensity in both redox peaks) 2. Epc and Epa independent of scan rate (v)
3. (2.6)
4.
5. (2.7, T=298 K)
Mass transport can also be controlled by convection and adsorption. While the first will not be covered in this work, the diffusive transport control system will obey the Randles-Sevcik equation:
(2.8)
This equation asserts that redox peak current is proportional to scan rate (v), n transferred electrons at a given concentration (C, mol/L) of the electrochemically active protein (n) and D.
The non-diffusive transport control system will obey equation 2.9,
ip=n 2
F2 4RT
!
A!*
0(2.9)
Peak current is proportional to scan rate (v) and the active adsorbed electrochemical species (Γ*0) on
adsorption assays.
In this work, the Langmuir isotherm was applied to the electrochemical system, which predicts a flat electrode surface, adsorption saturation at high solute/protein levels and no interaction between adsorbed molecules. From that system, it is observed that the surface coverage (θ) is proportional to electroactive surface concentration, until a threshold limit (equation 2.9). The adoption of Langmuir isotherm was chosen since it is predicted that the adsorbed amount and tri-dimensional constraints will avoid interprotein interactions and thus validate the equation below:
(2.10)
In metallic electrodes, specific adsorption is more efficient if the electroacive species is negatively charged, since in that situation, electrode metals can be seen as a cationic net around and through which electrons circulate freely. This situation is advantageous to the system in study, since Dps surface charge is partially negative, as can be seen in Figure 1.4.
pc pa
I =I
0 '
2
pc pa
E E
E = +
1 2 p
Iαv
0.059 pc pa V E E n − =
i
p=
(2.69
X
10
5
)
n
3/2ACD
1/2v
1/2,