UNIVERSIDADE NOVA DE LISBOA
Faculdade de Ciências e Tecnologia
Departamento de Informática
Assessment of IT Infrastructures:
A Model Driven Approach
“Dissertação apresentada na Faculdade de
Ciências e
Tecnologia da Universidade Nova de Lisboa para obtenção
do Grau de Mestre em Engenharia Informática.
”
Caparica
Outubro de 2008
Orientador: Prof. Doutor Fernando Brito e Abreu
Luís Alexandre Ferreira da Silva
iii
Acknowledgments
First, I would like to thank and express sincere appreciation to my supervisor Prof. Doutor Fernando Brito e Abreu for his constant assistance and support in the preparation of this dissertation. During
the course of my Master’s thesis studies he has been a source of encouragement and friendship, for which I am very grateful. In addition, I would like also to thank Prof. Doutor Pedro Medeiros, for the initial input in the beginning of this project.
I would like also to thank to all the people that reviewed and provided comments regarding this research work. In particular I would like to thank to the members of the QUASAR group in particular to Anacleto Correia, Raquel Porciúncula, Miguel Goulão, João Caldeira, Jorge Freitas and José Costa.
Last but not least
,
I am grateful to my family and in particular to my girlfriend Luzia Valentim for theirv
Resumo
Têm sido propostas várias abordagens para avaliação de arquitecturas infra-estruturais de Tecnologia de informação (TI) maioritariamente oriundas de empresas fornecedoras e consultoras.
Contudo, não veiculam uma abordagem unificada dessas arquitecturas, em que todas as partes envolvidas possam cimentar a tomada de decisão objectiva, favorecendo assim a comparabilidade, bem como a verificação da adopção de boas práticas. O objectivo principal desta dissertação é a proposta de uma aproximação guiada pela modelação dos conceitos do domínio, que permita
mitigar este problema.
É usado um metamodelo para a representação do conhecimento estrutural e operacional sobre infra-estruturas de TI denominado SDM (System Definition Model), expresso com recurso à linguagem UML (Unified Modeling Language). Esse metamodelo é instanciado de forma automática através da captura de configurações infra-estruturais de arquitecturas distribuídas em exploração,
usando uma ferramenta proprietária e um transformador que foi construído no âmbito desta dissertação. Para a prossecução da avaliação quantitativa é usada a aproximação M2DM
(Meta-Model Driven Measurement), que usa a linguagem OCL (Object Constraint Language) para a
formalização de métricas adequadas.
Com a abordagem proposta todos os parceiros envolvidos (arquitectos de TI, produtores de aplicações, ensaiadores, operadores e equipas de manutenção) poderão não só perceber melhor as infra-estruturas que têm a seu cargo, como também melhor expressar as suas estratégias de gestão e evolução. Para ilustrar a utilização da aproximação proposta, avaliamos a complexidade de alguns casos reais nas perspectivas sincrónica e diacrónica.
Palavras-chave
Avaliação quantitativa, infra-estrutura, System Definition Model, complexidade de infra-estruturas,
vii
Abstract
Several approaches to evaluate IT infrastructure architectures have been proposed, mainly by supplier and consulting firms. However, they do not have a unified approach of these architectures
where all stakeholders can cement the decision-making process, thus facilitating comparability as well as the verification of best practices adoption. The main goal of this dissertation is the proposal of a model-based approach to mitigate this problem.
A metamodel named SDM (System Definition Model) and expressed with the UML (Unified
Modeling Language) is used to represent structural and operational knowledge on the
infrastructures. This metamodel is automatically instantiated through the capture of infrastructures configurations of existing distributed architectures, using a proprietary tool and a transformation tool that was built in the scope of this dissertation.
The quantitative evaluation is performed using the M2DM (Meta-Model Driven Measurement)
approach that uses OCL (Object Constraint Language) to formulate the required metrics. This proposal is expected to increase the understandability of IT infrastructures by all stakeholders (IT architects, application developers, testers, operators and maintenance teams) as well as to allow expressing their strategies of management and evolution. To illustrate the use of the proposed
approach, we assess the complexity of some real cases in the diachronic and synchronic perspective.
Keywords
ix
Table of Contents
Acknowledgments ... iii
Resumo ... v
Abstract ... vii
Table of Contents ...ix
Table of Figures ... xv
Table of Tables ... xvii
1 Introduction
... 1
1.1 Motivation ... 2
1.1.1 The importance of evaluating ITIs ... 3
1.1.2 Stakeholders interested in ITIs evaluation ... 4
1.2 Complexity ... 6
1.2.1 Complexity metrics ... 6
1.2.2 Comparing infrastructures complexity ... 7
1.2.3 Forecast of ITI complexity ... 7
1.3 Total cost of ownership ... 9
1.3.1 Reducing ITIs TCO... 10
1.3.2 The impact of ITIs complexity on TCO ... 10
1.4 IT Service Management... 13
1.4.1 ITIL ... 13
1.4.2 COBIT ... 14
1.5 Research objectives roadmap ... 16
1.5.1 Best practices roadmap ... 16
1.5.2 TCO forecast roadmap ... 18
1.6 Expected contributions ... 20
1.7 Document structure and typographical conventions ... 21
2 Related Work
... 23
2.1 Taxonomy for supporting the survey ... 24
2.1.1 Complexity evaluation ... 24
2.1.2 Evolution analysis ... 24
2.1.3 Best practices assessment ... 25
2.1.4 ITI modeling ... 25
2.1.7 Sample ... 26
2.1.8 Results validation ... 27
2.2 Survey ... 27
2.2.1 Evaluation 1 – [Juurakko, 2004] ... 28
2.2.2 Evaluation 2 – [DiDio, 2004b, DiDio, 2004a] ... 29
2.2.3 Evaluation 3 – [Cybersource, et al., 2004] ... 30
2.2.4 Evaluation 4 – [Wang, et al., 2005] ... 31
2.2.5 Evaluation 5 – [CIOview, 2005] ... 31
2.2.6 Evaluation 6 – [Wipro, et al., 2007] ... 32
2.2.7 Evaluation 7 – [Jutras, 2007] ... 33
2.2.8 Evaluation 8 – [Troni, et al., 2007] ... 33
2.3 Comparative analysis ... 34
3 ITI Modeling
... 37
3.1 Introduction ... 38
3.2 Meta-Model Driven Measurement (M2DM) ... 38
3.3 Modeling languages ... 39
3.3.1 Unified Modeling Language ... 39
3.3.2 System Definition Model ... 40
3.3.3 Service Modeling Language ... 40
3.4 Modeling language selection... 41
3.4.1 Unified Modeling Language ... 42
3.4.2 System Definition Model ... 43
3.4.3 Service Modeling Language ... 44
3.5 Comparative analysis ... 45
3.6 The chosen metamodel structure ... 46
3.7 Modeling using SDM language ... 50
4 Evaluation Approach
... 55
4.1 Bootstrapping the application of M2DM ... 56
4.1.1 SDM metamodel conversion ... 56
4.1.2 Metamodel semantics enforcement ... 58
4.1.3 The SDM library for ITIs (ITILib) ... 60
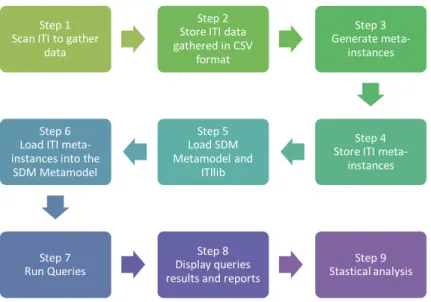
4.2 The approach step-by-step ... 61
4.2.1 ITI data gatherer ... 64
4.2.2 ITI Meta-instances generator ... 66
4.2.3 ITI evaluator ... 68
4.2.4 Statistical analyser ... 69
4.3 Categorization of the evaluation approach ... 69
5 ITI Assessment
... 71
5.1 Introduction ... 72
5.2 Sizing analysis ... 72
5.3 Complexity analysis ... 78
xi
5.3.2 Complexity metrics ... 84
5.4 Best practices analysis ... 98
5.4.1 Best practices description ... 99
5.4.2 Formal specification of best practices ... 102
5.4.3 Detecting best practices violations ... 103
6 ITI Topology Detection
... 105
6.1 Introduction ... 106
6.2 Simulated sample ... 106
6.3 Variable reduction ... 108
6.4 Multinomial logistic regression ... 110
6.4.1 Definitions ... 111
6.4.2 Regression using three variables ... 113
6.4.3 Regression using two variables ... 114
6.4.4 Regression using one variable (ITF_Sites) ... 116
6.4.5 Regression using one variable (IMF_Sites) ... 117
6.5 Experiments ... 118
7 Conclusions and Future Work
... 123
7.1 Review of contributions ... 124
7.2 Limitations ... 125
7.3 Future work ... 126
Bibliography ... 129
Appendix A
–
SDM Definitions
... 141
Appendix B
–
ITILib
... 149
Appendix C
–
The SDM Schema
... 171
xiii
Acronyms
ACM The Association for Computing Machinery APC American Power Conversion
CA Computer Associates International CAPEX Capital expenditures
CCM Cyclomatic Complexity Metric
CCTA Central Computer and Telecommunications Agency CEO Chief Executive Officer
CIM Common Information Model CIO Chief Information Officer
CMDB Configuration Management Database CLR Common Language Runtime
CNC Coefficient of Network Complexity
COBIT Common Objectives for Information and related Technology CSV Comma-Separated values
CSVDE Comma-Separated values Directory Exchange DMTF Distributed Management Task Force
DSI Dynamics Systems Initiative DSL Domain Specific Language ERP Enterprise Resource Planning eTOM enhanced Telecom Operations Map HKM Henry and Kafura Metric
HP Hewlett-Packard
HIPAA Health Insurance Portability and Accountability Act IEEE Institute of Electrical and Electronics Engineers IETF Internet Engineering Task Force
IMPEX Implementation Expenditures
ISACA Information Systems Audit and Control ISO International Organization for Standardization ITAA Information Technology Association of America
ITU-T International Telecommunication Union Telecommunication Standardization IT Information Technology
ITI Information Technology Infrastructure ITIL Information Technology Infrastructure Library
ITILib The SDM Information Technology Infrastructure Library ITGI IT Governance Institute
ITSM Information Technology Service Management itSMF IT Service Management Forum
MSFT Microsoft Corporation
MOF Microsoft Operations Framework MPLS Multiprotocol Label Switching
NGOSS Next Generation Operation Support and Software NDS Novell Directory Services
OCL Object Constraint Language OGC Office of Government Commerce OMT Object Modeling Technique OO Object Oriented
OOSE Object-Oriented Software Engineering OPEX Operating Expenditures
PRM-IT Process Reference Model for IT RFC Request For Change
ROI Return of Investment
SAP Systems Applications and Products SDM System Definition Model
SID Shared Information/Data model
SBLIM Standards Based Linux Instrumentation for Manageability SML Service Modeling Language
SMI-S Storage Management Initiative - Specification SOX Sarbanes-Oxley
SPSS Statistical Package for the Social Sciences STB Server and Tools Business Division TAM Telecom Application Map
TCO Total Cost of Ownership TEI Total Economic Impact UML Unified Modeling Language
USE UML based Specification Environment UoD Universe of Discourse
W3C World Wide Web Consortium WFR Well-Formedness Rules
WMI Windows Management Instrumentation XML eXtensible Mark-up Language
xv
Table of Figures
Fig. 1.1 ― IT Ecosystem Is Complex (source:[Symons, et al., 2008]) ... 8
Fig. 1.2 ― TCO per end user at various complexity levels (source: [Kirwin, et al., 2005]) ... 12
Fig. 1.3 ― Complexity and the value of IT (source: [Harris, 2005]) ... 12
Fig. 1.4 ― End-to-end ITIL process (source:[Watt, 2005]) ... 14
Fig. 1.5 ― COBIT framework domains (source:[Symons, et al., 2006]) ... 15
Fig. 1.6 ― Roadmap (best practices) ... 17
Fig. 1.7 ― Roadmap (cost versus complexity) ... 18
Fig. 1.8 ― Roadmap (best practices) ... 19
Fig. 2.1 ― Total Cost of Ownership for TETRA networks (source:[Juurakko, 2004]) ... 28
Fig. 2.2 ― Extending Oracle 8i or migrating to SQL Server (source: [CIOview, 2005]) ... 32
Fig. 2.3 ― Average PDA and Smartphone TCO (source: [Troni, et al., 2007]) ... 34
Fig. 3.1 ― Application of SDM core types ... 47
Fig. 3.2 ― Application of SDM relationship types ... 48
Fig. 3.3 ― The four layers of SDM ... 50
Fig. 3.4 ― SDM definition for Lisbon site ... 52
Fig. 3.5 ―Client and ServerEndpoints ... 53
Fig. 3.6 ―ClientDefinition and ServerDefinition ... 54
Fig. 3.7 ― Compilation of SDM document ... 54
Fig. 4.1 ― The SDM metamodel conversion ... 56
Fig. 4.2 ― SDM metamodel to model for ITIs ... 57
Fig. 4.3 ― WFR for multiple contained objects ... 58
Fig. 4.4 ― WFR for definition of the membership of servers ... 58
Fig. 4.5 ― WFR for definition of the membership of subnets ... 59
Fig. 4.6 ― WFR for definition the membership of servers and sites ... 59
Fig. 4.7 ― WFR for definition of the types of members allowed in a server communication ... 59
Fig. 4.8 ― WFR for definition of the types of members allowed in a site communication ... 60
Fig. 4.9 ― WFR for definition of the membership of endpoints ... 60
Fig. 4.10 ― SDM metamodel with ITILib operations ... 61
Fig. 4.11 ― Steps to perform ITI evaluations ... 62
Fig. 4.12 ― Evaluation approach illustration ... 63
Fig. 4.15 ― Meta-object diagram for the Lisbon site ... 67
Fig. 5.1 ― ITI with a large number of sites ... 73
Fig. 5.2 ― Open USE specification ... 74
Fig. 5.3 ― Load SDM metamodel into USE... 74
Fig. 5.4 ― Command lines in USE ... 75
Fig. 5.5 ― Sizing metrics defined in ITILib ... 77
Fig. 5.6 ― Queries to ITI using sizing ITILib operations ... 78
Fig. 5.7 ― Backbone network topology ... 80
Fig. 5.8 ― Unidirectional ring network topology ... 81
Fig. 5.9 ― Bidirectional ring network topology ... 82
Fig. 5.10 ― Centralized network topology ... 83
Fig. 5.11 ― Fully meshed network topology ... 84
Fig. 5.12 ― Coefficient of network complexity ITILib operations ... 85
Fig. 5.13 ― Cyclomatic complexity ITILib operations ... 87
Fig. 5.14 ― Henry and Kafura complexityITILib operation ... 89
Fig. 5.15 ― Infrastructure topology ITILib operations ... 92
Fig. 5.16 ―Site topologyITILib operations ... 94
Fig. 5.17 ― Infrastructure meshing ITILib operations ... 96
Fig. 5.18 ― Site meshingITILib operation ... 97
Fig. 5.19 ― ITI site without servers ... 99
Fig. 5.20 ― Site without subnet defined ... 100
Fig. 5.21 ― Isolated ITI site ... 101
Fig. 5.22 ― Isolated ITI server ... 101
Fig. 5.23 ―SiteHasAtLeastOneServer invariant definition ... 102
Fig. 5.24 ―SiteHasAtLeastOneSubnet invariant definition ... 102
Fig. 5.25 ―SiteLinkedToAtLeastAnotherSite invariant definition ... 103
Fig. 5.26 ―ServerConnectedToAtLeastAnotherServer invariant definition ... 103
Fig. 5.27 ― ITI for best practices analysis... 104
Fig. 5.28 ― Check best practices violations in ITI1 ... 104
xvii
Table of Tables
Table 1.1 ― Most common organization stakeholders ... 4
Table 1.2 ― Examples of ITIs complexity metrics ... 11
Table 2.1 ― Documents selected for analysis ... 28
Table 2.2 ― Classification of study 1 ... 29
Table 2.3 ― Classification of study 2 ... 30
Table 2.4 ― Classification of study 3 ... 30
Table 2.5 ― Classification of study 4 ... 31
Table 2.6 ― Classification of study 5 ... 32
Table 2.7 ― Classification of study 6 ... 33
Table 2.8 ― Classification of study 7 ... 33
Table 2.9 ― Classification of study 8 ... 34
Table 2.10 ― Comparative analysis of ITI evaluations ... 35
Table 3.1 ― Candidate ITIs modeling languages ... 45
Table 3.2 ― SDM core types ... 47
Table 3.3 ― Mapping between ITI objects and SDM abstractions ... 49
Table 3.4 ― Relationships of SDM ... 49
Table 3.5 ― Settings, flows and constraints in SDM ... 50
Table 3.6 ― Transformations on original object names to be compliant with OCL rules ... 51
Table 4.1 ― Categorization of our evaluation approach ... 70
Table 5.1 ― Coefficient of network complexity for ITI ... 86
Table 5.2 ― Cyclomatic complexity for ITI ... 87
Table 5.3 ― Required values for cyclomatic complexity calculation ... 88
Table 5.4 ― Cyclomatic complexity for all network topologies ... 88
Table 5.5 ― Required values for HKM calculation ... 90
Table 5.6 ― HKM for all network topologies ... 90
Table 5.7 ―FanIn and FanOut for each site using all network topologies ... 92
Table 5.8 ―FanIn and FanOut for each server using all network topologies ... 93
Table 5.9 ― Infrastructure topology factor complexity ... 93
Table 5.10 ―Intraserver_FanIn and Intraserver_FanOut for each site using all network topologies . 94 Table 5.11 ― Site topology factor for each site using all network topologies ... 95
Table 5.12 ― Infrastructure meshing factor for different network topologies ... 96
Table 5.13 ―Intrasite_connections for each site using all network topologies ... 98
Table 6.2 ― Variables used in this experiment, their scale types and description ... 107
Table 6.3 ― Testing Normal distribution with the Kolmogorov-Smirnov test ... 109
Table 6.4 ― Correlations among five explanatory variables ... 110
Table 6.5 ― Model fitting for CCM_Sites, ITF_Sites and IMF_Sites variables ... 113
Table 6.6 ― Likelihood ratio tests for CCM_Sites, ITF_Sites and IMF_Sites variables ... 114
Table 6.7 ― Pseudo-R Square for CCM_Sites, ITF_Sites and IMF_Sites variables ... 114
Table 6.8 ― Topology classification table using CCM_Sites, ITF_Sites and IMF_Sites variables ... 114
Table 6.9 ― Model fitting for ITF_Sites and IMF_Sites variables ... 115
Table 6.10 ― Likelihood ratio tests for ITF_Sites and IMF_Sites variables ... 115
Table 6.11 ― Pseudo-R Square for ITF_Sites and IMF_Sites variables ... 115
Table 6.12 ― Classification table for ITF_Sites and IMF_Sites variables ... 115
Table 6.13 ― Model fitting for ITF_Sites variable ... 116
Table 6.14 ― Likelihood Ratio Tests for ITF_Sites variable ... 116
Table 6.15 ― Pseudo-R Square for ITF_Sites variable ... 116
Table 6.16 ― Classification table for ITF_Sites variable ... 116
Table 6.17 ― Model fitting for IMF_Sites variable ... 117
Table 6.18 ― Likelihood Ratio Tests for IMF_Sites variable... 117
Table 6.19 ― Pseudo-R Square for IMF_Sites variable ... 117
Table 6.20 ― Classification table for IMF_Sites variable ... 118
Table 6.21 ― Parameter estimates ... 118
Table 6.22 ― ITI assessment to real cases ... 119
1
1
Introduction
Contents
1.1 Motivation ... 2
1.1.1 The importance of evaluating ITIs ... 3
1.1.2 Stakeholders interested in ITIs evaluation ... 4
1.2 Complexity ... 6
1.2.1 Complexity metrics ... 6
1.2.2 Comparing infrastructures complexity ... 7
1.2.3 Forecast of ITI complexity ... 7
1.3 Total cost of ownership ... 9
1.3.1 Reducing ITIs TCO... 10
1.3.2 The impact of ITIs complexity on TCO ... 10
1.4 IT Service Management... 13
1.4.1 ITIL ... 13
1.4.2 COBIT ... 14
1.5 Research objectives roadmap ... 16
1.5.1 Best practices roadmap ... 16
1.5.2 TCO forecast roadmap ... 18
1.6 Expected contributions ... 20
1.7 Document structure and typographical conventions ... 21
1.1
Motivation
Organizations of all kinds are dependent of Information Technology (IT) to such a degree that they cannot operate without them [Shackelford, et al., 2006]. As defined by the Information Technology Association of America (ITAA), IT is "the study, design, development, implementation, support or
management of computer-based information systems, particularly software applications and
computer hardware.” [ITAA, 2008].
The concept of Information Technology Infrastructures, referred in this dissertation as ITIs, is a wide concept that represents the use of the various components of information technology (computers, networks, hardware, middleware and software) upon which the systems and IT services are built and run to manage and process information [Sirkemaa, 2002].
In the last few years we have witnessed a tremendous change in ITIs and they became part of every organization. Twenty years ago it was normal to have all the business and mission critical applications running on a mainframe or a mini-computer. Ten years ago, these applications were distributed over two and three-tiered systems. Now, these applications are distributed over n-tiered systems and may have thousands of components than span multiple vendors and products, with high
dependencies, or some degree of relationship.
The primary purpose of the ITI is to support and enhance business processes and ITIs are the
foundation upon which the business processes that drive an organization’s success are based
[Gunasekaran, et al., 2005]. Based on this, aspects like reliability, security, usability, effectiveness and
efficiency are vital to every ITI. These infrastructures contain a complex mix of vendor hardware and software components that need to be integrated to ensure that they work well together and they distribute a variety of services both within and outside the organization, many of which are mission critical.
Historically, the biggest the infrastructure, the more difficult is to manage it, resulting in higher
costs and potentially higher Total Cost of Ownership (TCO) [Kirwin, et al., 2005]. There are several approaches developed to assess and evaluate the effectiveness of IT. However there is a lack of a reliable approach that organizations could use to understand how IT investments translate into measurable benefits [Hassan, et al., 1999].
To provide guidance and help organizations to create, operate and support ITIs and processes while ensuring that the investment in IT delivers the expected benefits, several frameworks have emerged (some of them are presented in section 1.4). These frameworks define a set of standard procedures and processes that organizations should adopt to improve efficiency and effectiveness [MSFT, 2008a, OGC, 2000]. These frameworks address the domain of IT management or the domain
Introduction
3Most organizations understand the value of implementing process improvement standards and
frameworks. That implementation became a worldwide trend, prompted by increasing interest and demand for greater levels of governance, audit and control [Cater-Steel, et al., 2006].
1.1.1
The importance of evaluating ITIs
IT represents one of the world’s fastest-changing industries and process changes at the business level can force major changes to infrastructures [Perry, et al., 2007]. There is more pressure than ever on IT to reduce IT costs while improving service to end users [Gillen, Perry, Dowling, et al., 2007]. According to analysts, most organizations consume 70% of IT budgets managing and supporting ITIs
[Weill, et al., 2002], instead of spending resources to add new business value and take the business further. As organizations grow, their ITIs grow along with them. But often that growth is uneven, driven as much by the conditions under which they operate, as by the model they aspire to.
Having the right infrastructure, at the right time, to support new business requirements is a challenging task, because most business initiatives emerge unpredictably [Pispa, et al., 2003]. Most
times new business requirements require considerable changes in infrastructures that must be implemented in the shortest possible time, to meet business deadlines. In some organizations this pressure leads to wrong infrastructures, increases complexity, decreases the effectiveness and efficiency resulting in an infrastructure more difficult to manage, new components without
integration with existing ones, waste of resources and delays, among other aspects.
This fusion between business and technology requires the expertise of both business and IT professionals that should support their decisions based on concrete information to better align business with infrastructures. Both should understand “what is the ITI currently?”, “what they want it
to be?” and turn what they have, into what they want in a disciplined way.
Having an ITI evaluation process can provide valuable information to business and IT professionals and is crucial to support their decisions regarding the growth of the infrastructures. Some examples of benefits of that evaluation are:
Defining and maintaining ITI operations and administrative policies; Check if best practices are being applied across the entire infrastructure; Understand better the impact of changes of ITIs in other systems; Simplify infrastructures management;
Evaluating emerging technologies and business potential or impact through complexity
analysis and evaluation;
Help defining an ITI strategy, planning, architecture and optimization to meet business goals
and objectives.
These evaluation aspects represent the first step to get control of ITIs. Without these evaluation is difficult to control and without control it is difficult to manage [Kirwin, 2003b]. All these benefits are quantifiable and are normally perceived as positive by internal and external stakeholders.
1.1.2
Stakeholders interested in ITIs evaluation
The word “stakeholder” of a given organization is currently used to refer to a person or another
organization that has an interest (or “stake”) in what the organization does. The stakeholder concept
can be applied to sponsors, customers, partners, employees, shareholders, owners, suppliers, directors, executives, governments, users, public, creditors and many more.
To define the role of the infrastructure to support the business and to ensure that the business is aligned with IT, it is important that IT organizations understand who its stakeholders are and ensure that they are involved in defining and reviewing IT quality and performance [OGC, 2002].
There are a number of inherent difficulties in the process of identifying key stakeholders and their needs, because they may be numerous, distributed and with different goals. The Table 1.1 summarizes some of the most common stakeholders, their job description and the “stake”.
Table 1.1 ― Most common organization stakeholders
Stakeholder Job Description Stake
Sponsors
Sponsors could be seen as business board
members and are individuals in leadership roles
that allocate resources like money, their own
time, energy, reputation, influence and the time
and energy of individuals in the groups they
manage.
Return of investment in terms of increased
organizational efficiency or effectiveness or
improved financial performance.
Customers
Customers are the people that pay for goods or
services and are recipients of the services
provided by the IT organization. ITI are there to
provide services and support to customers.
Commission, pay for and own IT services. They
agree to service levels and allocate funding. They
expect value for money and consistent delivery
against agreements.
Users
Users are the people that use services on a
day-to-day basis. They use IT services to support their
specific business activities. Users are also widely
characterized as the class of people that uses a
system without complete technical expertise
required to fully understand the system.
Invest energy in using the new procedures and
working practices and their expected payoff is an
enhanced relationship with the IT organization
and improved perception in service quality to
Introduction
5Stakeholder Job Description Stake
Employees /
Agents
The individuals and groups who are responsible
for facilitating the implementation of services in
ITI, which include IT professionals, trainers,
communication specialists, external consultants,
human resource professionals amongst others.
These individuals are asked to contribute
expertise, time and energy to the ITI.
Their stake in the process is typically the
expectation that their participation will lead to
personally important outcomes such as
recognition, learning.
Partners/
Suppliers/
Vendors
In some organizations, suppliers and vendors are
stakeholders. Their investment in ITI can range
from active participation in implementing new
systems in their own organizations to complying
with new procedures.
Their expected payoff is typically a stronger
relationship with the organization leading to
increased success for them.
To get the expected “stake”, sponsors know that the ITI must be “healthy” to support the
business requirements. Often ITIs are the main impediment to the new business challenges [Ganek, et al., 2007], so most enterprises spend a significant part of IT budgets on ITIs [Weill, 2007, Weill, et al., 2002]. Reducing costs while improving service levels and show quantifiable value from IT
investments represents a high priority for Chief Information Officers (CIOs) [Ernest, et al., 2007].
Evaluating ITIs is a process that can measure the “health” of infrastructures, so it is not only
important to all key sponsors, but also to help CIOs to achieve their top priority. Some benefits that sponsors can achieve with an ITI evaluation are:
Reduction of service outages – Most of the service outages in infrastructures are related
with people and the inexistence of processes or models that describes complex technical solutions;
Evaluation – Evaluate performance, processes and capabilities of the infrastructure help to
assure that day-to-day tasks are executed effectively and efficiently;
Simplification – Simplify the task of review and audit processes like asset management for
efficiency, effectiveness and compliance;
Increase efficiency and effectiveness – The efficiency and effectiveness of the systems
deployed, results in productivity gains and an increase in end users satisfaction;
Knowledge – Better knowledge of ITI which can help partners, suppliers and vendors, who
work as virtual members of the IT staff in providing hardware, software, networking, hosting and support services.
Knowing the complexity of an ITI trough an evaluation can help to design simpler and better
solutions, that are easier and faster to implement and represent a lower risk for the IT staff responsible for implementing solutions in an ITI.
1.2
Complexity
Complex ITIs are not easy to manage. In fact, organizations spend a significant part of their IT budget just to maintain ITIs [Ganek, et al., 2007]. North American and European organizations are expecting to increase 2008 IT budgets by 3%, which is the same percentage that they planned for 2007 [Bartels, 2008]. Currently CIO and IT professionals understand the importance of ITIs to the business and their
main concerns and priorities are the improvement of efficiency, the improvement of IT alignment with business and helping the business to cut costs and improve productivity [Bartels, 2008]. In order to achieve those gains, the ITIs complexity must be easily determined (static perspective) and kept under control (dynamic or evolutive perspective). In both cases we need to express that complexity quantitatively.
1.2.1
Complexity metrics
Depending on the field, there are numerous complexity metrics that can be used for the purpose of
evaluating complexity. In the field of ITI, complexity can be seen at several granularity levels, such as: global view where the whole infrastructure is a network of sites (e.g. a distributed
multinational’s intranet);
partial view where the local infrastructure of the site is a network of servers and
corresponding clients (e.g. an company branch in a given city).
In either case the problem of evaluating ITI complexity can be mapped to the one of evaluating
network complexity and finally a network can be mapped into a directed graph.
We have performed a survey of network and graph complexity evaluation approaches, which have been proposed by different research communities, since both network analysis and graph theory are used in a broad spectrum of applications. From this survey emerged three well known
complexity metrics that we will adapt, use and describe in more detail in section 5.3.2. The three well know complexity metrics are the Coefficient of Network Complexity (CNC) [Pascoe, 1966] which is a widely used metric for evaluating network complexity in the field of network analysis, Cyclomatic
Complexity Metric (CCM) [McCabe, 1976] proposed by Tom McCabe, which was one of the first
Introduction
7implementation of individual software modules and the Henry and Kafura Metric (HKM) [Henry, et
al., 1981] used to evaluate the complexity of software modules (nodes) of the so-called “call graph”,
(a directed graph representation of the call relationships among those modules).
In this dissertation we will use the previously described set of metrics, enriched with a few of our own, for illustrating the feasibility of our quantitative approach in the context of ITIs complexity evaluation.
1.2.2
Comparing infrastructures complexity
There is a direct relation between ITIs and business performance. Research found that robust ITIs are
a key driver of productivity and growth. The employees in organizations with better ITIs are more productive and the managers that are in organizations with better information systems, control significantly better their business [Iansiti, et al., 2006].
These conclusions create pressures on IT that can be hypothetical classified as “good” and “bad”
pressures. Pressures to add business value by increasing productivity, pressures to increase end-user
productivity or pressure to improve collaborations with customers are examples of “good” pressures. On the other side we have the “bad” pressures to reduce costs, improve security, keep business up
and running, among others that do not necessarily push the business ahead. According to analysts,
these “bad” pressures consume 70% of most IT budgets today [Bartels, 2008].
Analyzing the ITI evolution of infrastructure complexity within the organization and comparing infrastructure complexity with other similar organizations may be the first step to understand and control complexity. IT organizations that control complexity spend 15% less than their peers and operate with 36% fewer staffers [Iansiti, et al., 2006]. Through complexity analysis and comparison it will be easier to take decisions regarding IT investments to gain the most benefit and use efficient IT
resources.
To evaluate the ITI complexity and be able to compare it with others, a model based approach can be used to capture ITI knowledge which can include infrastructure topology, constraints, policies, processes, best practices amongst other aspects. This knowledge can then be used to plan, test,
model, deploy, operate, monitor, troubleshoot or enforce policies in ITIs.
1.2.3
Forecast of ITI complexity
The IT provides many benefits and the complexity in IT systems and in particular in ITIs must be seen
changes, dealing with heterogeneous environments and solving problems are just some of the
challenges that IT professionals face on a day to day basis. Because complexity is a characteristic of ITIs, it will not disappear and IT professionals must have tools and processes that they can use to deal with IT more effectively and use the strengths of ITIs to drive more strategic value.
Fig. 1.1 ― IT Ecosystem Is Complex (source:[Symons, et al., 2008])
To align IT with the goals of the business and to enable ITIs to function as a strategic asset to the business, complexity should be evaluated, controlled and managed. This control over complexity can help IT to move from a complex environment to a more efficient environment through actions like elimination of unnecessary redundant systems, reducing manual tasks, and more efficient use of
resources, among other actions. The evaluation of ITIs and, in particular, the evaluation of the complexity can help IT professionals to deal with complexity in a productive way and help them to identify those actions.
Without control, the complexity of ITIs tends to increase due to reasons like globalization, regulations, mergers and acquisitions, systems growth and integration, security, continuous
availability or business continuity among other factors. The control of complexity will enable organizations to forecast infrastructure complexity while addressing all these aspects. To be able to address new business needs and predicting infrastructure complexity, organizations, should measure their agility with focus on ITIs and then making the required IT investments [Plummer, 2005]. Agility is the ability of ITIs to adapt to business condition. Agility is typically expressed by the required time
to implement a new capability or to achieve an IT goal such as increase the IT capacity by 15 percent,
Introduction
9deploy new features or to increase the IT capacity to support a new business application [Mertins, et
al., 2008, MSFT, 2007].
1.3
Total cost of ownership
The TCO was popularized by Gartner more than 20 years ago, with the goal of clearly and reasonably address the real costs attributed to owning and managing ITIs. Currently TCO is still one of the most important concerns of IT managers [Kirwin, 2003b]. TCO identifies costs as being made of two main groups, the direct costs and the indirect costs (aka soft costs [Kirwin, 2003a] because they often occur outside the budget).
The direct costs are normally the capital, fees and labor costs. Indirect costs are more difficult to measure and include the costs associated with training IT professionals and users, costs associated with failure or outage (planned and unplanned), development and testing, costs associated with distributed computing, datacenters, storage and telecommunications, electricity and much more [Gartner, 2003].
The nature of indirect costs leads some organizations to underestimate their impact on ITIs. However TCO analysis often shows that the acquisition or purchase price of an asset represents only a small fraction of its total cost and indirect costs can typically represent as much as 60% of the total cost of managing and owning an ITI [Kirwin, et al., 2005].
The TCO allows the alignment of IT operational efficiency goals with business performance requirements [Kirwin, 2003a] and should not be used with the purpose of justifying IT investments, validate initiatives or increase or decrease ITIs spending. There are some frequent misunderstandings that TCO is only a way of cutting costs or that the IT platform with the lowest TCO is the best choice and indirect costs do not count [Kirwin, 2003a].
The TCO has proven to be a vital and popular framework for IT and business management decision-making and has been applied to several different technology areas. The idea of using TCO as a way to gauge IT performance is still taking shape [Kirwin, 2003b]. TCO may be used as a proxy for activity-based costing, a technique in which all costs associated with a specific IT function are
measured and compared to industry averages. This comparison is sometimes more efficient than looking at IT costs at the macro level. For instance, a TCO analysis of the costs associated with managing Enterprise Resource Planning (ERP) applications could reveal cost disparities that would not show up if a company only considered its overall IT costs [Kirwin, 2003b].
In the field of ITIs, there has been an increasing interest in recent years in calculating the costs of
replace their ITIs [MacCormack, 2003]. Understanding and evaluating the TCO of ITIs is a prerequisite
in pursuing initiatives in ITIs [Blowers, 2006a].
1.3.1
Reducing ITIs TCO
To reduce the TCO associated with a particular infrastructure it is important, first to have a process that can analyze all the distinct aspects that an ITI is built of and calculate the real total cost of ownership. Organizations are dependent of ITIs to provide business functionality and it is essential that they understand and manage their costs [Kirwin, 2003a]. Only knowing the TCO, can help IT decision makers to focus on ITI problems and develop ways to align costs, performance and service
levels with the organizational requirements, while delivering a high service quality. High service quality normally leads to a decrease in IT budgets for managing and supporting infrastructures which reduces the ITIs TCO.
There are several approaches that can be taken to reduce the TCO associated with a particular infrastructure [Aziz, et al., 2003, Conley, et al., 2007, Engels, 2006]. However, because organizations
also need to preserve functionality, they need to balance between TCO and the right agility of the ITI. So, in order to reduce the TCO of an ITI, it is very important to manage the tradeoff between TCO and agility.
Complexity, by definition refers, to the condition of being difficult to analyze, understand or solve.
According to [Kirwin, et al., 2005] there is a direct relationship between complexity and TCO and the more complex the IT and business are, the higher the TCO is. Complexity is acceptable if the complexity purpose is to achieve business value but unacceptable otherwise. Therefore, organizations should aim for the minimum level of complexity required to meet their business needs. In the following section, we evaluate the impact of ITIs complexity on TCO.
1.3.2
The impact of ITIs complexity on TCO
The ITI complexity is normally divided into the complexity associated with the software and
complexity associated with the hardware. The complexity of any system has several drivers of which the most important are (i) size, (ii) the diversity and (iii) the mutation of its parts and of their interconnections. Often we have to drill down complexity analysis since each point of a system may itself be considered a (sub) system. We stop drilling down when a part can be considered as a
Introduction
11An ITI is a special kind of a system. Its parts are software and hardware components. Software
components range from applications down to firmware (embedded software). However, components can be computer devices (e.g. desktop, handled or mobile devices), servers, switching and communication equipment (e.g. hubs, routers, access points, repeaters) and other devices (e.g. printers, plotters, scanners).
While the size driver of ITI complexity is self-explanatory, it may not be so obvious for the
diversity driver. The diversity driver of ITI components can manifest itself in different installation operations and maintenance procedures.
Consider for instance two ITIs, with the same number of servers, equipment and topology. The complexity of those two ITIs, will be much different if in one case there is no technology diversity and
on the other case each component requires specific customization or operation. Just imagine that you have 10 different printers each requiring a different kind of maintenance intervention.
The mutation driver of ITI complexity has to do with its modifications throughout time. The observation period may vary depending on the characteristic being observed. For instance, while for
a percentage of PCs replaced on a yearly basis would make sense, we may need to observe the maximum number of transactions per hour for balancing online versus offline services. Table 1.2 present examples of complexity drivers for hardware and software.
Table 1.2 ― Examples of ITIs complexity metrics
Hardware Software
Components Interconnection Components Interconnection
Size Number of servers;
Number of hubs;
Number of routers;
Number of printers.
Number of physical links;
Number of logical links.
Application installations;
Operating systems
installations.
Number of dependencies
on other software
components;
Number of configuration
scripts required to allow
software interoperability.
Diversity Different end-user
plat-forms (desktops, handled, mobile devices); Different server technologies; Different printer products. Different link
technologies (e.g. UTP,
fiber optic, wireless,
Bluetooth);
Redundant
communication links
between 2 nodes.
Different applications
installed;
Different operating
systems installed.
Different types of
dependencies among
software components.
Different configuration
scripts required to allow
software interoperability
Mutation Yearly rotation of
desktops.
Hardware automatic
reconfiguration to
provide fault tolerance.
Application releases per
year; Operating system
updates per year.
Components to provide
Fig. 1.2, shows an estimative chart generated with a proprietary software tool (Gartner TCO
Manager) of a 2.500 end-users environment where we can see the huge impact of the various complexity levels on cost. In this specific scenario the TCO per end-user doubles when maximum complexity is reached.
Fig. 1.2 ― TCO per end user at various complexity levels (source: [Kirwin, et al., 2005])
It is very important to have a relation between the complexity and the business value and the point when the complexity exceeds the business value. Beyond that point we cannot manage the
infrastructure effectively [Harris, 2005]. There is a misperception that investing on IT creates value with no limits. However, when we reach our capacity to manage the infrastructure (inflection point) the value is negative. Fig. 1.3 shows the perceived relationship between value and complexity against the real relationship, where we can see that investing in IT only brings value until the inflection point
is reached.
Fig. 1.3 ― Complexity and the value of IT (source: [Harris, 2005])
Introduction
131.4
IT Service Management
IT service management (ITSM) is a discipline for managing IT systems, philosophically centered on the customer's perspective of IT's contribution to the business. ITSM focuses upon providing a framework to structure IT-related activities and the interactions of IT technical personnel with business customers and users.
This dissertation proposes an ITI evaluation approach that can be used by organizations for different aspects such as the ones mentioned in the motivation section. Most of these aspects are also covered by some ITSM frameworks [Brenner, et al., 2006]. There are a variety of frameworks and authors contributing to the overall ITSM discipline. In this section we will briefly describe two of the most widely adopted frameworks: IT Infrastructure Library (ITIL) [OGC, 2000] and Common
Objectives for Information and related Technology (COBIT) [ISACA, 2008b].
1.4.1
ITIL
The IT Infrastructure Library commonly referred as ITIL is one of the most widely adopted frameworks [Cater-Steel, et al., 2006], is a structured repository of best practices developed in the late 1980s by the Central Computer and Telecommunications Agency (CCTA) of the British Government and currently administered and updated regularly by the British Office of Government
Commerce (OCG). The ITIL deployment is supported by the work of the IT Service Management
Forum (itSMF) [Bon, 2004]. The itSMF is global, independent non-profit organization with more than
100.000 members worldwide and present in several countries, including Portugal [itSMF, 2008], with the mission of development and promotion of IT Service Management "best practices", standards and qualifications.
The ITIL, currently in version 3, outlines an extensive set of management procedures that are intended to support businesses in achieving both quality and value for money in IT operations. These procedures are supplier independent and have been developed to provide guidance across the breadth of ITI, development and operations.
ITIL version 3 consists of a series of books ( [OGC, 2007d, OGC, 2007c, OGC, 2007e, OGC, 2007a,
Fig. 1.4 ― End-to-end ITIL process (source:[Watt, 2005])
There are other frameworks and guidelines based on the ITIL framework. These have been
developed by software and hardware organizations such as the HP's Service Management Framework [HP, 2007] which is based on ITIL v3 and replaces the HP ITSM, IBM's Process Reference
Model for IT (PRM-IT) [Ernest, et al., 2007, IBM, 2007] which in version 3 is fully aligned with ITIL v3
and Microsoft, with their Microsoft Operations Framework 4 (MOF), which in version 4.0 is also aligned with ITIL v3 [MSFT, 2008a].
1.4.2
COBIT
Common Objectives for Information and related Technology commonly referred as COBIT is currently
in version 4.1 [ISACA, 2008b] and is another industry framework of good practices for IT produced by
Information Systems Audit and Control (ISACA) [ISACA, 2008c] and managed by the IT Governance
Institute (ITGI) [ITGI, 2008b]. COBIT framework allows managers to bridge the gap between control
requirements, technical issues and business risks, enables clear policy development and good
practice for IT control throughout organizations, emphasizes regulatory compliance and helps organizations to increase the value attained from IT. The COBIT framework is organized into four domains: plan and organize, acquire and implement, deliver and support, monitor and evaluate
Introduction
15Fig. 1.5 ― COBIT framework domains (source:[Symons, et al., 2006])
The plan and organize domain covers strategy and tactics in terms of, how IT can help the
organization to achieve the business objectives. The acquire and implement domain addresses the organization's strategy in identifying developing or acquiring IT solutions as well as implement and integrate them within the organization's current business processes. The deliver and support domain focuses on the delivery of required services, which includes service delivery, management of security and continuity, service support for users, and management of data and operational facilities. The
monitor and evaluate domain deals with the organization's strategy in assessing their quality and
compliance with control requirements. This domain addresses aspects such as the performance management, monitoring of internal control, regulatory compliance and governance among others. Across these four domains, COBIT has identified 34 IT processes accompanied by high-level and
detailed control objectives, management guidelines and maturity models [Haes, et al., 2005].
Regarding orientation, definition, classes of problems addressed and implementation, the COBIT and ITIL are very different, however there are some similarities between them and they are more complementary than competitive and there is a mapping comparing the components of COBIT 4.1 with ITIL version 3 [ITGI, 2008a]. Used together, they provide a top-to-bottom approach to IT
1.5
Research objectives roadmap
It is important to outline our long-term research objectives, since the proposals made in this dissertation are intermediate steps on the roadmap for achieving them. Those long term research objectives are then the following:
Propose a best practices enforcement framework – we expect it to be helpful for ITI
designers and managers;
Propose a TCO estimation method based upon given evolution scenarios – in other words,
we want to be able to forecast TCO evolution.
1.5.1
Best practices roadmap
As for the strategy to achieve those objectives, it will next be described by means of roadmaps, one for each long term objective. In those roadmaps, the activities with a white background represent those that were developed in the scope of this dissertation, while those with a grey background represent the ones that will be developed in future work, probably in the scope of a PhD research work.
In this dissertation we propose a model-based technique to classify ITI topologies automatically. This classification is based on a set of ITI complexity metrics that are formalized using a constraint language. We collect the values of those metrics for a set of different ITIs and then use them to prove the feasibility of the automatic topology classification technique ("AS IS (1)" state in Fig. 1.6).
Introduction
17Fig. 1.6 ― Roadmap (best practices)
We believe that the formalization of best practices should be targeted for specific ITI topologies. A well-formedness rule suitable for one topology may not be applicable to other topologies. Therefore, we plan to specialize best practices per topology. We will then use the automatic topology classifier
to select the most appropriate rules to verify for a given ITI, in order to improve our proposed technique for detecting ITI best practices violation. We plan to test this improved version upon the previously mentioned sample of ITIs structural data, thus proving the feasibility of our proposed framework for best practices enforcement ("TO BE" state in Fig. 1.6).
Model ITIs structure
Classify ITI Topologies
Formalize ITI best practices
Enforce best practices adoption
Refine ITI best practices formalization Detect ITI best
practices violation
Refine ITI topology classification
Formalize ITI complexity metrics
Build structural data sample
Collect complexity metrics
\
AS IS (2)
AS IS (1)
TO BE
Best Practices Roadmap
1.5.2
TCO forecast roadmap
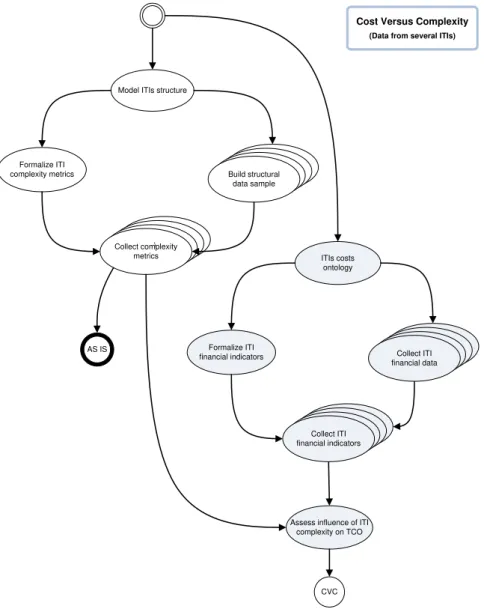
To forecast the TCO we first need to identify which are its driving forces. One of our claims is that the complexity of an ITI is one of them. Our strategy to validate this claim is to perform an analysis of variance in TCO due to ITI complexity. For that purpose we will use the sample of complexity metrics mentioned in the previous section as independent variable descriptors and a sample of ITI financial
indicators (taken from the same ITIs as the ones from where the complexity metrics were collected) to compose a TCO descriptor (dependent variable). For the sake of clarity and replicability, those financial indicators will be formalized upon an ITI costs ontology. The expected outcome of this partial roadmap, represented by CVC (Cost Versus Complexity) in Fig. 1.7 is the statistical evidence that ITI complexity influences TCO and the quantification of that influence (e.g. percentage of the
variation in TCO that is explained by the variation in ITI complexity).
Fig. 1.7 ― Roadmap (cost versus complexity)
Model ITIs structure
Formalize ITI complexity metrics
Assess influence of ITI complexity on TCO
ITIs costs ontology
Formalize ITI financial indicators
Build structural data sample
Collect complexity metrics
\
Collect ITI financial indicators
Collect ITI financial data AS IS
CVC
Introduction
19The second part of this roadmap is represented in Fig. 1.8 and takes the CVC conclusions as input.
To forecast TCO for a specific ITI we will combine a time series of the evolution of its complexity with another time series of its previously known TCOs. The latter are calculated on the basis of a set of financial indicators, using the same approach as that described in the previous paragraph, but for one ITI only, throughout time.
In the scope of this dissertation we have performed a study of the evolution of ITI complexity ("AS
IS state" in Fig. 1.8). This intermediate step is in our view an interesting step forward, since TCO evolution will be influenced by ITI complexity evolution. Besides, this study has allowed us to experiment with the time series techniques that will be later required to achieve our research objective of proposing a TCO estimation method.
Fig. 1.8 ― Roadmap (best practices)
Model ITIs structure
Formalize ITI complexity metrics
Build ITI historical financial data sample
Collect ITI financial indicators time series
ITIs costs ontology
Formalize ITI financial indicators Collect ITI
structural metrics time series
Build ITI historical structural
data sample
Forecast ITI TCO evolution Assess influence of ITI
complexity on TCO
TO BE Analysis of ITI
structure evolution
AS IS
CVC
Forecast TCO
1.6
Expected contributions
As we have seen in the previous sections evaluating ITIs is a very important concern and challenge. This dissertation is a step towards the development of a formal approach based on metamodels to evaluate ITIs. The main motivation of this work is the need to evaluate different aspects of large distributed ITIs, in order to help and support decisions of IT decision makers.
There are currently a set of commercial initiatives, processes and tools developed by IT organizations that allow the evaluation of some aspects of ITIs. However none of them supports a consistent and formal approach to evaluate these infrastructures in a quantitative way. In this dissertation we will propose an ITI evaluation methodology that can automatically capture data from a particular infrastructure and represent it upon a given metamodel. Using this approach can lead to
the following benefits:
Represents and increase the knowledge on ITI organization – increasing knowledge can
foster the productivity of IT professionals and support and lead to better decisions regarding operation, maintenance and evolution of ITIs;
Metrics to measure complexity – knowing the complexity normally reduces server
proliferation which often contributes significantly to the complexity and cost of ITIs;
Allows comparisons of ITIs over time – analyzing the chronological growth of ITIs allows a
better understanding of the impact of policies or strategies adopted in the past and the forecast of ITIs evolution and to answer questions such what factors contribute to control the unstructured growth of the ITIs;
Allows comparisons of ITIs of different organizations – the comparison process can be
useful in an acquisition or merger process between organizations;
Check if the ITI follows organization best practices – The implementation of a process that
checks if best practices are being followed, can be useful for several reasons, such as the detection of human errors that could lead to problems such as server or network downtime. The implementation of best practices and the detection of non-compliances, can increase
servers and network availability, increase staff efficiencies and check policies enforcement, for compliance with regulatory standards such as HIPAA (Health Insurance Portability and
Accountability Act), Sarbanes-Oxley (SOX), among others;
Identify potential problems in the ITI – identifying problems before they happen helps to
prevent critical situations.
We propose a precise and flexible solution framework, based on metamodels, which can be used
Introduction
21and evolution of ITIs. The proposed approach is based on metamodels, and defines how we can
capture ITIs objects and their settings, and instantiate them on models. With the ITI information available on models, we present an approach that can be used to extract the required information from the ITI, facilitating the task of understanding the various components of the ITI and how they are related.
We have formalized the definition of several complexity metrics and successfully collected them
from large real world ITIs. Those metrics can be used in calculating and estimating several ITI aspects such as their size, their complexity, their evolution, or used in combination with other indicators to calculate the TCO.
This approach contributes to productivity gains, through the possibility of running queries against
ITIs. We also provide an approach, where organizations can write their own best practices, in order to help them to detect infrastructural non-compliance configurations. In summary, we expect that with an approach to quantitative evaluate ITIs we can increase the efficiency and effectiveness of ITIs, reducing costs, simplifying day to day management activities and making ITIs more robust and
more agile.
1.7
Document structure and typographical conventions
To facilitate and simplify the reading of this document, the structure is organized in eight chapters,
each with a context. The content of each chapter is as follows:
Chapter 2 describes related work relevant to the understanding and evaluation of distributed ITIs. For that purpose this chapter presents taxonomy, and a survey built of eight documents related with evaluation studies and evaluates these eight documents using the created taxonomy. Finally this chapter presents a comparative analysis of these evaluations and presents some findings.
Chapter 3 introduces the Meta-Model Driven Measurement approach, presents several modeling languages and performs a comparative review of three different ITIs modeling languages. The remaining of the chapter is dedicated to the selection of a modeling language to work throughout
this dissertation and to present several considerations regarding the chosen modeling language.
Chapter 4 describes how the chosen modeling language will be applied using the M2DM approach and introduces important concepts such as metamodel semantics enforcement and the ITILib. The last section of this chapter is dedicated to a step-by-step description of every component of our
Chapter 5 applies the approach described in chapter 4 to evaluate different perspectives of an ITI. There is a section dedicated to the evaluation from a sizing perspective with a real case study, another section dedicated to the evaluation of complexity with five different case studies and a last section dedicated to the application of best practices to ITIs. There is also a formalization of rules for best practices compliance verification with the OCL constraint language.
Chapter 6 is dedicated to the detection of network topologies based upon logistic regression techniques. In this chapter with the help of the multinomial logistic regression we created a model that can be used to detect the network topology ITIs. To ilustrate this in the last section
presents we applied the created model to ten real ITIs collected from different organizations that were slightly modified to guarantee the confidentiality of the data.
Chapter 7 presents the conclusions and the future work. It starts by summarizing the contributions of this dissertation, present some threads to their validity and outlines several directions for future research work.
To clearly distinguish semantically different elements and provide a visual hint to the reader, this dissertation uses the following typographical conventions:
Italic script highlights important key words, scientific terms, methods and tools carrying
23
2
Related Work
Contents
2.1 Taxonomy for supporting the survey ... 24 2.1.1 Complexity evaluation ... 24 2.1.2 Evolution analysis ... 24 2.1.3 Best practices assessment ... 25 2.1.4 ITI modeling ... 25 2.1.5 ITI characterization ... 26 2.1.6 Data collection ... 26 2.1.7 Sample ... 26 2.1.8 Results validation ... 27 2.2 Survey ... 27 2.2.1 Evaluation 1 – [Juurakko, 2004] ... 28 2.2.2 Evaluation 2 – [DiDio, 2004b, DiDio, 2004a] ... 29 2.2.3 Evaluation 3 – [Cybersource, et al., 2004] ... 30 2.2.4 Evaluation 4 – [Wang, et al., 2005] ... 31 2.2.5 Evaluation 5 – [CIOview, 2005] ... 31 2.2.6 Evaluation 6 – [Wipro, et al., 2007] ... 32 2.2.7 Evaluation 7 – [Jutras, 2007] ... 33 2.2.8 Evaluation 8 – [Troni, et al., 2007] ... 33 2.3 Comparative analysis ... 34
![Fig. 1.2 ― TCO per end user at various complexity levels (source: [Kirwin, et al., 2005])](https://thumb-eu.123doks.com/thumbv2/123dok_br/16516912.735261/30.892.146.709.758.1036/fig-tco-user-various-complexity-levels-source-kirwin.webp)
![Fig. 1.4 ― End-to-end ITIL process (source:[Watt, 2005])](https://thumb-eu.123doks.com/thumbv2/123dok_br/16516912.735261/32.892.166.691.120.479/fig-end-end-itil-process-source-watt.webp)
![Fig. 1.5 ― COBIT framework domains (source:[Symons, et al., 2006])](https://thumb-eu.123doks.com/thumbv2/123dok_br/16516912.735261/33.892.259.678.125.397/fig-cobit-framework-domains-source-symons-al.webp)