http://dx.doi.org/10.1590/0104-530X1143-13
Resumo: As transformações no setor e mercado de energia elétrica somadas à grande quantidade de fatores de
inluência implicam alterações nos produtos deste mercado. Em uma empresa do setor, sabe-se que há um custo de desenvolvimento destas alterações, mas não quanto tem sido gasto e as principais causas. Este estudo possui caráter exploratório e visa levantar as alterações de produto, identiicar seus motivadores e relacioná-los aos custos destas alterações. Pretende-se identiicar pontos críticos de melhorias no PDP da empresa. Feita uma revisão bibliográica de assuntos relacionados ao tema, constatou-se que não há trabalhos similares. Também foram identiicados procedimentos da empresa, consultados documentos, custos e identiicados os motivadores destas alterações. Porém, os resultados não permitiram relacionar os motivadores aos custos das modiicações, porque o registro de alterações está fragmentado. Contudo, revelam que os procedimentos da empresa permitem rastrear os custos de apenas 8% das alterações executadas e que este percentual levantado representa 12% do custo despendido no desenvolvimento do produto analisado. Montante alarmante, uma vez que este número tende a ser maior. Embora inicialmente acreditar-se que os motivadores teriam grande inluência na reestruturação do PDP da empresa, viu-se que é pertinente a adaptação do procedimento de registro e de custos das alterações.
Palavras-chave: PDP; GDP; Medição de desempenho; Alteração de projeto.
Abstract: The transformations in the power sector and in its market coupled with their inluence-exerting factors will bring changes to the products of that market. In a company of this sector, the cost to proceed with those changes is well known, but not the amount spent and their causes. This is an exploratory research which aims to collect data on product change, identify its drivers, and relate them to the cost of these changes. The study objective is to spot the critical points which need to be improved in the company’s PDP. A bibliographic review on the theme showed no similar works. Also, the company’s procedures were identiied, its costs and documents were recognized, and the drivers of these changes were veriied. However, the results obtained did not allow us to match the drivers to the changes in costs because the change registrations are fragmented. Nevertheless, the results show that the company’s procedures allows for the tracking of only 8% of the changes conducted. They also show that the reached percentage represents only 12% of the cost spent on the development of the product analyzed. That is an alarming sum, since this number tends to grow. Although, at irst, it was believed that the drivers would exert great inluence on the restructuring of the company’s PDP, it was possible to verify the relevance of adapting the procedures of registration and cost changes.
Keywords: PDP; PDM; Performance assessment; Project change.
Identifying product change drivers and their financial
impact on PDP performance: a study conducted in a
power meter assembling company
Identificação dos motivadores de alterações de produto e seus impactos financeiros no desempenho do PDP: um estudo em uma empresa montadora de medidores de energia elétrica
Raphael Fiedler1
Josmael Roberto Kampa2
1 Universidade Tecnológica Federal do Paraná – UTFPR, Av. Sete de Setembro, 3165, Rebouças, CEP 80230-901, Curitiba, PR, Brazil,
e-mail: [email protected]
2 Grupo de Investigação em Desenvolvimento e Manufatura de Produtos – GIDEM, Laboratório de Desenvolvimento de Soluções e
Produto – LEGIO, Universidade Tecnológica Federal do Paraná – UTFPR, Curitiba, PR, Brazil, e-mail: [email protected] Received Dec. 6, 2013 - Accepted Oct. 7, 2015
1 Introduction
In 2001, Brazilian population was forced to change their power consumption habits due to the risk of power outage. According to Secco (2001), the low diversiication of all power resources available was one of the causes; 97% of the consumed power was generated by hydro power plants. Another reason laid in the reduction of the investment in infrastructure, which was about 20 billion a year and at that moment slumped to half of that value. In addition to that, the privatization of the power sector companies also inluenced in the reduction of investments because of the tariff restriction imposed by the government. According to a report made by the Court of Audit of the Union – TC 006.734/2003-9 (Brasil, 2009) published on the 15th of July, 2009, “the blackout”, as it was named afterwards, yielded a direct cost of R$ 45.2 billion. The value was passed on to the power public utilities of which 60% was paid by end users through tariff funding. The rest was paid by the National Treasury encumbering taxpayers.
It is known to all that those events initiated changes throughout the power sector: generation, transmission and distribution. New laws were approved, the sector norms and regulations were revised as well as the government programs, all in attempt of achieving energy eficiency. The facts above plus the infrastructure enlargement and the increase of competition have fostered the development of new products with new technologies and functionalities, in addition to the constant readjusting of the system elements as, for example, power meters.
The power sector and market are regulated and controlled by government agencies, metrological organs and norm-setting organizations. They are responsible to assign responsibilities and to set tariffs, determine manufacturing features and functionalities, and check product conformity to the legal norms and obligations. They can also validate or not sale process. Among those organizations, we could list the following as the most relevant: The National Electrical Energy Agency (ANEEL), The National Institute of Metrology, Quality and Technology (Inmetro) and the Brazilian Association of Technical Norms (ABNT).
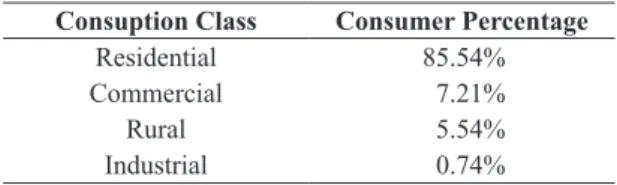
In addition to those inluential groups we can also notice a great segmentation of the consuming market. According to ABRADEE, in 2014, Brazil had approximately 77 million power meters which, in accordance with the Normative Resolution nº 414, published by ANEEL on September 9th, 2010 (ANEEL, 2010), were divided in 8 consumption categories. On Table 1, you can see the main consumption classes and the consumer percentage in each one.
As you can see, the residential class represents 85.54% of the power meters, which is the amount currently disputed by manufacturers of this type of product.
Nevertheless, to enable power consumption, there must be companies to supply it. The decree-law number 41.019 dated from 26th, February 1957 (ANEEL, 1957) and the Normative Resolution number 414, published by ANEEL on September 9th, 2010 (ANEEL, 2010) deine the rights and obligations of the power supply companies. They are the owners of the power meters and have the obligation to provide their installation, through service concession, when requested by consumers (houses, stores, industries, etc…) the latter also have their rights and obligations deined by those legal determinations.
According to ABRADEE – Brazilian Association of Power Supply Companies (ABRADEE, 2014a, b), there are 42 private and state owned power supply companies. Each of them presents different needs and features and work in all regions of the country being responsible in the country for 98% of the power supply. We can, thus, afirm that one of the focal points for those different players’ demands should lie in the kinds of meters used.
The main functions of a power meter are to measure and register the power consumption. It is, in fact, one of the ends of the complex chain in the sectors of power generation, transmission and supply, which has been boosted by those changes. It plays a chief role in the power-supply management. From Barbieri’s study (Barbieri, 2006), and from what has been shown in the paragraphs above, we could infer that the link between the power supply companies and the end consumers is set through meter usage.
At irst glance, one imagines power meters as regulated durable goods with a long life cycle and wearing out after a long time (a low replacement need). However, as shown before, it is a product that has been undergoing a great technological transformation. New requirements and the need for management improvement have demanded renovation and the consequent replacement of electromechanical meters by the electronic ones. That will enable the power supply companies to reduce losses (frauds) and will permit the government to estimate entire country’s consumption more eficiently. That will permit a better assessment and forecast of the investment in the sector.
As it was seen previously, it is possible to notice a great deal of factors exerting inluence in the development of solutions to the eletricity meter
Table 1. Consumption class and consumer percentage.
Consuption Class Consumer Percentage
Residential 85.54%
Commercial 7.21%
Rural 5.54%
Industrial 0.74%
market. It is necessary to adjust the different forms of demand in a competitive way, to deploy low-cost structures, and to keep a standard product-portfolio management which, in turn, will have to meet the needs of a market that presents a variety of requests and requirements. The companies aiming at working in this market will have to demand a differentiated product-development process and to conform it in this mass-customization environment is a challenge that will require deeper research.
1.1 Opportunity and objective of research
The object of the study is a multinational company inserted in the scenario shown above. It is an power-meter assembling company located in the south of Brazil. It also has a strong matrix structure and works with a stage-gate PDP (Product Development Process).
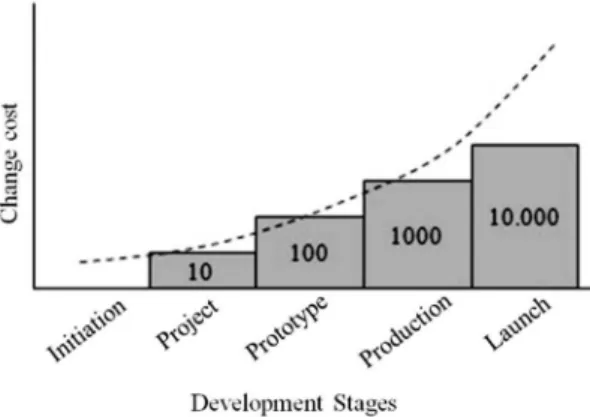
We can notice a signiicant number of cyclical changes in the project occurring in all phases of the product life cycle. According to Back & Forcellini (2002), the cost to change a product project throughout its development stages increases in a progressive way. Also in accordance with PMI - Project Management Institute (PMI, 2008), change costs and error corrections increase signiicantly as the project reaches its end. In Figure 1, it is shown the cost change throughout the project-development stages.
As you can see in Figure 1, the change costs in each development stage grow in geometric progression at the rate of 10. That illustrates how burdensome the cost can be as the development stages advance.
In case of the studied company at present, it has not been able to assert how much it has been spent on product change and what its main causes are. However, due to the change scenario already known by the project team, it is possible to know there is a cost for the change development.
Rozenfeld et al. (2006) afirms that, just like any other business process, product development should be monitored by performance indicators. It is clear
that the number of project changes is an important indicator which is related to a number of inancial indicators.
New PDP-based company projects can result in similar errors, if those changes are not monitored so that they induce changes in the company PDP. Cyclic changes in the project refer to a company PDP problem guiding its projects. However, we are aware that the PDP changes should be carried out with accuracy in order to mature the product development process. Ergo, it is extremely important to identify the correct causes so that they can act in the changes highly impacting in the PDP performance of future process-improvement projects. Therefore, to know the biggest and most impacting change drivers can, in fact, help guide the PDP process improvement in the studied company.
Thus, the main goal of the current paper is to create an overview of the main product-change drivers and their cost based on the last 5 year life cycle of an power meter after the project phase closure.
The choice of the topic was done based on the need for company PDP improvement. Also, it brings into a focus on the real situation of the industry sector which has been scarcely studied despite its great importance for the country. It also helps other sectors to investigate the costs generated after product development with the aim of seeking a continuous PDP improvement by means of collecting similar data and the creation of PDP performance indicators.
2 Methodological procedure
The current research seeks to identify and classify the product change drivers through the cost of those changes; hence, it has an exploratory feature. Due to company restrictions, the procedures developed ad hoc made use of data collected from a 5 year life cycle poly-phase residential meter. The current project describes quite well the company PDP and the issue discussed above, all in accordance of the information provided by the company workers.
The work starts with the exploratory research through data collection of the articles in the periodic journals of CAPES – Coordination for the Improvement of Higher Education Personnel and of the Scientiic Electronic Library Online. Also, books and inal dissertations were consulted in the library of UTFPR – Federal Technological University of Paraná. In addition to that, direct search was conducted through generic interment search engines. Thus, it was possible to seek the scientiic foundation of the following topics:
a) Product Development Process (PDP); b) PDP Management;
c) PDP Performance Assessment; d) Project Changes.
Figure 1. Change cost in the development stages. Source:
Once the scientiic foundation was concluded, the study was then divided into 6 stages:
a) After selecting the product, identify the start and the end of the project life cycle;
b) Identify the product change processes set up by the company in order to understand how those changes work and which means and places are used to register them;
c) Find and list the changes occurred in the last 5 year of product life cycle. The following criteria will be taken into consideration in the data-collection process:
i. Only consider the changes that occurred after the product development phase, which was concluded on September 30th, 2007; ii. Only consider the changes that brought on
physical and/or functional alterations to the product;
iii. Group the documents related to product changes.
d) Calculate the internal costs and the investment generated for each product change process; e) Identify and list the drivers (causes) of product
change by means of consulting the technical documentation of the company;
f) Match the product change drivers to the cost of those changes;
g) Analyze and discuss the results obtained.
3 PDP and product changes
3.1 Product development process
According to Rozenfeld et al. (2006), product development comprises a set of activities through which, it is aimed to attain the speciications of a product and its production process, so that the plant is able to produce it. That can be achieved by taking into consideration the market needs, the technological restrictions and possibilities, and by respecting the product and competition strategies of the company. PDP is the interface between the company and the market being responsible to identify and anticipate the needs and propose solutions to them. That is the reason why it is so important strategically (Rozenfeld et al., 2006).
It is therefore concluded that the product development process is not solely an engineering activity. It involves several areas of knowledge inside and outside the
company. That fact requires the companies to seek a coordinated management and the integration of those areas throughout the product and project life cycle.
In accordance to Cunha (2008), throughout history, evolution has occurred and the arise of several approaches towards product-development management. Today it is possible to ind in literature, a wide range of authors suggesting the most diversiied approaches to work with PDP (Back et al., 2008; Baxter, 2003; Boothroyd et al., 1994; Pahl et al., 2005; Rozenfeld et al., 2006; Dubberly, 2005). Each one with their particularity either in the technological area or in the way each product-development stage is worked. However, despite the differences, it has been noticed that all of them offer tools so that the companies can try to attain a more formal, systematic and integrated PDP process.
According Rozenfeld et al. (2006), product development also involves product follow-up activities, after the release, so as to be made any necessary changes in the speciications, planned to discontinue the product on the market and incorporated in the PDP, the lessons learned along the cycle life of the product.
For Romero et al. (2010), a product life cycle varies greatly depending on the type of product, but everyone goes through four phases which are: introduction; growth; maturity and decline. Also argues that some authors also suggest an intermediate stage between stages maturity and decline, called saturation. At this stage, measures should be adopted for the creation of new products and promote the revitalization of the product in order to extend the period of maturity and can induce a new stage of growth in sales.
3.2 Changes in a product design in its development
According to Carvalho & Benedetto (1999), ierce company competition, the rising need for product innovation and the great variety of customers have made product changeover an inevitable reality, and the ability of companies to incorporate those changes will turn out to be a powerful weapon in the market.
Carvalho & Benedetto (1999) also defines engineering changeover as any alteration inlicted in a piece or existent product set which will affect its form, interface or function. Furthermore, he also states that the reasons to carry out a changeover include the correction of project errors, improvement in the manufacturing and assembling of the product, improvement actions required by competition actions and changeover requested by the customers.
cycle and in order to correct the project, to meet market needs and also for company strategic reasons. Related to that, product and project life cycles tend to be reduced causing the companies to further worry about product changes in the post-development phase.
However, as it was seen before, those changes must be controlled and minimized, since they signiicantly affect the proitability of the company. The PDP model adopted to guide the development projects must incorporate appropriate action sequencing so that it will be possible to anticipate those changes as fast as possible. In the current study, it was observed that the process needs improving, but the company should be aware of the critical points in order to direct the changeover process. Investigating the alterations and their impact shows itself vital to assess the company PDP performance.
3.3 The company PDP
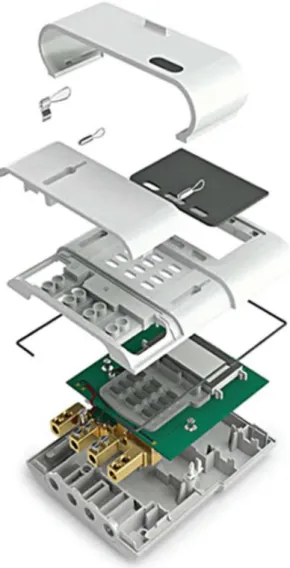
The objective of the current article is the electronic power meter which is made up of mechanical and electronic parts. This kind of meter performs its electronic metering basic functions; however, there is an interaction between both technologies. Mechanical parts perform several functions such as to support, ix and protect the electronic parts, to isolate the live parts and to provide an interface between the product and the user as well as to protect them (users) avoiding accidents and rendering a more adequate visual to the product. In addition to that, both the electronic and mechanical parts are subject to several kinds of legal and normative requirements. Those obligations, in turn, will demand a continuous investment in research, development and in new technologies as well as in material and solutions capable of meeting the more and more demanding market requirements compelling the company PDP to be perfectly synchronized with the technology deployed in the product and with the costs set by the market and by the company. In Figure 2, you can see the exploded view drawing of an electronic power meter where it is possible to notice the electronic and mechanical parts of the product.
The company PDP is structured in a logical phase sequence separated by decision points. Those points provide the basis for an integrated management, decision-making and loan authorization in each PDP phase. Thus, the activities related to the following phase cannot be started before the approval of the previous phase.
The process starts in the macro phase M0 which is ensued by the macro phases M10, M20, M70 and M90. In those phases, decision-making is mandatory so that we are able to continue, review or cancel the project, if necessary. In Figure 3, in summarized form, it is displayed the project and project life cycle of a company PDP.
The Figure 3 shows the macro phases in the project development and its decision-making points. It is also clearly shown the project and product life cycle and the areas involved in each PDP phase. In reality, it is possible to notice that, during the life cycle of the project, there are actions being performed by different areas of the company with the same level of responsibility making it clear that the management model adopted seeks the interaction between the different areas of knowledge. But, as it was demonstrated before, product changes are often necessary in the post-development phase, and that is not an exception for this company.
3.4 Product change management in the company
The company makes use of an electronic document management system (EDMS) where all procedures and lowcharts of the company areas are made
Figure 2. Exploded view drawing of an electronic power
available. Through the consultation to this system, it was possible to identify the procedures designed to change the product in order to understand the mechanism used when it is necessary to change a product in the post-development phase and after the M70 phase as shown in Figure 3.
The identiied procedure is called project development and product change. It states that new products and the existent product changes are performed through project development. Product changes of which previewed project cost is lower than US$ 60,000 have to be worked by means of a Product Change Analysis (PCA) or by simple reviewing of the product documentation.
PCA has its own lowchart and it is stored in the EDMS of the company. Its function is to assist the management and the integration of several areas of the company involved with product changes that prove to be necessary. The agent responsible to open, follow up and close the document is the product engineer. In it, the changes are described as well as their justiication, origin and objectives. Project cost estimations, feasibility studies and activity deadlines are also shown in it. Once it is open, it is submitted to different hierarchical levels of the company in order to be approved depending on its complexity.
It is important to stress out that the decision whether to open or not a PCA is taken before its approval and is decided in a meeting between the product engineer and the areas working with the product changeover. In the cases where is decided not to open the PCA due to low complexity or because of any other reason justifying such decision, a product documentation review can be performed
In the current study, the product documentation is restricted to mechanical documents composed by drawing of pieces, sets, packages, among others. It is
also composed by electronic documents made up of PCBs and PCBAs and irmware documentation.
The product documentation is also stored in the EDMS of the company as well as its historic review ensued by a procedure called Creation and Control of Documents. There, it is deined that in case document changes, corrections and any kind of adjustments prove to be necessary, the process should be formalized in the own EDMS by means of a review request and simply by document review opening. In both cases, those changes should be justiied and previously approved by the coordinator of the area responsible for the document and by the product engineer, before they are released and submitted to the other areas of the company and, later, to the suppliers
The company is certiied by NBR ISO 9001 and its procedures seek to meet the requirements demanded by the norm including the PDP process. The critical analysis cycle of product change is an ISO recommended practice in which PDP is beneited since the project quality is increased.
Due to the existence of such structure designed to control the changes, it was noticed the opportunity to use it to track information and check its impacts considering the fact it is not done in an automatic way. As it will be shown below, the change registration depends, in practice, on the users’ discipline. Today the database is fragmented making it dificult to rescue the data completely.
3.5 PDP Performance assessment
For Kaydos (1999), it is important to measure the performance because it helps to deine the responsibilities and objectives, to state the strategic goal alignment and to understand the scope of the process. It also brings a more eficient allocation of
resources and it enables a delegation policy and a change in the organization culture. The later could be understood as a company PDP changeover
According to Rozenfeld et al. (2006), industries make use of several kinds of performance indicators and most of them are applicable in the company PDP. However, it is known that the product used in the current study presents a historic record of changes indicating possible problems in the company PDP. Therefore, it was decided to investigate the number of changes and their corresponding costs; measurements of other process performance parameters are not part of the current work.
3.6 Similar works
Searches for similar works were made during this research stage. We designed to glimpse a research method and a change analysis procedure able to help creating a causal relationship between those changes and their costs so it would be possible to identify improvements points in the PDP. Nevertheless, it was not possible to ind any sources on the topic speciically forcing us to propose another research approach for that work.
4 Listing of changes, their drivers
and impact
4.1 Listing of product changes
The company EDMS allows document search from key words; the product name used is called alpha in this article for reasons of industrial secrecy. We also know that the project started in March, 2006 and inished in September 2007. The research period was deined to be between October 2007 and December 2012 with 345 documents being searched between the PCA the product documentation process.
Despite that, not all documents found refer to product changeover. Thus, upon reading each searched document, those who did not relate to product change were simply discharged.
During the documentation reading, it was noticed that the PCA could be related to several product documents, that is, were related to the same alteration process. The same fact was observed upon reading the mechanical and electronic documents. So, the documents referring to the same changeover were grouped and deemed as pertaining to a unique product change.
As many as 127 product changes were performed which corresponded to 37% of the total amount of searched documents. In addition to that, 31 documents did not permit us to state whether they referred to product changes or not since they were deprived of any information enabling such identiication which led us to disregard them as study objects.
4.2 Listing of the product changes costs
It is clear that any activity performed inside a company yields cost. It is also known that investments and changeover in devices and equipment are often necessary measures in a product change process.
The areas in the studied company are divided in cost centers. Each one is linked to a pre-deined account and budget, which, in turn, is managed by the people responsible for the area.
Also, when necessary, the department can create sub-accounts, called internal orders which are allocated to pay the costs for a certain project and its activities, as for example, product changes. Those internal orders are created and controlled by the area itself through a company management system and by making use of spreadsheets. Those data are periodically sent to the inancial department of the company.
Aware of that, we sought to identify, in the searched documentation, the existence of any sort of information, a number of internal order, for example, that enabled to track the costs and investments made in each product change process. It was possible to ind only 3 PCAs containing internal orders that permitted us to track down only the expenses related to those orders issued by the research and development area (R&D).
In view of that, it was necessary to consult the other areas involved in the PCA in order to state the corresponding costs. However, it was found that only research and development and product manufacturing engineering departments adopted the use of internal orders to inancially control their activities. The other areas, despite having controlled their expenses, didn’t have detailed information about them not permitting to assert the cost of the product changes
As mentioned before, product changes can bring on the need for equipment manufacturing and changing. After consulting the searched documentation, it was found that some of them brought on such a need. The area responsible to manage this company asset is the manufacturing engineering which has a log of the those asset changes Therefore, having the numbers and the review of the document searched in the item 4.3, it was possible to state the investments made in the product change process which impacted in the assets manufacturing and changing processes.
Once that was achieved, it was only possible to state the partial cost of 8% of the identiied changes. The other changes did not show any information enabling to track their corresponding costs. That points to a problem in the registration system which has to be worked in the improvement phase.
4.3 Product change drivers
change driver was identiied based on the information found in the documents and in the company EDMS being each change assigned to their speciic driver.
However, in order to facilitate the understanding and the tabulation of the other collected data, those drivers were organized according to their afinities. It was possible to obtain as many as 9 drivers as shown in the Table 2.
Table 2 shows the list of the 9 created drivers and a brief description of each of them. It is worth noting that those drivers are factors inluencing the development of solutions for/the power meter market. They could be considered in a preventive way, and whenever possible, from the starting development stages of new products.
4.4 Tabulation of product changes, their costs and drivers
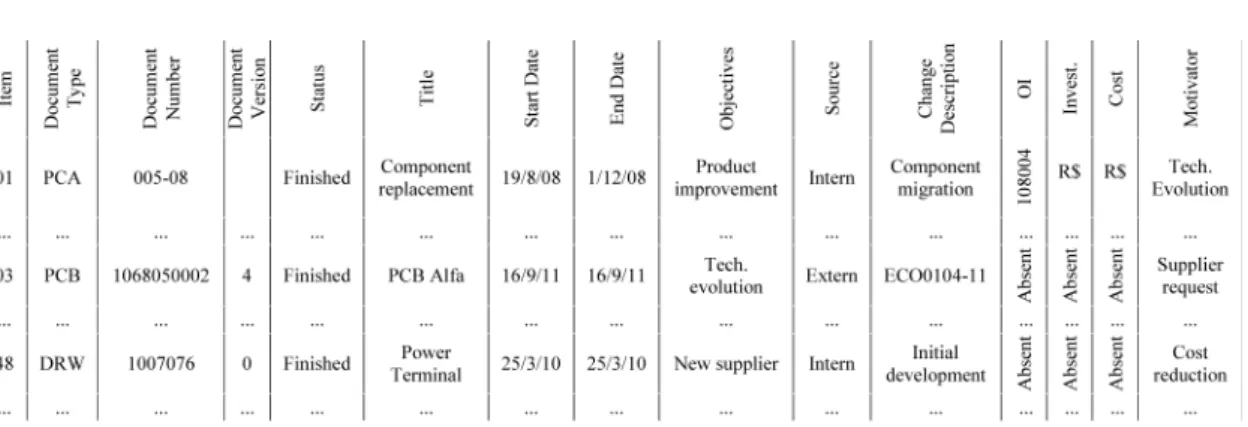
After having collected all information, a table was created, in which it was possible to ind all product-change-related documents, such as: product change analysis and electronic and mechanical documentation. The table has 15 columns and 127 lines varying in accordance of the number of product changes
identiied in each product document. An excerpt of the table is shown in Figure 4.
Figure 4 shows a general view of the tabulation which obtained the data from the consultation of the searched and selected documentation including the internal orders, their corresponding investments and costs as well as the drivers of each product change. Whenever the data cannot be found, and /or are not applicable, the cells were left in blank.
In this example, the investment and cost information were suppressed so it could preserve the studied company, but the inancial impact information is published in the form of percentage in order to have an idea of its importance.
5 Results presentation
From the consultation with the technical documents of the company and after having followed the established selection criteria, 127 product changes were identiied; those changes demanded a lot of effort. Two months was the estimated time to identify all product changes. Due to the great bulk of fragmented information in the documentation, it was necessary to consult with the people involved in the change process.
Table 2. List of product change drivers.
Driver Description
Project correction Corrections identiied internally by the engineering and quality areas, which resulted in product change.
Market demand Changes originated from the marketing/market research area. Technological evolution Replacement of parts and pieces aided by new technologies. Performance improvement Changes aiming at improving product performance in the ield. Standardization Standardization of parts and pieces.
Cost reduction Changeover in the manufacturing process, which impacts in product change. Elimination of parts and pieces.
Customer request Customers’ product customization and complaints.
Supplier request Changeover aiming at improving the manufacturing process of pieces and parts coming from suppliers.
Production request Changeover aiming at improving the internal assembling process of products coming from production.
Source: Elaborated by authors.
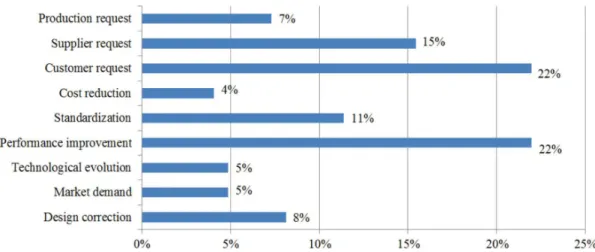
Another premise of the current work was to track down the total cost of each changeover. It was, however, not possible to attain that target due to the fragmentation of the registrations. It was found that the system did not permit us to get the total amount; only the partial cost of 8% of the changes could be tracked. Nevertheless, the total amassed corresponds to 12% of the total cost of Alpha product development. The number tends to be much bigger which is an alarming perspective showing how burdensome the changes made after the development phase can be. Another reached result was the identiication of the product change drivers. In the Figure 5 it is shown the percentage distribution from the research universe.
Figure 5 shows that he main product change drivers are customer request and performance improvement, both with 2%. It was possible to stress out the quantity of supplier requests, with 15%, and standardization, with 11%. Those drivers clearly show the inluence exerted by the customers and suppliers in the solutions to be given to the product.
Another target intended to attain was to relate the cost of product change with its drivers in a graphic form. That could illustrate which drivers should play the main inancial role. However, due to the ineficiency of the system, it was not possible to assert and show such relationship.
It is possible to point out that the requests from the customers tend to yield a greater inancial impact than expected due to the product customizations demanded by different customers. That fact, according to the researched documentation, generally brings up the need for changing or manufacturing existent company assets such as molds and tools which, in turn, require high level investments.
6 Discussion
This paper is investigative permitting different kinds of approach with possible divergent results. Despite the search for similar works, none of them
have been found. For that reason it was decided to use the approach described in the current article.
The study approach conined itself to the documentation concerning about product change (PCA and product documents) restricting the consultation sources and the identiication of product change and its cost. That was the approach adopted in the current article since, in the internal procedures, it was not possible to ind any information about other possible consulting sources.
However, the present work has revealed quite a lot. It is believed that, with the existent change and cost registration structure, it would be possible to quantify the changes and their drivers. One could also state their direct costs and infer their indirect costs. Although it turned out to be viable, the work designed to get those data would be extremely thorough involving the contact with the people working with those changes. Many of them do not work in the company anymore making it dificult to access that information. That shows and conirms the importance of an eficient document management policy in addition to a good knowledge management in the development of new products.
Another important discovery was the existence of documents which did not follow any formal procedure in the EDMS which were not consequently taken into consideration for study. That fact stresses out, once again, a problem in the information registration system of the company PDP and the existence of non-mapped inancial impacts.
Despite all that, the results obtained may suggest changes in the PDP of the company, especially in relation to the search and interpretation of the company needs for the reason that the highest change rate refers to customers’ request. That implies an opportunity of improving the process through which customers’ needs are identiied bringing the need of developing methods that will permit the company to meet the needs of a larger market share and enabling it to stand
that the company PDP is not adapted to people, but demands them to adapt to it.
In short, it is believed that the current research together with other indicators can provide assistance in the identiication of changes in the company PDP shaping the latter to its reality in the market and enabling it to seek for evolution.
References
Agência Nacional de Energia Elétrica – ANEEL. (1957, 12 de março). Decreto N°. 41.019, de 26 de fevereiro de 1957. Regulamenta os serviços de energia elétrica (seção 1, p. 5657). Brasília, DF: Diário Oficial da República Federativa do Brasil. Recuperado em 15 de junho de 2015, de http://www.aneel.gov.br/cedoc/ dec195741019.pdf
Agência Nacional de Energia Elétrica – ANEEL. (2010, 15 de setembro). Resolução Normativa n°. 414, de 9 de setembro de 2010. Estabelece as Condições Gerais de Fornecimento de Energia Elétrica de forma atualizada
e consolidada. Brasília, DF: Diário Oficial da República
Federativa do Brasil. Recuperado em 22 de abril de 2013, de http://www.aneel.gov.br/cedoc/bren2010414.pdf Associação Brasileira de Distribuidoras de Energia
Elétrica – ABRADEE. (2014a). Relação das associadas. Recuperado em 14 de junho de 2015, de http://www. abradee.com.br/abradee/associadas
Associação Brasileira de Distribuidoras de Energia Elétrica – ABRADEE. (2014b). Dados de mercado das empresas distribuidoras Associadas à ABRADEE de 2014. Recuperado em 14 de junho de 2015, de http:// www.abradee.com.br/imprensa/noticias/130-Back, N., & Forcelini, F. A. (2002). Projeto de produtos
(apostila). Florianópolis: Universidade Federal de Santa Catarina.
Back, N., Ogliari, A., Dias, A., & Silva, J. C. (2008) Projeto Integrado de Produtos: planejamento, concepção e
modelagem. Barueri: Manole.
Barbieri, R. (2006). A evolução da indústria brasileira de medidores de energia elétrica e sua importância estratégica. In XII Seminário da Associação brasileira da indústria elétrica e eletrônica. Minas Gerais. ABINEE. Recuperado em 15 de abril de 2013, de http://www.tec. abinee.org.br/2006/
Baxter, M. (2003). Projeto de produto: guia prático para o desenvolvimento de novos produtos. São Paulo: Edgard Blücher.
Boothroyd, G., Dewhurst, P., & Knight, W. (1994). Product design for manufacturing and assembly. New York: Marcel Dekker Inc.
Brasil. Tribunal de Contas da União. (2009). Relatório de Auditoria TC 006.734/2003-9. Recuperado em 6 de julho de 2015, de http://www.tcu.gov.br/Consultas/Juris/Docs/ judoc/Acord/20090721/006-734-2003-9-MIN-WAR.rtf out in the market. In addition to that suggestion, it
could be mentioned those inferred from the results, such as a closer involvement of suppliers in the PDP and the adoption of tools and methods enabling to identify the most appropriate and asserting solutions concerning the improvement of product performance.
7 Conclusion
This article presented a way of identifying different kinds of product change drivers by means of proposing them a certain form of procedure and classiication. That could be applied to other areas of industry provided slight adaptations in the classiication of the drivers were made; all in accordance with the reality of each organization.
The company, the object of this study, does not have a system which automatically presents the information about the changes and their costs as it was done in the current work. The research is delivering to the company a spreadsheet relating all product changes, their costs and their corresponding drivers. The data could be used in other works inside the company.
The results clearly show the inluence exerted by the customers and the suppliers into the products, since they represent together 37% of the identiied product changes suggesting the need for improvement in the company PDP. Basic principles should be reviewed as, for example, search and interpretation of customers’ needs and the involvement of suppliers in the product development phase. That reality is reinforced by the alarming results of 8% of what was searched and 12% in the development cost as well as by what was found during the research and reading of the searched documents where many product changes could have been previewed during the development phase.
However, it is known that the product, object of study, was the irst project in which the company used a formal methodology to manage the product development process, and that several improvements were made and new tools were adopted in further developments.
Project Management Institute – PMI. (2008). Um guia do
conhecimento em gerenciamento de projetos (3 ed.). São Paulo: Saraiva.
Romero, E., Fo., Ferreira, V. C., Miguel Cauchik, A. P., Gouvinhas, P. R., & Naveiro, M. R. (2010). Projeto do produto. Rio de Janeiro: Elsevier.
Rozenfeld, H., Forcelinni, F. A., Amaral, D. C., Toledo, J. C., Silva, S. L., Alliprandini, D. H., & Scalice, R. K. (2006). Gestão de desenvolvimento de produtos: uma referência para a melhoria do processo. São Paulo: Saraiva.
Secco, A. (2001). O impacto do apagão na vida dos brasileiros. Revista Veja, 19, 38-45.
Shore Design. (2015). Onstream | Electricity & Gas Smart Metering. Recuperado em 6 de julho de 2015, de http://www.shore-design.co.uk/case-studies/industrial/ smart-meter
Carvalho, S. S. A., & Benedetto, H., No. (1999). Engineering Change Management. Recuperado em 27 de abril de 2013, de http://www.numa.org.br/conhecimentos/ conhecimentos_port/pag_conhec/ECM.html
Cunha, G. D. (2008). A evolução dos modos de gestão do desenvolvimento de produtos. Produto&Produção, 9(2), 71-90. Recuperado em 27 de abril de 2013, de http:// seer.ufrgs.br/ProdutoProducao/article/view/4346/2294 Dubberly, H. (2005). How do you design? São Francisco:
Dubberly Design Office. Recuperado em 30 de abril de 2013, de http://www.dubberly.com/articles/how-do-you-design.html
Kaydos, W. J. (1999). Operational performance measurement: increasing total productivity. New York: Taylor&Francis. Pahl, G., Beitz, W., Feldhusen, J., & Grote, K. H. (2005).