THE EVOLUTION OF TAX BURDEN AND TAX EFFORT IN
THE OECD BETWEEN 2000 AND 2015
Maria João Barros Alves Cavadas
Dissertation submitted as partial requirement for the conferral of MSc in Management
Supervisor:
Prof. Paulo Jorge Varela Lopes Dias, ISCTE Business School, Department of Accounting
TH
E
EV
O
L
U
T
IO
N
O
F
TA
X
B
U
R
D
EN
A
N
D
TA
X
EF
FO
R
T
IN
TH
E
O
EC
D
BE
T
W
E
E
N
2000
A
N
D
2015
M
ar
ia
João
B
ar
ros
A
lve
s
C
avad
as
ABSTRACT
Fiscal policies are one of the main concerns of any government. Balancing the decisions regarding public expenditure and how that expenditure is to be financed is paramount to allow for a favourable level of welfare in a society. The expenditure side is dependent upon the collection of revenues that can finance the government’s expenses. These revenues come mostly from taxes. Therefore, taxation plays a pivotal role in a society, and it is the focus of this dissertation. Greater attention is paid to what can be considered measures of the level of taxation of a country – tax burden and tax effort. There is great deal of concepts attached to taxation, hence the necessity to have them defined and explained in order to make any further analyses. A systematic literature review is performed to study the investigation on taxation since 1972.
A database of data for 35 of the 36 countries of the OECD is used to compute the three aforementioned metrics, which are then analysed and compared between them. An alternative measure of tax effort (the World Tax Index) is briefly described, since it is a breakthrough in the field. The development of new metrics in future investigation is proposed.
RESUMO
As políticas fiscais são uma das preocupações fundamentais de qualquer governo. Fazer o balanço entre as decisões relativas às despesas públicas e como essas despesas devem ser financiadas é crucial para permitir um nível de bem-estar social favorável. O lado da despesa depende da arrecadação de receitas que permitem financiar as despesas públicas. Estas receitas provêm maioritariamente dos impostos. Assim, a tributação (ou fiscalidade) tem um papel fundamental na sociedade, e será o foco desta dissertação. Uma maior atenção é dada ao que podem ser consideradas medidas do nível de fiscalidade de um país – a carga fiscal e o esforço fiscal. Existem vários conceitos relacionados com fiscalidade, pelo que há a necessidade de defini-los e explicá-los, para que se possam fazer análises adicionais. Uma revisão sistemática de literatura é elaborada com o intuito de estudar a investigação em fiscalidade desde 1972.
Utilizam-se dados de uma base de dados para 35 dos 36 países da OCDE para calcular três das métricas supramencionadas, que são posteriormente analisadas e comparadas entre si. Uma métrica alternativa de esforço fiscal (o “World Tax Index”) é descrito brevemente, uma vez que é um progresso no campo. É proposto o desenvolvimento de novas métricas em investigação futura.
KEYWORDS: tax burden; tax effort; taxation; tax systems
ACKNOWLEDGEMENTS
To all of the people below – thank you. Thank you for making me do this. Thank you for guiding me, each in your own way, and for playing the role you play in my life.
To my Mum and Dad: It was not just the financial support. It was every tear that you stopped. It was every word that you told me, every conversation we had, every advice I almost did not take. I love you. Thank you for showing me that I can do anything I put my heart and soul into.
To Luísa and Rita: For every picture shared, every joke, every class we had together. For every laughter, every conversation, and the daily friendship. Thank you for suffering along! You are the best.
To Pedro: For the love you give me every single day. For the patience. For the dinners, the rides, the phone calls, and the help with my Excel whenever it decided not to co-operate. For being my best friend and singing along. You did tell me I would surprise myself. I love you more than anything.
To my supervisor and professor Paulo Jorge Dias: Thank you for the patience and for everything you have taught me, not only during the making of the dissertation, but also during classes on my first year of the master’s. Thank you for making this possible.
To Carlos: There is nothing I can write that would do justice to what you mean to me. I will just leave it here.
To all of my closest friends and family, thank you for being a part of my life and making me believe in myself and my capabilities.
INDEX
ABSTRACT ... III RESUMO ... III ACKNOWLEDGEMENTS ... V LIST OF ABBREVIATIONS ... VII
1. INTRODUCTION ... 1
2. DEFINITIONS OF TAX BURDEN AND TAX EFFORT ... 1
3. TAXATION IN LITERATURE: A SYSTEMATIC LITERATURE REVIEW ... 7
3.1 THE STUDY OF TAXATION ... 7
3.2 SYSTEMATIC LITERATURE REVIEW ... 9
4. METRICS TO DETERMINE TAX BURDEN AND TAX EFFORT ... 16
4.1 FRANK’S INDEX ... 18
4.2 BIRD’S INDEX ... 19
4.3 COMPUTING THE INDICES FOR OECD COUNTRIES ... 22
4.3.1 FORMULAS AND VARIABLES... 22
4.3.1.1 FRANK’S INDEX ... 22
4.3.1.2 BIRD’S INDEX ... 23
4.3.2 RESULTS AND ANALYSIS ... 24
4.3.2.1 FRANK’S INDEX ... 24
4.3.2.2 BIRD’S INDEX ... 28
4.3.2.3 COMPARING THE TWO INDICES ... 31
4.3 THE TAX-TO-GDP RATIO ... 32
4.4 THE WORLD TAX INDEX (WTI) ... 35
5. DETERMINANTS OF TAX BURDEN AND TAX EFFORT ... 37
5.1 STRUCTURAL VARIABLES... 38 5.2 INSTITUTIONAL VARIABLES... 40 5.3 POLITICAL VARIABLES ... 41 5.4 DEMOGRAPHIC/SOCIAL VARIABLES ... 42 5.5 OTHER VARIABLES ... 42 6. CONCLUSION ... 43 BIBLIOGRAPHY ... 44 ANNEXES ... 49
LIST OF ABBREVIATIONS GDP: Gross Domestic Product GNI: Gross National Income GNP: Gross National Product
OECD: Organisation for Economic Co-operation and Development SD: Standard Deviation
SNA: System of National Accounts UAE: United Arab Emirates
UK: United Kingdom US: United States
1. INTRODUCTION
“Taxation has always been a central issue in political economy because it is one of the main activities of all states and a necessary condition for everything else states do. It is the core feature of state capacity.” (Kiser and Karceski, 2017: 76).
The aim of this dissertation is to assess the evolution of the level of taxation as measured by the tax burden and the tax effort in the OECD during the period from 2000 until 2015. An introductory part (section 2) aims at defining and explaining introductory and fundamental concepts related to taxation. In section 3, a systematic literature review is performed in order to analyse the investigation on taxation in literature.
In section 4, three metrics for the calculation of the tax burden and the tax effort of countries are explained and computed: Frank’s index, Bird’s index, and the tax-to-GDP ratio. Furthermore, an alternative metric for the measurement of the tax effort is summarised. In section 5, a literature review is performed in order to gather previously studied determinants of tax revenue. The main conclusions of the dissertation, along with proposals for future research and limitations to the study, are presented in section 6.
2. DEFINITIONS OF TAX BURDEN AND TAX EFFORT
The most general concept underlying this dissertation is that of taxation. Winer and Hettich (2008) summarise the importance of taxation and of its study. Firstly, taxation is fundamental to finance essential services and activities of the public sector, namely the courts, the legal system, national defence, and police protection. Secondly, it allows for the development of social programs, among which the authors highlight public health services, education, and welfare. Finally, the authors mention the “distributional goals” of a community, which can be achieved through taxation. Hence the two sides of the government’s fiscal decisions: the revenue side, which mainly depends on taxation (Macek, 2018; Nisha, 2018), and the expenditure side. The focus of this dissertation is taxation.
Taxes have an economic origin and a political origin (Silva, 2015). The economic origin is related to what has been established about satisfying the financial needs of a political
organisation. The political origin of taxes, on the other hand, regards the political legitimacy of the coerciveness of a specific tax, which is based on political choices concerning both the tax base and the associated tax rate (Silva, 2015).
As Gur (2014) asserts, tax decisions are the result of a bargaining process established between the government and its citizens. On one side of this process, there is the need to levy taxes to finance the government expenditure. On the other side of the bargaining process are the citizens, who wish to participate in the process and have a say on how their payments in taxes are used (Gur, 2014).
The collection of taxes contrasts with the distortion of the behaviour of taxpayers and the decline of economic efficiency that result from increased taxes (Koch, et al., 2005; Xing and Zhang, 2018). For this reason, it is important to investigate and to develop literature taxation-wise, in order for authorities to make the most accurate and economically and socially beneficial decisions with regards to fiscal policies, particularly tax policies.
In order to further develop this subject, one must firstly define what the author considers to be the most basic concept of this dissertation: tax. What is a tax? The literature on any tax-related subject seldom defines tax. The assumption is made that the reader is familiarised with the concept. The author considers it fair to assume that most taxation literature readers have a basic knowledge of the subject under analysis. It is important, however, to explicitly provide the reader of this dissertation with a definition of tax – and every other related concept –, as one of its main aims is to serve as academic literature support for future work.
According to the OECD (2017) a tax is “a compulsory unrequited payment to the government”. The “unrequited” denomination is due to the fact that the benefits the government provides to the taxpayers are not necessarily proportional to the tax payments made.
Some important observations must be made in order not to lead to the misinterpretation of the tax concept as defined by the OECD (2017). In first place, taxes do not include any fines, penalties, or compulsory loans paid to the government. Secondly, compulsory social security contributions are considered to be part of tax revenues. Finally, there are
whether or not to be considered taxes, and therefore as generating of tax revenue. The author believes, however, that the provided definition and notes suffice for the development of the subject in the present dissertation.
A more polished definition of the concept of tax is provided by Xavier (1974), as cited by Silva (2015) – “a patrimonial provision that is established by law in favour of an entity responsible for the exercise of public functions, and whose main aim is to obtain the means for the financing of such entity”1.
Two other important and basic taxation-related concepts ought to be briefly addressed: tax systems and tax policies. The tax system established in a state is the reflection of the communal values of that state and of those who hold the political power (Nisha, 2018).
According to Winer and Hettich (2008), the underlying structure of tax systems is identical among different jurisdictions, despite the great deal of variations encountered. Le et al. (2012) affirm that the existence of an effective tax system is a crucial factor for the economic development of both developing and developed countries. Not only do tax systems have a great influence on investment decisions, but they can also promote a lower aid dependency in low-income countries if they result in higher tax revenues. Furthermore, the effectiveness of tax systems encourages good governance, strengthens state building, and promotes government accountability (Le et al., 2012).
Tax policy is a type of fiscal policy. Winer and Hettich (2008) provide us with a practical definition of tax policy - the “manipulation of some aspect, or a combination of characteristics” of what they refer to as the “tax skeleton”. It is the government’s strategy for influencing the performance of the economy (Nisha, 2018). In summary, this tax skeleton concerns the various bases taxes are levied on, the tax rates structures, which can be simple or more complex, and other special arrangements which affect how those tax bases are defined, and determine tax rates for specific components of the tax base.
Every tax policy is applied with the main objective of generating the revenue required to fund public services and the state’s fundamental expenses in order to enhance the public interest (Arif and Rawat, 2018; Kim and Lim, 2018). To meet such crucial aim, the government and the tax authorities must ensure revenue adequacy and an adequate level
of tax burden (Kim and Lim, 2018). Understanding countries’ tax effort levels is paramount for tax policy makers to know which countries have the capability of increasing their tax revenue and which ones do not (Fenochietto and Pessino, 2010).
One important and noteworthy duality in what regards taxation is that of vertical equality and horizontal equality (Kim and Lim, 2017). On one hand, the principle of vertical equality concerns how the tax system affects every taxpayer and their families, from the bottom to the top of the income spectrum. In this sense, tax systems should be established in such way that those who are more able to pay ought to contribute more in taxes than taxpayers who have less ability to pay (Cronin et al., 2012). On the other hand, horizontal equality measures whether taxpayers within similar conditions of income, family structures, and age pay identical amounts of tax (Kim and Lim, 2017).
The literature review performed to write this dissertation led the author to conclude that great deal of authors in tax literature mention both concepts of “tax burden” and “tax effort” without providing the reader with precise and clear definitions. “Tax burden” and “tax effort” are frequently assumed to be self-defining concepts. Vallés-Giménez and Zárate-Marco (2017), for instance, claim that there is not a universally satisfactory approach of tax effort in the literature. Furthermore, as noted by Fedyshyn (2013), there are several interpretations of the term “tax burden” in the literature.
In order to investigate the evolution of both the tax burden and the tax effort of countries, it is paramount one establishes accurate definitions of these concepts. The analysis of the literature regarding taxation provides us with several important, however, disparate ones. Furthermore, these two terms are frequently used interchangeably.
Semantic-wise, a burden is “a load, typically a heavy one”2, and in particular it can be “a
duty or misfortune that causes worry, hardship, or distress”3; effort can be defined as a
“strenuous physical or mental exertion”4. Therefore, in simple terms, both tax burden and
tax effort would represent the weight borne by taxpayers.
The most commonly found representation of tax burden in the literature is that of the percentage of tax revenues over a measure of income, normally GDP, e.g. Bird (1964), Schneider (2005), Švaljek (2005), Vasiliauskaite and Stankevicius (2009), Lago-Peñas & Lago-Peñas (2010), Dubauskas (2016). To Wang (2007: 279), the total tax revenue over GDP is “a standardised measurement of tax burden”. According to Reed and Rogers (2006: 404), tax burden is “the ratio of total tax revenues over personal income”. All of these definitions, despite some differences, measure the tax burden as the simple ratio between tax revenue and a measure of income. Nevertheless, the most widely used variable in the literature is the tax-to-GDP ratio (Machová and Kotlán, 2013), which Mahdavi (2008) refers to as the level of taxation.
The measurement of the tax burden of a country is an attempt to measure the importance of the public sector of that country’s economy in contrast with its private sector (Frank, 1959). Furthermore, tax burden is frequently considered to be a crucial determinant of a country’s shadow economy (Schneider, 2005; Buehn et al., 2018). Reed and Rogers (2006), however, argue that tax burden can be an inaccurate measure of tax policy, which the authors claim is acknowledged by the literature. Consequently, this lack of accuracy of the variable is frequently omitted from research discussions. Reed and Rogers (2006) justify the use of tax burden in studies with both the fact that it is easy to compute, due to data availability, and the fact that the literature lacks more qualified alternatives. These reasons are, however, unsatisfying: not only is there the possibility of “misinterpretation of empirical results”, but also, and more importantly, of low quality tax policy advice. In order to evaluate the preciseness of tax burden as a proxy for tax policy, Reed and Rogers (2006) quantify the relationship between changes in tax burden and changes in tax policy. They conclude that better measures should be constructed and applied.
Despite the fact that a great deal of authors agree with the aforementioned definition of tax burden, to Bird et al. (2008) and Thornton (2014) the ratio between tax revenues and GDP corresponds to the definition of “tax effort”. Rabiei and Balagetabi (2013) agree, and go one step further by defining a tax effort index, which corresponds to the ratio between the actual tax effort and the estimated tax effort. The difference between the actual and the estimated tax effort is simple. Both are computed with GDP as the denominator, but the actual tax effort is the ratio between the total tax revenues in one year and GDP.
Some authors define tax effort differently. According to Fenochietto and Pessino (2010) and to Bingyang and Qingwang (2012), tax effort is “the ratio between actual revenue and tax capacity”. This tax capacity is “the maximum level of tax revenue that a country can collect given its economic, social, institutional, and demographic characteristics” (Fenochietto and Pessino, 2010). In accordance with these authors, Le et al. (2012) assert that the usage of tax effort without the weighting of these characteristics is not effective for cross-country comparison “due to different economic structures, institutional arrangements, and demographic trends” (Le et al., 2012: 2). To overcome this issue, some authors favour the usage of the tax effort index, which is the index of the ratio between the share of the actual tax collection in GDP and taxable capacity. Here, taxable capacity is the “predicted tax-to-GDP ratio that can be estimated empirically, taking into account a country’s specific macroeconomic, demographic, and institutional features, which all change through time”.
Fenochietto and Pessino (2010) provide us with another important concept, potential tax collection, which “represents the maximum revenue that could be obtained through the law tax system” (Fenochietto and Pessino, 2010: 66). Furthermore, the authors refer to the difference between this potential tax collection and a country’s actual revenue - the tax gap. This is “a function of tax capacity and the extent to which, by tax laws and administration, a society wishes to mobilise resources for public use” (Fenochietto and Pessino, 2010: 66).
There is some misconception around these concepts, which can lead to some confusion in their study and empirical analysis. The author proposes the agreement of clear and unanimous definitions of the concepts in future literature.
Finally, in spite of the focus of this dissertation being the level of taxation, it is acknowledged that there are other important factors in tax policy-making, such as the components of tax revenue (Mahdavi, 2008).
3. TAXATION IN LITERATURE: A SYSTEMATIC LITERATURE REVIEW 3.1 The study of taxation
As stated by Winer and Hettich (2008), both a positive and a normative analysis are required for a comprehensive approach to taxation. The reasoning here is that apart from allowing for the analysis of the tax systems in existence, it leads one to debate possible improvements of such systems.
According to Winer and Hettich (2008), the study of taxation is divided in two extensive approaches, which shall be analysed to the extent that is relevant for the development of this dissertation. The first approach is related to the works of Wicksell (1896), Lindahl (1919), and, more recently, Buchanan (e.g. 1968, 1976). The second approach Winer and Hettich (2008) refer to is, according to these authors, based on the works of Edgeworth (1925), Ramsey (1927), and Pigou (1951), and, more recently, of Mirrlees (1971, amongst others. These approaches are different both in their emphases and in the results that they arrive at. Nevertheless, both deal with the same essential problem: the separation of taxing and spending.
The goods and services provided by governments, i.e. public goods, are different from those of private markets. Public goods are consumed equally by all members of a collectivity, and they cannot be rationed according to price, which is the case of private goods. Preference revelation and free-riding problems can therefore arise, as those who do not pay taxes voluntarily are not withheld from consuming those public goods or services. In order to overtake these two significant economic drawbacks, taxation is coercive in most collectivities. As the authors expose it, the coerciveness of taxation is done through the creation in such collectivities of “tax systems in which there is only a diffuse and distant link between additional consumption of publicly provided goods and increases in tax liability” (Winer and Hettich, 2008: 393).
The separation of taxing and spending bears some problems. In order to reduce their tax liability, taxpayers will adjust their activities. This adjustment behaviour leads to a loss of economic welfare in comparison to a situation where such trade-off would not be elicited. In the literature, such loss (the excess burden or deadweight cost of taxation) is a measure of the inefficiency generated by a specific tax (Winer and Hettich, 2008).
The second problem with the separation of taxing and spending is concerned with redistribution. The allocation of public goods and their costs among their users in a collectivity, and the determination of the level of production of those public goods cannot be done through markets. Therefore, there is the need to employ other mechanisms in order to make decisions. On one hand, all the available collective decision processes establish their own incentives for redistribution between the members of a collectivity. On the other hand, the separation of taxing and spending makes understanding the distributional implications of the numerous ways of providing and financing public programs more complicated. This can result in the management of public resources for personal purposes by those who are in a position to do so (Winer and Hettich, 2008).
It is important to note that, despite considering the same essential issue – the separation of taxing and spending –, the two approaches differ in the way they deal with their implications. Essentially, the first approach regards the need for collective decision processes, for fiscal structures that would allow for the reduction of the gap between taxing and spending. This approach can also focus on the limitation of coercion, by considering the institutional and fiscal constraints that would allow for that (Winer and Hettich, 2008).
The second approach considers that the decision processes are taken as exogenous. The assumption is made that there is a social planner whose role is to make decisions on behalf of the collectivity based on a exogenously-defined welfare function. The emphasis is on the welfare of the collectivity, and tax systems are designed to maximise it, under an assumed analytical framework (Winer and Hettich, 2008).
Given that the tax systems in existence are built upon the decisions made through collective choice processes, the comprehensive approach to taxation which introduced this part can only be based on the first of these two approaches. The reasoning here is that in order to analyse tax systems, one must firstly model those collective choice processes, and compare the results predicted by the models to what is actually observed in the context of those systems. The second approach, which assumes the “social planner”, only allows for a normative analysis (Winer and Hettich, 2008).
3.2 Systematic literature review
A systematic literature review was performed to analyse the incidence of our main taxation-related variables in past studies. Firstly, the relevant paperwork was gathered. The academic paper database used to conduct this search was b-on5.
1. Looking up for publications with at least one of these keywords: tax revenue, tax burden, tax effort. This retrieved a total of 3,286 results.
2. These were narrowed down to the 432 which were part of the Scopus® database.
3. Of these, 378 were published in academic magazines.
4. Articles published in 2018 were excluded, due to the fact that the year is not over. This resulted in a total of 346 being included in this systematic literature review.
The variables analysed are: year of publication, number of authors per article, country of affiliation of the authors, keyword (or keywords) of the article – tax burden, tax effort, and tax revenue –, and methodology used in the article. This review only considers paperwork published between 1972 and 2017.
Some notes ought to be made regarding these results:
• Keywords are not necessarily just “tax burden”, for instance. Keywords like “tax burden level” or “corporate tax burden” belong to the set of keywords.
• Some keywords can be in plural form, e.g. “tax revenues”. • Some authors have more than one country of affiliation.
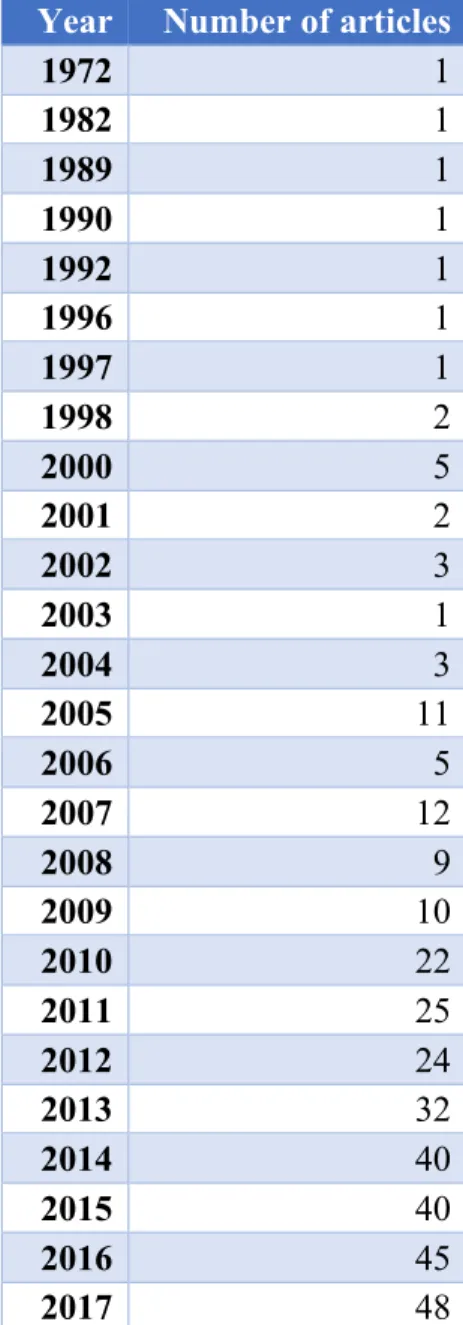
3.2.1 Year
The first aspect of the investigation in taxation that will be addressed is the year of publication of the articles. Has the investigation in taxation increased or decreased over time? Has it been fairly constant frequency-wise?
In graph 1, depicted below, the number of articles published in each year is presented:
Graph 1: Number of articles published per year
The first important note is that the four last years alone account for exactly half of the total number of articles, with 173 articles published since 2014. There was a peak in the number of articles published from 2009 to 2010.
Another important remark the author would like to address is the fact that it cannot be concluded from these results that the investigation in taxation has increased over the years. In order for this literature review to be carried out, limits to the search had to be set. It is clear from the detailed search description above what these limits are. For instance, a great deal of keywords other than the ones mentioned could have been used to filter the results of the search. The keywords used in this review are the ones considered to be significant for this dissertation. The conclusions are of value to the extent that they only regard the 346 articles under analysis.
3.2.2 Country of affiliation
The second variable in this analysis of the investigation on taxation is the country of affiliation of the authors. The results are represented in graph 2 below:
0 10 20 30 40 50 60 1972 1982 1989 1990 1992 1996 1997 1998 2000 2001 2002 2003 2004 2005 2006 2007 2008 2009 2010 2011 2012 2013 2014 2015 2016 2017
Graph 2: Authors of each country of affiliation (% of total)
It is evident that the most represented countries of affiliation are the US (14%, with 94 authors), the Czech Republic (10%, with 67 authors), and China (10%, with 62 authors). The author reiterates the fact that some authors have more than one country of affiliation. Therefore, the percentages presented are in a total of 691. The full list of countries and number of authors affiliated is found in the annexes.
3.2.3 Authorship
The third variable to be analysed is the number of authors of each article. This information is presented in both table 1 and graph 3 below:
Number of authors Number of articles
1 126 2 129 3 70 4 15 5 4 6 2
Table 1: Number of articles per number of authors 14% 10% 9% 7% 7% 6% 3% 3% 3% 3% 2% 33% US Czech Repubic China Russia Spain Germany Ukraine Brazil UK Australia Switzerland
Graph 3: Number of articles per number of authors
Most articles were written by 1 or 2 authors (74%). One fifth of the 346 articles were written by 3 authors, and only the remaining 6% by 4 or more. Nevertheless, one important idea is that most articles (63%) were written by more than one author. Therefore, most authors prefer to work with peers, insofar as our sample is limited.
3.2.4 Keywords
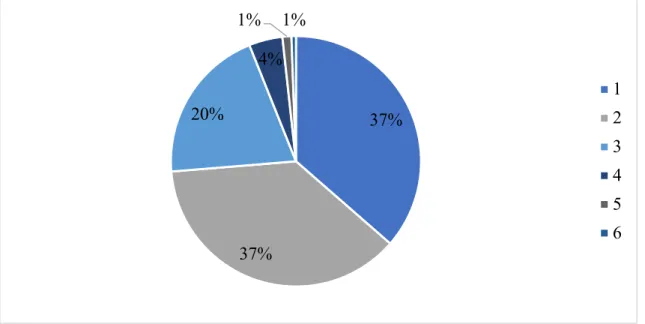
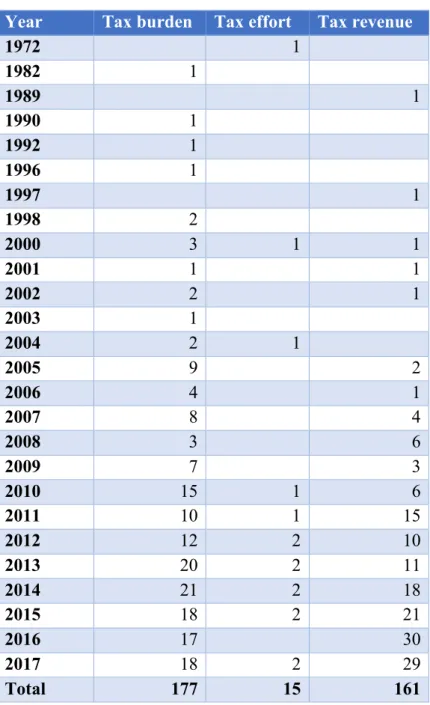
The fourth feature of this study is the frequency of use of each of the keywords tax burden, tax effort and tax revenue. Both table 2 and graph 4 present the results of the search:
Keyword Number of articles
Tax burden 177
Tax effort 15
Tax revenue 161
Total 353
Table 2: Number of articles with each keyword
37% 37% 20% 4% 1% 1% 1 2 3 4 5 6
Graph 4: Percentage of use of each keyword
By analysing the data in table 2, the sum of the number articles (177+15+161) is not 346, but 353. This is explained by the fact that some articles have more than one of this three keywords.
“Tax burden” is the most used keyword out of the three, representing half of the keywords used. “Tax revenue” is also very common, and the difference between the frequency of use of “tax burden” and “tax revenue” is very small. “Tax effort”, however, only exists in 15 of the 346 articles. This goes in hand with what has been concluded with regards to the use of the concepts of “tax burden” and “tax effort” in the literature: either they are used interchangeably, and the preferred denomination is that of “tax burden”; or “tax effort” is interpreted with the other referred meanings or as a sacrifice (this meaning will be explained further in section 4).
Regarding the keywords used, the frequency per year was also analysed. The results are presented in graph 5 below:
50%
4%
46% Tax burden
Tax effort Tax revenue
Graph 5: Evolution of the usage of each keyword (1972-2017)
In general, the number of times “tax burden” and “tax revenue” were used increased throughout the period between 1972 and 2017. Interestingly, in some periods one keyword was preferred over the other. For instance, between 2005 and 2007, “tax burden” was more frequently used than “tax revenue”. In 2008, however, “tax revenue” appeared in more articles than “tax burden” did. Then, “tax burden” surpassed “tax revenue” in 2009 and in 2010. Nevertheless, and although “tax burden” was used more frequently than “tax revenue” overall, since 2015 “tax revenue” has been more frequent than “tax burden”.
3.2.5 Methodology of the article
The last variable analysed is the methodology used in each article. Although an article can be composed of a literature review and the computation of certain metrics based on a database, for instance, the methodology that is considered is the ultimate aim of the article, which in this example is the analysis of the results obtained from the calculations made. 0 5 10 15 20 25 30 35 1972 1982 1989 1990 1992 1996 1997 1998 2000 2001 2002 2003 2004 2005 2006 2007 2008 2009 2010 201 1 2012 2013 2014 2015 2016 2017 Tax burden Tax effort Tax revenue
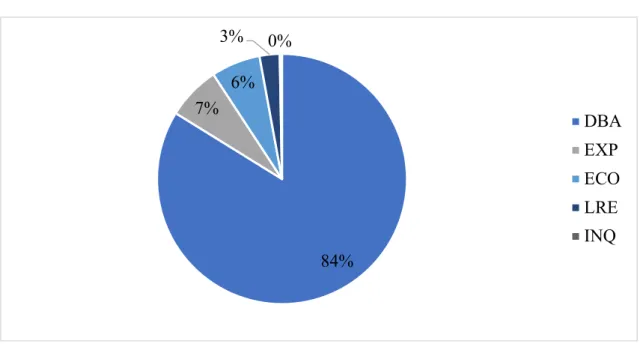
The methodology can be database (DB), econometric (ECO), exploratory (EXP), inquiry (INQ), or literature review (LRE). Table 3 and graph 6 summarise this information in what concerns the 346 articles:
Methodology Number of articles
DBA 290
EXP 24
ECO 22
LRE 9
INQ 1
Table 3: Number of articles per methodology
Graph 6: Percentage of articles per methodology
Articles which make use of a database to draw conclusions from are by far the most frequent, accounting for 84% of the total of articles. Some articles are of econometric type (22) and some are exploratory (24). Articles which are developed as mere literature reviews are very rare (9), and only 1 article applied an inquiry.
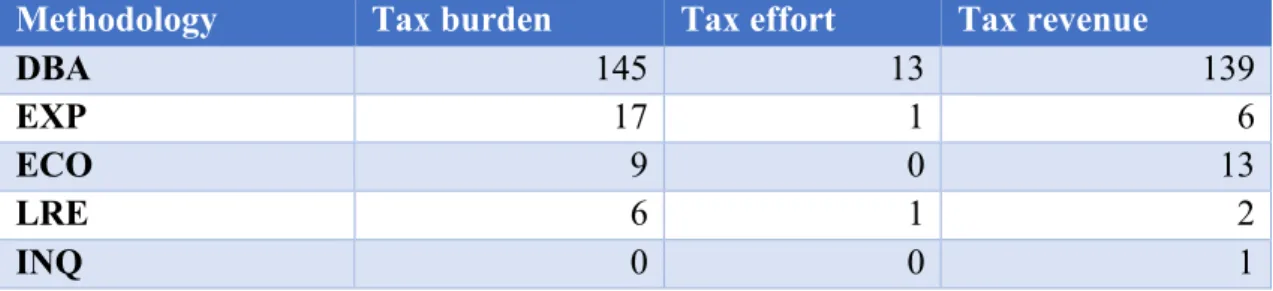
Table 4 depicts the number of times a methodology was used in an article with each keyword, which allows to understand which methodology is more commonly used for each keyword: 84% 7% 6% 3% 0% DBA EXP ECO LRE INQ
Methodology Tax burden Tax effort Tax revenue DBA 145 13 139 EXP 17 1 6 ECO 9 0 13 LRE 6 1 2 INQ 0 0 1
Table 4: Methodology used by keyword used
Not surprisingly, database articles are the most commonly used for every keyword. Exploratory articles use “tax burden” more than any other keyword. Econometric articles are mostly used with “tax revenue”, and none with “tax effort”. The low number of articles of literature review or inquiry type do not allow for a significant conclusion. Nevertheless, most literature review articles used “tax burden” and the only inquiry article used “tax revenue”.
4. METRICS TO DETERMINE TAX BURDEN AND TAX EFFORT
The weight of the public sector versus the private sector in an economy can be evaluated by measuring the tax burden of said economy (Frank, 1959). But how is the tax burden calculated? From what has been stated, one can conclude that the most frequently used measure to calculate the tax burden (or the tax effort, depending on the definition attached to each concept) is the ratio between the total tax collection and a measure of income (GDP, personal income, among others) (Reed and Rogers, 2006; Wang, 2007; Vasiliauskaite and Stankevicius, 2009, Andrejovská and Hudáková, 2016). However, some authors have questioned the efficiency of such measure for appraising the tax system and its weight in the economy of a country. Two important and highly cited authors in the tax effort literature are Henry Frank and Richard Bird, who proposed two indices that would allow for a more adequate comparison of tax burden/tax effort levels between countries (or states, if the level of government allows this comparison be made).
One question can consequently be posed: why would the traditionally proposed measures of tax burden (or tax effort) not be satisfactory for the comparison of countries’ tax burdens? If one computes the tax-to-GDP ratio as a measure of tax burden for two countries, and compares it between them, the conclusion will be that for one of the
then its values should be comparable, and no concern should therefore exist. In fact, they are comparable, as they are computed through the same method. But what does such information reveal in practical terms? What are the taxation policies and measures that can be employed or altered by a government taking this information into account? Is it correct to assume that the country with the larger tax-to-GDP ratio is the country in which taxpayers take a more significant burden for paying taxes?
Tax burden measured as the tax-to-GDP ratio measures how much of GDP has been redistributed through public budgets. It is a macroeconomic indicator. It therefore is not indicative of the tax burden borne by entities at individual level, and should consequently only be interpreted as an approximate measure, taking into account its degree of simplification (Kotlan and Machová, 2012). Furthermore, a higher ratio can simply mean that the efficiency of a government in collecting taxes has been enhanced, and not necessarily that the tax burden, in its semantic sense of weight or load on taxpayers, has increased (Kotlan and Machová, 2012). One can conclude that the tax-to-GDP ratio bears a great deal of shortcomings.
Nevertheless, even where tax burden is not explicitly referred to, the ratio between public revenue and GDP is the variable that allows for the comparison between countries or states. It is the case in the study of Sobarzo (2004) and Bonatti (2007), for instance. Therefore, and considering everything that has been stated throughout about the approach to tax burden in previous studies, the tax-to-GDP ratio plays a pivotal role in taxation literature, and it would be careless to disregard it from further analysis.
Lastly, the literature does not regard tax burden exclusively as the mentioned ratio at country or state level. Frequently, the concept of tax burden is applied at entreprise-level, such as in Budrytė (2005) and Strelnik et al. (2015).
In addition, tax burden can be evaluated by type of economic activity, i.e., by whether taxation is imposed on labour, capital or consumption (Kotlan and Machová, 2012).
In this section, Frank’s and Bird’s indices will be explained, as they explore these questions and provide the literature with new outlooks on the approach, measurement, and assessment of both tax burden and tax effort.
Firstly, a theoretical approach will be made to the tax effort indices. Secondly, the indices will be calculated for 35 of the 36 OECD countries6. The results will be presented
separately and then compared between the indices. In addition, we will compute the tax-to-GDP ratio for the same countries, analyse it briefly, and compare it with the tax effort indices of Frank (1959) and Bird (1964).
4.1 Frank’s index
“Are taxes in this state higher than in that one?” (Frank, 1959: 179). This is the question Henry Frank presents in his 1959 article’s opening, and one to which the author presents two frequently used measures that aim at answering it: taxes per capita and taxes as a percentage of income. These measures are efficient in the comparison between countries’ tax collections only if there is a reasonable similarity between such countries population or income-wise, respectively (Frank, 1959). The author proposes another measure to compare tax burdens between countries, which we shall hereafter refer to as “Frank’s index”, an index of tax sacrifice that synthesises the two aforementioned measures (Frank, 1959). In his 1959 article, Frank computes this index for the states of the US.
With regards to per capita taxes as a measure of tax burden, which are computed “by dividing the total tax collection by the resident population”, Frank (1959) recognises that it is more appropriate than the use of total tax revenue because it is weighed by the size of the population. However, each resident has the same weight (one) in the computation of the population, regardless of their “age, condition or position in the economy”. Each person is considered to have the same ability to pay those taxes (Frank, 1959).
On the other hand, taxes as a per cent of income do not demonstrate how much effort was required to produce a certain amount of income. According to the author, if in a society it takes ten persons to produce as much as it takes fifteen persons in another, then paying any rate of that production is a higher burden for the members of that latter, poorer society (Frank, 1959). This concept of “equality of sacrifice” is the basis of the progressivity of income taxes (Frank, 1959).
Furthermore, “taxes do not come out of income and disappear from the economy to remain evermore in an Independent Treasury” (Frank, 1959: 181). Taxes are paid to the government by taxpayers and return to the income stream in the form of salaries and purchases of goods and services. Therefore, the denominator in the taxes-to-income ratio is created by the taxes that represent the numerator. What is unknown here is how much of those taxes returns to that income (Frank, 1959).
In order to understand the sacrifice concerned with the payment of taxes, it is advantageous to join the two measures together, by dividing the taxes as a per cent of personal income by per capita personal income. An important assumption is made here: that in two countries with similar taxes over income, the sacrifice made to pay the taxes will be lower for a resident of the country with the higher per capita personal income. Frank’s index (F) can be computed as follows7:
F = Taxes
Personal Income ÷
Personal Income Population
According to Frank (1959), this index of tax sacrifice is more effective for international comparison than taxes per capita or taxes as a percentage of income because the first does not take into account how the income varies between the countries, and the second does not consider the effort made by different members of an economy to pay the taxes.
4.2 Bird’s index
Like Frank in 1959, Bird (1964) questions the significance of the ratio between the taxes and national income (T/Y, where T represents the tax revenue and Y the national income measure), as he considers that “it indicates nothing about the effort required to produce the income used as the denominator of the ratio” (Bird, 1964: 303).
7 The indices formulas are as presented by the authors in their original articles (Frank,
1959; Bird, 1964). Some alterations were made in our calculations for mere simplification of presentation and comparison of results. Such modifications do not affect the conclusions.
Bird (1964)’s goal was to compute what he called the “tax sacrifice”, a “modified version” of Frank (1959)’s index, in an attempt to measure the state tax burden and allow it to be comparable between countries. The major difference between Bird’s (hereafter Bird’s index) and Frank’s indices is the use of disposable income rather than just the measure of income used by Frank. The reasoning here is the avoidance of “certain absurd results which could otherwise arise in extreme cases” (Bird, 1964: 306).
Despite recognising the flaws of his measure, Bird asserts that its results are more meaningful than the traditionally-adopted ratio T/Y. Furthermore, he claims it is a “more useful calculation” to measure sacrifice. Bird’s index (B) can be computed as follows:
B = %& Taxes
Disposable income × 100' ÷
Gross Domestic Product
Population ( × 100
Bird (1964) also addresses the concepts of tax capacity and tax effort. He considers that the proposed index is not a measure of tax capacity or tax effort, but of tax sacrifice (or tax burden), i.e., “the relative importance to the citizens of the resources given up to government in countries at different levels of income” (Bird, 1964: 303). Tax capacity is the capacity to provide revenue for any public expenditure, and it depends mainly on per capita income. The author adds that the willingness and the will for public services is crucial to calculate the “feasible” capacity. Tax effort is a measurement of the extent to which a government actually takes advantage of said capacity. He asserts that both measures are useful for making policy appraisals, but difficult to be quantified in a meaningful way. He acknowledges that the latter is one of the flaws of the tax sacrifice index he proposes, but that it is a favourable addition to the other two.
For the purpose of simplification, the formula in (1) can be written as:
B = %& T
Y-T × 100' ÷ Y
P( × 100
In this formula, T are taxes, Y is income, Y-T is the disposable income, and P is the population.
Bird (1964) addresses two types of weaknesses concerning his index: conceptual and (2)
the index using the current government revenues, which includes both tax and non-tax revenue. The inclusion of non-tax revenue in the variable is not significant in the ranking of countries8 (Bird, 1964).
Furthermore, Bird (1964) alludes to the fact that, although the data used should be for all levels of government, for subordinate levels of government the figures are only approximate in most countries.
Bird (1964) adds that the figures for both income (Y) and population (P) are subject to biases and errors. Nevertheless, according to the author, one can assume that the level of accuracy of such figures is positively correlated with per capita income (Y/P), which itself incorporates all the biases, therefore approximating the biased figures to the real ones.
Finally, Bird (1964) addresses the measure of income used. For the first ratio in the index formula, the author uses Gross National Product (GNP), while for the second, Gross Domestic Product (GDP) is used.
According to the OECD, GDP is “the expenditure on final goods and services minus imports: final consumption expenditures, gross capital formation, and exports less imports”. The difference between GDP and GNP is “the net of incomes paid to and received from foreigners” (Bird, 1964: 307). GDP includes, according to the OECD, “the production by the resident institutional units of the country” (hence the “domestic” denomination). Taking this into consideration, Bird’s index formula can be rewritten as follows:
B = %& T
GNP-T × 100' ÷ GDP
P ( × 100
For the sake of presenting his results, Bird (1964) groups the countries into three groups: Latin America (Costa Rica, El Salvador, Guatemala, Honduras, Mexico, Panama, Argentina, Brazil, Colombia, Ecuador and Peru), North America (Canada and USA), and Europe (Austria, Belgium, Denmark, Finland, France, West Germany, Greece, Ireland,
8Bird (1964: 305) does, however, recognize the “problems of comparability” that derive from this
simplification, given that in some countries the “extrabudgetary revenues” like social security funds and exchange profits are highly relevant (e.g. Brazil).
Italy, Netherlands, Norway, Spain, Sweden, Switzerland and the UK). Latin America and Latin America constitute one region, and Europe another.
Bird’s (1964) first important conclusion from his calculations is that, in general, poorer countries in both regions, i.e., the countries with the lower per capita GBP, “try” harder, or, in other words, have a greater “tax sacrifice”. The conclusion is the same when considering each region separately. In addition, the results obtained by comparing countries using the traditional tax-to-GDP ratio and the ones obtained with Bird’s tax sacrifice index are very different from one another. The author concludes by stating that despite the flaws his index carries, it outdoes the simple taxes-to-national-income ratio in that it “gives us some idea of how much a little more funneled through the government would “hurt” in some relative sense” (Bird, 1964: 308).
4.3 Computing the indices for OECD countries
4.3.1 Formulas and variables
In this section, some modifications to the indices are presented and explained. In addition, the variables used for the determination of the indices are listed.
4.3.1.1 Frank’s index
The formula for Frank’s index (F) is:
F = Taxes
Personal Income ÷
Personal Income Population
In order to get more easily comparable and interpretable results, the formula shall be altered by simply multiplying it by 100 twice, similar to what Bird did with his modified version of the index:
F = %& Taxes Personal Income × 100' ÷ Personal Income Population ( × 100 (5) (6)
F = %& T
GNI × 100' ÷ GNI
P ( × 100
Where T is the total revenue in taxes, GNI is Gross National Income, and P is the population of the country. Because GNI/P represents per capita GNI, the final formula is:
F = %& T
GNI × 100' ÷ GNI pc( × 100
Taxes are total tax revenues in USD9, GNI is measured in USD at current prices10, and
per capita GNI is measure in USD at current prices11.
4.3.1.2 Bird’s index
The formula for Bird’s index as presented before does not require further modifications:
B = %& T
GNP-T × 100' ÷ GDP
P ( × 100
The only remark is the fact that in the 1993 SNA12, Gross National Product (GNP) was
renamed Gross National Income (GNI), and therefore the data used will be concerning the latter. GDP/P is GDP per capita, which shall be written as GDP pc. We will therefore apply the following modified formula:
B = %& T
GNI-T × 100' ÷ GDP pc( × 100
Per capita GDP is measured in USD at current prices13. The remaining variables are
measured as established for Frank’s index.
9OECD (2018), Tax revenue (indicator).
10From the World Bank database – World Development Indicators. 11From the World Bank database – World Development Indicators.
12The 1993 SNA is a set of standard rules for the measurement macroeconomic indicators.
13 From the World Bank database – World Development Indicators.
(7)
(8)
(9)
4.3.2 Results and analysis
Both Frank’s index (F) and Bird’s index (B) were computed for 35 of the 36 countries that are part of the OECD as of today. The tax effort indices were calculated for each country in each year from 2000 until 2015. Lithuania was excluded from this analysis due to the lack of data for tax revenue, which is needed to compute both indices.
Firstly, we shall analyse each index separately. This will be done through the interpretation of graphs that compile the most important information about each index. Secondly, comparisons between the two indices will be made, again interpreting some illustrative graphs that allow for that.
By virtue of the importance of the simple tax-to-GDP ratio in the literature, an analysis of this indicator is also included. It is compared with Frank’s and Bird’s tax effort indices.
Because a comprehensive, case-by-case discussion and analysis of the indices is outside of the scope of this dissertation, only some particular and distinct cases will be referred to. The author proposes such a more in-depth study for future work.
4.3.2.1 Frank’s index
The computed index values14 for Frank’s index are presented in table 9 of the annexes.
The evolution of Frank’s index for each OECD country from 2000 to 2015 is represented in graph 7:
Graph 7: Evolution of Frank’s index (2000-2015) 15
The evolution of Frank’s index throughout this period is not regular. It shows peaks of ups and downs throughout the years.
From a general standpoint, Frank’s index has decreased over time. This idea is clearer from graph 9, which represents the evolution of the average of the index throughout the years, and which we shall analyse further into this sub-section.
15 A country name abbreviation glossary is available in the annexes of this dissertation.
0.0000 0.1000 0.2000 0.3000 0.4000 0.5000 0.6000 0.7000 0.8000 0.9000 1.0000 2000 2001 2002 2003 2004 2005 2006 2007 2008 2009 2010 2011 2012 2013 2014 2015
AUS AUT BEL CAN CHE CHL CZE
DEU DNK ESP EST FIN FRA GBR
GRC HUN IRL ISL ISR ITA JPN
KOR LUX LVA MEX NLD NOR NZL
Some occurrences in Frank’s index, which are illustrated by graph 7, are noteworthy. Turkey, Hungary, Estonia, Poland, Latvia, the Slovak Republic, the Czech Republic, and Chile were above every country with a significant difference from 2000 until 2008. From then on, and despite the ups and downs of the index, the evolution of Frank’s index for each country did not suffer from a great increase or decrease.
For the sake of making a more just comparison between the countries’ averages, the average for each country’s index was calculated from 2000 to 2015, which were the years for which information was available for all countries:
Graph 8: Frank’s index: average per country (2000-2015)
In terms of averages, Chile (0.0419), the US (0.0544), and Norway (0.0619) have the lowest indices from 2000 until 2015. Hungary is the country with the highest average during this period, with an average index of 0.4226. Poland scores 0.3969, which makes it the country with the second highest average, and Turkey is 3rd on the rank (0.3585).
To sum up, every country’s index decreased over time, although there is a clear growth of the index in every country between 2014 and 2015. There is a tendency for convergence of the countries’ tax effort indices. Graph 9, in which the average index and
0.0000 0.1000 0.2000 0.3000 0.4000 0.5000 CHE USA NORJPN LUX GBR NLDIRL AUS CANISL DNKDEU SWEAUT FIN BEL FRA KORITA ISR ESP NZL MEXGRC PRT SVN CHLCZE SVK LVAEST TURPOL HUN
its standard deviation for each year is represented, is a modest attempt to demonstrate this overall decrease of Frank’s index from 2000 until 2015:
Graph 9: Frank’s index: average and standard deviation per year (2000-2015)
The average index does not, evidently, inform us of how each country’s index behaved through time. Although the average is not a perfect measure, it does provide us with an overall picture of the indices’ trends.
Graph 9 depicts the overall decline of the average of Frank’s index, although, again, there is an increase between 2014 and 2015. From this we can conclude that overall, as calculated by Frank’s formula, the tax effort in the OECD has been declining.
One final conclusion is that the standard deviation of the index for each year also decreased, despite the slight increase between 2014 and 2015. Therefore, there was fiscal convergence amongst the OECD countries.
4.3.2.2 Bird’s index
The computed index values are presented in table 11 of the annexes. There is an overall tendency for the reduction of the tax effort as measured by Bird’ index:
0.0000 0.0500 0.1000 0.1500 0.2000 0.2500 0.3000 2000 2001 2002 2003 2004 2005 2006 2007 2008 2009 2010 2011 2012 2013 2014 2015 Average SD
Graph 10: Evolution of Bird’s index (2000-2015)
Similar to what was done with Frank’s index, the average of Bird’s index was computed for each country:
0.0000 0.2000 0.4000 0.6000 0.8000 1.0000 1.2000 1.4000 1.6000 2000 2001 2002 2003 2004 2005 2006 2007 2008 2009 2010 2011 2012 2013 2014 2015
AUS AUT BEL CAN CHE CHL CZE
DEU DNK ESP EST FIN FRA GBR
GRC HUN IRL ISL ISR ITA JPN
KOR LUX LVA MEX NLD NOR NZL
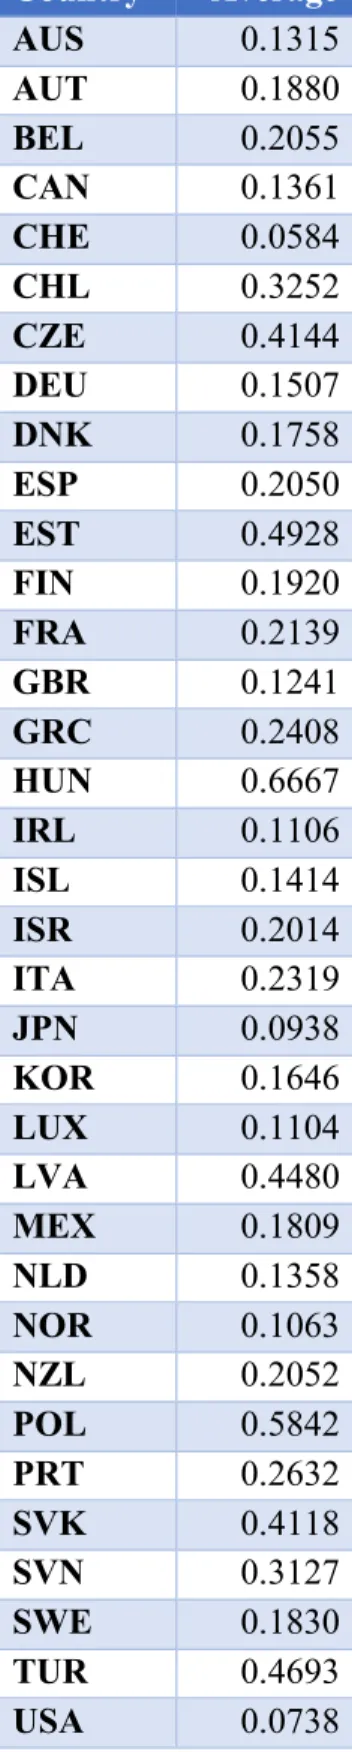
Graph 11: Bird’s index: average per country (2000-2015)
Similar to what was concluded for Frank’s index, for the period from 2000 until 2015, Hungary is the country with the highest average of Bird’s index (0.6667), and Poland is 2nd again, with an average index of 0.5842. Interestingly, it is now Estonia who is placed 3rd on the rank (0.4928).
Chile and the US are the countries with the lowest average index (0.0584 and 0.0738 respectively), alike Frank’s index average for the same period. Japan is the country with
0.0000 0.1000 0.2000 0.3000 0.4000 0.5000 0.6000 0.7000 0.8000 CHE USA JPN NOR LUXIRL GBRAUS NLD CANISL DEU KOR DNK MEXSWE AUTFIN ISR ESP NZLBEL FRAITA GRCPRT SVN CHL SVKCZE LVATUR EST POL HUN
The average for Bird’s index throughout the years was also computed, and it is represented in graph 12:
Graph 12: Bird’s index: Average and standard deviation per year
The author reiterates the limitations associated with the average. The aim is simply to provide the literature with a general idea of how Bird’ index behaved throughout the period from 2000 until 2015. A thorough analysis of each country’s tax index evolution is not the objective of this dissertation, but is certainly proposed for future work.
Graph 12 depicts the overall decline of the average of Bird’s index. Alike what was asserted with regards to Frank’s index, Bird’s index increased between 2014 and 2015. As calculated by Bird’s formula, the tax effort in the OECD has been declining from an overall perspective.
From graph 12, it is also clear that there was fiscal convergence amongst the OECD countries, as overall the standard deviation of the index decreased throughout the years.
4.3.2.3 Comparing the two indices
This sub-section is dedicated to a short comparison between the two indices and the results obtained. This is more easily done by comparing the averages of the two indices in each year, which are represented in graph 13:
0.0000 0.0500 0.1000 0.1500 0.2000 0.2500 0.3000 0.3500 0.4000 0.4500 2000 2001 2002 2003 2004 2005 2006 2007 2008 2009 2010 2011 2012 2013 2014 2015 Average SD
Graph 13: Averages of index F and index B from 2000 to 2015
The first obvious conclusion is that Bird’s index is always higher than Frank’s index. This is because of the way each formula is established: while Frank’s index is calculated using income, Bird’s index gives emphasis to the disposable income, which is smaller than the income measure. Therefore, the first part of Bird’s formula is always higher than Frank’s.
A second relevant point is that the movement of the averages is almost parallel. This is not surprising, given that the way that the formulas are built is very similar. Bird’s index formula is a modification of Frank’s.
4.3 The tax-to-GDP ratio
The third measure to be analysed is the traditional tax as a percentage of income measure. Particularly, the tax-to-GDP ratio, due to how frequently used it is in literature. The results for each country in each year are presented in graph 14:
0.0000 0.0500 0.1000 0.1500 0.2000 0.2500 0.3000 0.3500 0.4000 0.4500 2000 2001 2002 2003 2004 2005 2006 2007 2008 2009 2010 2011 2012 2013 2014 2015 B F
Graph 14: Evolution of the tax-to-GDP ratio (2000-2015)
Clearly, the evolution of the tax-to-GDP ratio is different from Frank’s and Bird’s indices’: overall, the tax-to-GDP ratio is growing. This is corroborated by graph 16, which will be analysed after a short analysis of the average ratios for each country, presented in graph 15: 0.0000 0.1000 0.2000 0.3000 0.4000 0.5000 0.6000 2000 2001 2002 2003 2004 2005 2006 2007 2008 2009 2010 2011 2012 2013 2014 2015
AUS AUT BEL CAN CHE CHL
CZE DEU DNK ESP EST FIN
FRA GBR GRC HUN IRL ISL
ISR ITA JPN KOR LUX LVA
MEX NLD NOR NZL POL PRT
Graph 15: Average tax-to-GDP ratio per country (2000-2015)
Denmark (0.4444), Sweden (0.4303), and Belgium (0.4191) score the highest tax-to-GDP ratios. In contrast, Mexico (0.1280), Chile (0.1880), and South Korea (0.2230) have the lowest ratios.
Finally, the overall evolution of the tax-to-GDP ratio is of increase. There is a clear peak
0.0000 0.1000 0.2000 0.3000 0.4000 0.5000 MEX CHL KOR TUR USA LVA CHE IRL JPN AUS SVK EST NZL POL PRT ISR CAN CZE GBR ESP GRC DEU SVN ISL NLD LUX HUN NOR AUT ITA FIN FRA BEL SWE DNK
Graph 16: Tax-to-GDP ratio: average and standard deviation per year
The ratio decreased from 2008 until 2010 (0.2961), and has been increasing since, although not constantly, as there were periods of peaks and lows throughout.
Unlike what has been observed for Frank’s and Bird’s indices, fiscal convergence as measured by the standard deviation of the tax-to-GDP ratio cannot be concluded. Although there was convergence between 2014 and 2015, the standard deviation proves to be somewhat constant, without a clear growth or decrease movement.
4.4 The World Tax Index (WTI)
The last part of section 4 is to briefly address an alternative metric for the measurement of tax burden - the WTI - which would be more efficient than the traditional tax-to-GDP ratio, and which was proposed by Kotlán and Machová (2012). The authors call “tax quota” to this ratio in order to distinguish it from the concept of tax burden as a more general term, which can be evaluated employing several measures.
In summary, the WTI incorporates several sub-indices which regard distinct groups of taxes, according to the OECD classification: CIT (Corporate Income Tax), PIT (Personal Income Tax), VAT (Value Added Tax), PRO (Individual Property Taxes), and OTC (Other Taxes on Consumption). These 5 indices are then divided into sub-components (Kotlán and Machová, 2012). Apart from taxes which are particular to certain
0.0000 0.0500 0.1000 0.1500 0.2000 0.2500 0.3000 0.3500 0.4000 0.4500 2000 2001 2002 2003 2004 2005 2006 2007 2008 2009 2010 2011 2012 2013 2014 2015 Average SD
economies, whose inclusion would impede inter-country comparison, the WTI gathers all OECD country taxes.
One feature which positively distinguishes the WTI from the simple tax-to-GDP ratio is that its scope is expanded to other aspects which can affect the tax burden, namely tax progression, administrative difficulties of the taxpayer’s tax collection, tax credits, and incentives (Kotlán and Machová, 2012; Machová and Kotlán, 2013).
Furthermore, the WTI combines hard data with soft data, which is derived from the Qualified Expert Opinion (QEO), obtained through OECD countries’ tax specialists’ answers to a comprehensive questionnaire survey. These tax specialists scored (as a percentage) the sub-components within each sub-index according to how each contributed to the tax burden in their country. The average percentage for each sub-component in each country is assigned to that sub-sub-component in that country. These specialists also scored the sub-indices, although now through the pair-wise comparisons method (Kotlán and Machová, 2012). Machová and Kotlán (2013) performed some modifications to the computation of the WTI. The authors redefined the structures of three of the five sub-indices. The list of sub-indices and sub-components according to Machová and Kotlán (2013) is presented in Figure 1 of the annexes.
The formula to compute the WTI is
WTI = , &SkQEOk 100'
5
k=1
where Sk represents the value of the k-th sub-index, and QEOk is the weight determined
by the result of the QEO for the k-th sub-index. A higher WTI means a higher tax burden.
Kotlán and Machová (2012) compare the WTI with the “tax quota”, i.e., the tax-to-GDP ratio for OECD countries. On one hand, they conclude that the ratio can be a satisfying indicator of tax burden for personal income tax (which includes social security contributions), and VAT. On the other hand, however, its quality can be questionable in the case of corporate taxes.
5. DETERMINANTS OF TAX BURDEN AND TAX EFFORT
“What affects revenues (measured as the ratio tax revenues to GDP) has been the subject of a long debate.” (Gupta, 2007). In this section, a literature review is performed in order to gather the previously used determinants and the rational underlying their application on previous studies.
Morrissey et al. (2016) mention that the typical approach in the literature is “to model the revenue to GDP ratio as determined by variables chosen to proxy for the tax base and structure of the economy”. Kiser and Karceski (2017) focused their study on the “structural and institutional determinants of tax revenue”. Amongst such indicators, the most frequent for the study of tax revenue performance in developing countries are “agriculture and industry value added as a percentage of GDP”, “openness to international trade”, and “GDP per capita” (Morrissey et al., 2016: 1690). To these, the authors add others mentioned in the literature, namely “aid, demographic features such as urbanisation, or indicators of governance and institutions” (Morrissey et al., 2016: 1690).
As Streimikiene et al. (2018) point out, previous literature on the determinants of tax revenue distinguish between the effects in developed and developing countries.
Gupta (2007) establishes an important and clear distinction that groups the determinants of revenue. The author distinguishes between structural, institutional and policy variables. This grouping is used in the list below with a merely structural purpose. An important point here is that some of the variables included in these groups were not considered by the author himself, and are therefore inserted by the author of this dissertation where believed to be appropriate.
Other authors, such as Mahdavi (2008), have empirically tested the determinants of tax revenue according to revenue composition.
5.1 Structural variables
5.1.1 Level of development
Per capita GDP is a proxy for the overall economic development of a country (Gupta, 2007; Bird et al., 2008; Morissey et al., 2016). The level of development is expected to be positively related to the level of tax collection of a country for two main reasons. On the one hand, a higher level of development increases the demand for public expenditure (Bird et al., 2008; Fenochietto and Pessino, 2010). On the other hand, it is related to a higher capacity of payment and, therefore, tax collection (Bird et al., 2008). Lastly, countries of higher income, i.e. with a higher per capita GDP, are likely to have a better tax administration (Agbeyegbe et al., 2006). Per capita GDP is the most commonly found determinant of tax revenue in literature. Fenochietto and Pessino (2010) empirically prove the positive and significant relationship between the two variables.
5.1.2 Sectoral composition of output
Certain economic sectors are easier to tax than others (Gupta, 2007). In general, the agricultural sector is one that is difficult to tax (Agbeyegbe et al., 2006; Gupta, 2007).
There are two reasons for this. One the one hand, for political reasons, in some countries agricultural products are free of consumption taxes, i.e., VAT. On the other hand, the agricultural sector is fairly difficult to supervise, especially if dominated by small producers (Fenochietto and Pessino, 2010). “A large industrial sector is easier to monitor and tax, and a larger share of manufacturing in GDP captures economic development and a larger formal (taxable) sector” (Morissey et al., 2016: 1961). The ease (or difficulty) of tax collection can be represented by the value added of the agriculture sector as percent of GDP (Fenochietto and Pessino, 2010). The amount of collected tax will be lower the larger the share of agriculture in GDP and the smaller the share of industry or manufacturing.
5.1.3 Degree of trade and financial openness of an economy
Trade taxes are fairly easy to collect (Morissey et al., 2016). The sum of exports and imports as a percentage of GDP is commonly used as the variable that reflects the degree of openness of an economy (Gupta, 2007; Fenochietto and Pessino, 2010; Morissey et al., 2016). A greater volume of exports and imports will result in higher revenue (Morissey et al., 2016).
In their study of tax performance, Morissey et al. (2016) include the “shares of agricultural, mining, manufacturing and fuel exports to GDP along with imports to GDP rather than a single combined measure of trade to GDP.”
Agbeyegbe et al. (2006) test the impact of trade liberalisation on tax revenue in Sub-Saharan countries with two measures: one is the share of external trade in GDP, and the other is the collected tariff, i.e., the ratio between import duties and the value of imports.
5.1.4 External indebtedness
External indebtedness is another variable that can affect revenue levels (Gupta, 2007). The reasoning is as follows: in order to service their debt, countries may choose to decrease their import levels, hence lowering the import taxes; in alternative, they can increase tariffs over imports (or other taxes) aiming at generating a primary budget surplus which will finance the debt.
5.1.5 Foreign aid
Gupta (2007) considers foreign aid as a possible determinant of revenue collection levels. The variable used by the author is the ratio between foreign aid and GDP.