Mestre em Química
New devices to monitor oxidative stress
biomarkers in point-of-care: a new tool
for cancer prevention
Dissertação para obtenção do Grau de Doutor em
Nanotecnologias e Nanociências
Orientador: Maria Goreti Sales, Professor Adjunto,
Instituto Superior de Engenharia do Porto, Instituto
Politécnico do Porto
Co-orientador: Elvira Maria Correia Fortunato, Professor
Catedrático, Faculdade de Ciências e Tecnologia,
Universidade NOVA de Lisboa
Júri:
Presidente: Prof. Doutor Rodrigo Ferrão de Paiva Martins Arguentes: Prof. Doutor Arben Merkoçi
Prof. Doutor Carlos Manuel de Melo Pereira Vogais: Prof. Doutor Rodrigo Ferrão de Paiva Martins Prof. Doutor Francisco Miguel Gama
Prof. Doutor Hugo Manuel Brito Águas Prof. Doutora Maria Goreti Ferreira Sales
Prof. Doutor Bruno Costa-Silva
Gabriela Ferreira de Vasconcelos Martins
Mestre em Química
New devices to monitor oxidative stress
biomarkers in point-of-care: a new tool
for cancer prevention
Dissertação para obtenção do Grau de Doutor em
Nanotecnologias e Nanociências
Orientador: Maria Goreti Sales, Professor Adjunto,
Instituto Superior de Engenharia do Porto, Instituto
Politécnico do Porto
Co-orientador: Elvira Maria Correia Fortunato, Professor
Catedrático, Faculdade de Ciências e Tecnologia,
Universidade NOVA de Lisboa
iii
New devices to monitor oxidative stress biomarkers in point-of-care: a new tool for cancer prevention
Copyright: Gabriela Ferreira de Vasconcelos Martins FCT/UNL e UNL
v
A
cknowledgments
Like someone great said one day "Above all, do not fear difficult moments, the best comes from them..." (Dra. Rita Levi-Montalcini). This project and thesis is the outcome not only of my individual work, but also it is the reflection of all the important people that surrounded me and to whom I would like to thank.
Firstly, I want to acknowledge my supervisors, Prof. Goreti Sales and Prof. Elvira Fortunato for giving me the opportunity to develop this work, under their close guidance. They are both role
models in science, and life, that had inspired me each day to never give up, searching with imagination a solution to every problem. To Prof. Goreti I deeply thank the daily encouragement, the trust in my choices, the scientific advices in our discussions and the constant enthusiasm that she always bring to our "science talks". I thank to Prof. Elvira sharing her scientific knowledge, rising important questions in our meetings, that in most cases ended with great achievements in our work. Also, I want to acknowledge Prof. Elvira the opportunity to develop scientific work in the CENIMAT facilities, whereas it was possible to explore and investigate extra scientific approaches. Thank you to both for the support, confidence and supervision along this work.
To Fundação para a Ciência e Tecnologia (FCT), the financial support that enabled the development of this scientific work.
To all my colleagues in the BioMark that, in some way, contributed to this work; specially, Ana Patrícia for our enthusiastic "electro-talks", Helena Gomes for her advices and good sense, Liliana Truta, Felismina Moreira, Alexandra Santos, Carolina Hora and Mariana Carneiro for their patience, support and kindness and all others colleagues.
To Ana Marques, from FCT-UNL, the help in the lab and the hospitality during my stay in Lisbon, as well as the scientific comments along my thesis work.
To Dr. Rui Fernandes (TEM analysis, I3S) and Dr. Rui Rocha (SEM analysis, CEMUP), all the constructive discussions related with the analysis of my samples.
To all my friends that have been my support, being always present and available when I need it (because science is full of ups and downs). To Esther Garcia, Ana Torres and Sofia Caridade thank you for continuing this crazy wonderful friendship that, despite the long distance, remains always with me.
vi
grandmother Emília for being an inspiration in every day of my life, she is the true role model in my beliefs and she will always continue to be...
To my dear husband Ricarte, for truly believing in me when I couldn't, for being my constant support and most enthusiastic admirer. I wouldn't be here without you!
vii
R
esumo
Segundo as recentes estatísticas da Organização Mundial de Saúde (OMS), a segunda principal causa de morte a nível mundial é o cancro, com uma taxa de mortes em 2018 de 9.6 milhões de pessoas. Em particular, as doenças relacionadas com cancro já originaram 26% do número total de mortes ocorridas em Portugal em 2016. Vários mecanismos estão associados ao desenvolvimento de cancro, sendo que o stress oxidativo parece exercer um papel crucial na origem desta doença. Assim, a deteção precoce de múltiplos biomarcadores do stress oxidativo constitui uma ferramenta essencial na prevenção do cancro e também na seleção das terapias mais eficazes.
A procura de metodologias para análise específica de biomarcadores do stress oxidativo in loco continua a ser um desafio para a investigação biomédica. Até ao momento, os métodos analíticos utilizados para o diagnóstico de cancro, que incluem um exame patológico, são insuficientes para deteção precoce da progressão do tumor. Assim, para ultrapassar esta necessidade, o principal objetivo deste projeto é desenvolver métodos de deteção rápidos, simples e precisos para quantificação de biomarcadores de stress oxidativo, com metodologias de recolha não-invasivas, de modo a conduzir a um diagnóstico rápido e de confiança numa fase inicial da doença.
Para este efeito, esta tese apresenta o fabrico de biomateriais com propriedades sensoriais integradas em substratos condutores inovadores, para deteção in loco de biomarcadores de stress oxidativo. De modo a obter processos de reconhecimento bioquímico de elevada seletividade e especificidade, foi utilizada uma tecnologia de impressão molecular, que permite criar locais artificiais de reconhecimento. No decorrer da fabricação das plataformas transdutoras eletroquímicas, o papel foi usado como material de suporte alternativo aos materiais convencionais geralmente incorporados nos sistemas de elétrodos.
Em suma, espera-se que os resultados deste plano possam contribuir, no futuro, para o desenvolvimento e aplicação de plataformas de multi-analitos para rápida e simultânea deteção de biomarcadores do stress oxidativo num contexto local.
Termos-chave: Biosensor eletroquímico; Polímero de impressão molecular; Biomarcador do
ix
A
bstract
According to the most recent World Health Organization (WHO) data, cancer is the second leading cause of death worldwide, accounting for 9.6 million deaths in 2018. In particular, cancer diseases have caused 26% of the total deaths in Portugal in 2016. Among the complex mechanisms associated to cancer development, Oxidative Stress (OS) seems to play an important role at the origin of the disease. Thus, early diagnosis of multiple OS biomarkers may be a fundamental tool in cancer prevention and in more efficient therapeutic strategies.
Despite the development and the research efforts that are being made, accurate and early detection methods for cancer are still lacking. The demand for specific OS biomarker assays carried out in wide screening programs in point-of-care (POC) is undoubtedly a difficult but potentially useful challenge for biomedical research and health. So far, current methods for cancer diagnosis based upon pathological examination alone are insufficient for detecting early tumour progression.
Thus, to overcome this need, the present project aims the development of quick, simple and accurate detection of selected OS biomarkers, collected using minimally invasive methods, in order to allow rapid and reliable diagnosis at early stages of the disease. Under this scope, the design of sensitive biosensing materials integrated with novel conductive substrates for POC screening of OS biomarkers will be presented. In order to achieve a specific and highly selective bio-chemical recognition process, molecular imprinting strategy was used to create the artificial recognition sites. During the fabrication of electrochemical transduction platforms, paper was introduced as a novel alternative to the conventional support materials usually incorporated in electrode systems.
Overall, it is expected that the outcome of this plan will contribute, in the future, to the development and application of a multi-analyte platform for simultaneous fast screening of cancer biomarkers in POC context.
Keywords: Electrochemical biosensor; Molecular imprinting polymer; Oxidative stress
xi
Table of Contents
1 FRAMEWORK ... 1
1.1 MOTIVATION ... 1
1.2 OBJECTIVES ... 2
1.3 THESISOUTLINE ... 2
1.4 LISTOFPUBLICATIONS ... 4
1.4.1 Papers published in international scientific journals ... 4
1.4.2 Communications presented in national and international scientific conferences .... 4
2 INTRODUCTION ... 7
2.1 OXIDATIVE STRESS ... 7
2.1.1 Biomarkers of Oxidative Stress ... 10
2.1.1.1 8-Hydroxy-2'-deoxyguanosine ... 12
2.1.1.2 3-Nitrotyrosine ... 13
2.1.1.3 Malondialdeyde and Hydroxynonenal ... 15
2.2 BIOSENSORS ... 16
2.2.1 Recognition Element... 17
2.2.2 Signal Transduction ... 17
2.3 ELECTROCHEMICAL BIOSENSORS ... 19
2.3.1 Voltammetry ... 20
2.3.2 Cyclic Voltammetry ... 20
2.3.3 Square Wave Voltammetry ... 22
2.3.4 Differential Pulse Voltammetry ... 22
2.3.5 Electrochemical Impedance Spectroscopy... 23
2.3.6 Electrode size, materials and supports ... 26
2.4 MOLECULARIMPRINTINGPOLYMER ... 33
2.5 NANOMATERIALS ... 38
3 8-HYDROXY-2'-DEOXYGUANOSINE BIOMARKER DETECTION DOWN TO PICOMOLAR LEVEL ON A PLASTIC ANTIBODY FILM ... 43
3.1 INTRODUCTION ... 44
3.2 EXPERIMENTALSECTION ... 45
3.2.1 Reagents and Materials ... 45
3.2.2 Apparatus ... 45
3.2.3 Gold electrode cleaning ... 45
xii
3.2.5 Electrochemical assays ... 46
3.2.6 Surface analysis ... 47
3.2.7 Preparation and characterization of the FITC-labeled surfaces ... 47
3.2.8 Selectivity studies and analysis in urine samples ... 47
3.3 RESULTSANDDISCUSSION ... 48
3.3.1 Optimization of experimental variables... 48
3.3.2 Preparation and electrical follow-up of MIP sensor ... 50
3.3.3 Characterization of the modified surfaces ... 53
3.3.4 Performance of MIP sensor ... 55
3.3.4.1 Calibration curve ... 55
3.3.4.2 Selectivity studies ... 56
3.3.4.3 Analysis of spiked human urine samples ... 57
3.4 CONCLUSIONS ... 58
4 PAPER-BASED SENSING DEVICE FOR ELECTROCHEMICAL DETECTION OF OXIDATIVE STRESS BIOMARKER 8-HYDROXY-2'-DEOXYGUANOSINE IN POINT-OF-CARE ... 61
4.1 INTRODUCTION ... 62
4.2 EXPERIMENTALSECTION ... 63
4.2.1 Reagents and Materials ... 63
4.2.2 Apparatus ... 63
4.2.3 Fabrication and characterization of the paper-based sensor ... 64
4.2.4 Electrochemical assays ... 64
4.3 RESULTSANDDISCUSSION ... 65
4.3.1 Electrochemical behaviour of 8-OHdG ... 65
4.3.2 DPV analysis of 8-OHdG on paper-modified electrodes ... 66
4.3.3 Characterization of the paper-modified electrodes ... 67
4.3.4 Optimization of DPV experimental conditions ... 68
4.3.5 Analytical applications ... 70
4.3.5.1 Calibration curve ... 70
4.3.5.2 Selectivity ... 71
4.3.5.3 Serum samples ... 73
4.4 CONCLUSIONS ... 75
5 NOVEL WAX-PRINTED PAPER-BASED DEVICE FOR A DIRECT ELECTROCHEMICAL DETECTION OF 3-NITROTYROSINE ... 77
5.1 INTRODUCTION ... 78
5.2 EXPERIMENTALSECTION ... 79
xiii
5.2.2 Fabrication of paper-based SPE ... 80
5.2.3 Electrochemical assay ... 81
5.2.4 Surface characterization of the paper-based SPEs ... 81
5.2.5 Detection of 3-Nitrotyrosine onto the paper-based SPE ... 81
5.2.6 Selectivity assay ... 81
5.3 RESULTSANDDISCUSSION ... 82
5.3.1 Electrochemical performance of the paper-based SPEs... 82
5.3.2 Morphological characterization of the paper-based SPEs ... 85
5.3.3 Direct detection of 3-Nitrotyrosine ... 86
5.3.4 Calibration and interference assay ... 87
5.4 CONCLUSIONS ... 89
6 ELECTROCHEMICAL PAPER-BASED BIOSENSOR FOR LABEL-FREE DETECTION OF 3-NITROTYROSINE IN HUMAN URINE SAMPLES USING MOLECULAR IMPRINTED POLYMER ... 91
6.1 INTRODUCTION ... 92
6.2 EXPERIMENTALSECTION ... 94
6.2.1 Reagents and Materials ... 94
6.2.2 Apparatus ... 94
6.2.3 Electrochemical assay ... 94
6.2.4 Assembly of the imprinted-based biosensor ... 95
6.2.5 Analysis of urine samples ... 95
6.3 DISCUSSIONANDRESULTS ... 96
6.3.1 Electrochemical study ... 96
6.3.2 Electropolymerization of phenol - MIP versus NIP ... 98
6.3.3 Optimization of experimental conditions during MIP assembly ... 100
6.3.3.1 Effect of scan-rate and number of electropolymerization cycles ... 100
6.3.3.2 Effect of monomer concentration ... 101
6.3.3.3 Effect of imprinted 3-NT concentration ... 102
6.3.4 Characterization of the modified paper-electrodes ... 104
6.3.5 Performance of the imprinted-sensor ... 105
6.3.5.1 Calibration curve ... 105
6.3.5.2 Urine samples ... 106
6.4 CONCLUSIONS ... 107
7 SYNTHESIS AND CHARACTERIZATION OF CORE-SHELL MAGNETIC NANOPARTICLES ... 109
7.1 INTRODUCTION ... 109
xiv
7.2.1 Reagents and Materials ... 111
7.2.2 Apparatus ... 112
7.2.3 Synthesis of core-shell nanoparticles ... 112
7.2.3.1 Fabrication of iron oxide nanoparticles ... 112
7.2.3.2 Preparation of iron oxide-silica core-shell ... 113
7.2.4 Characterization of the modified nanoparticles ... 113
7.2.5 Electrochemical assays ... 114
7.3 DISCUSSIONANDRESULTS ... 114
7.3.1 Synthesis of iron oxide nanoparticles ... 114
7.3.2 Fabrication of iron oxide-silica core-shell ... 115
7.3.2.1 Optimization of the sol-gel process ... 119
7.3.2.2 Functionalization with APTES ... 121
7.3.3 Characterization of the modified-nanoparticles ... 123
7.4 CONCLUSIONS ... 124
xv
List of Figures
Figure 2.1: Adapted scheme highlighting the various activators and inhibitors factors associated to the production of ROS ... ...8 Figure 2.2: Adapted scheme showing the proposed mechanisms for ROS production and their contribution to the aging process... ... ...9
Figure 2.3: Proposed mechanism for the formation of 8-OHdG... ... ...12
Figure 2.4: Adapted scheme showing the different pathways responsible for the nitration of tyrosine residues of proteins and consequent production of 3-NT... .. ...14
Figure 2.5: Chemical structure of A) malondialdehyde and B) 4-hydroxynonenal... ... ....15
Figure 2.6: Schematic representation illustrating the main constitution, function and practical application of a biosensor device... ... ...16 Figure 2.7: Schematic representation with the main features of the different types of sensor transduction... ... ...18
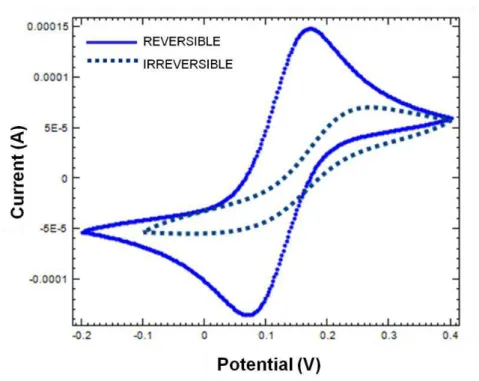
Figure 2.8: Cyclic voltammogram obtained for a reversible system... ... ...21
Figure 2.9: Comparison of typical voltammograms obtained for reversible and irreversible systems... .... ...22
Figure 2.10: Nyquist plot for an electrochemical Faradaic system... .. ...25
Figure 2.11: A typical example of a Bode plotting... ... ...25
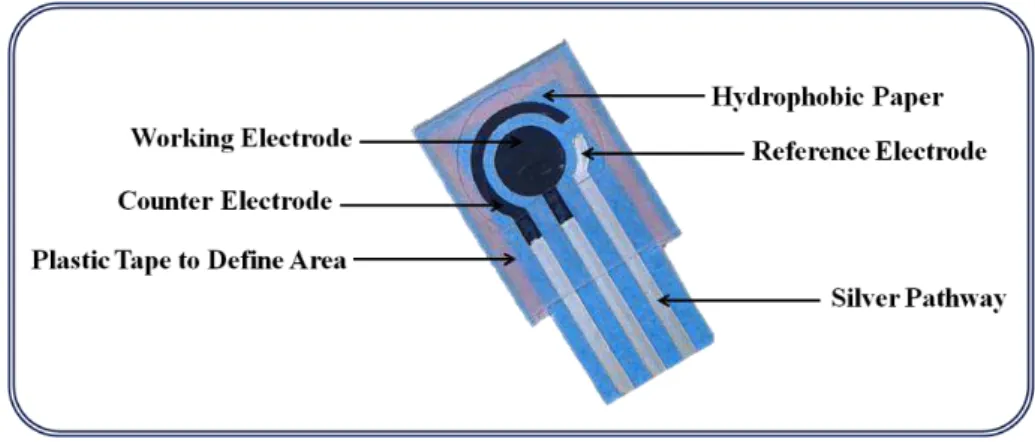
Figure 2.12: Main constituents of a paper-based assembly with three-integrated electrodes. . .27
Figure 2.13: Examples of the wide diversity of SPEs commercially available... ... ...27
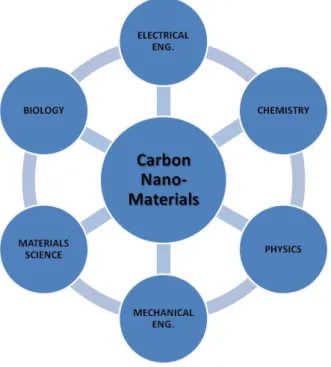
Figure 2.14: Representation of the different field of applications concerning carbon-based materials... ... ...28
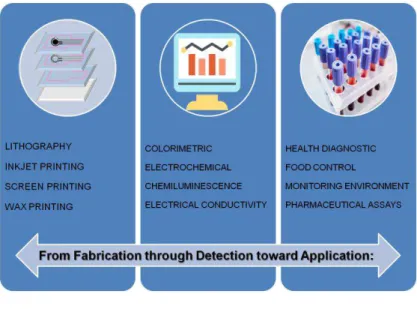
Figure 2.15: Adapted scheme with the various routes available to pattern paper-based sensors, with respective main advantages and limitations... ... ...30
Figure 2.16: Schematic representation about techniques of nanofabrication, detection methodologies and practical applications of paper sensors... ... ...31 Figure 2.17: Some examples of different paper-based biosensors for A) virus, B) bacteria, C) cell and D) multi-protein detection... ... ...32
Figure 2.18: Schematic representation of the synthesis of molecularly imprinted polymers.. . ..33
Figure 2.19: Graphical representation for publications under the issue A) "MIP" (molecularly-imprinted polymer* or molecular imprinting or MIP*) and B) "biosensor+MIP" (biosensor* and molecularly-imprinted polymer* or molecular imprinting or MIP*), from April 2018 ISI Web of Knowledge... ...34 Figure 2.20: Proposed mechanism of phenol electro-oxidation... ... ...37
xvi
Figure 2.23: Different nanostructures of carbon A) graphene, B) SWCNTs and C) MWCNTs...39
Figure 2.24: Different immobilization methodologies used during the fabrication of a sensor device: A) sandwich immunoassay approach; B) MIP-based approach; C) labeled nanoparticle approach and D) ink-based approach... .... ...40 Figure 2.25: Adapted graphic concerning the different routes used for the synthesis of iron oxide magnetic nanoparticles... ... ...41
Figure 2.26: Silica applications conjugated with magnetic nanoparticles as nanoplatforms... .. 42
Figure 3.1: Schematic representation of the assembly of the gold-modified imprinted sensor... ... ...44
Figure 3.2: A) Cyclic voltammograms of a gold-modified electrode immersed in 0.01 M PBS aqueous solution containing different concentrations of monomer phenol (0.25, 0.5 and 1.25 mM), pH 7.4, scan rate 20 mVs-1; B) Charge variation during electropolymerization of phenol (3 cycles) obtained from MIPs with different ratios of template to monomer (1:3 and 1:1) and NIP in 0.01 M PBS... ... ...48
Figure 3.3: Calibration curves of 8-OHdG obtained for MIPs with different ratios of template/ monomer, 1:3 (closed gray circles) and 1:1 (open black circles)... ... ...49
Figure 3.4: Cyclic voltammograms concerning the electropolymerization of 0.25 mM phenol in 0.01 M PBS, pH 7.4, (scan rate 20 mVs-1, 3 cycles) at gold-modified electrodes with (dashed line) and without (straight line) the template molecule 8-OHdG... ... ...50 Figure 3.5: A) CV of the gold electrode (green line), thiol-modified gold electrode (red line), NIP and MIP after electropolymerization (blue and grey line, respectively) and after template removal (black lines, on the right side), measured in aqueous solution containing 5 mM [Fe(CN)6]3-/4- in 0.01 M PBS pH 7.4 and B) EIS of (a) gold electrode, (b) thiol-modified gold electrode, NIP (c) before and (d) after removal, MIP (e) before and (f) after removal, in aqueous solution containing 5 mM [Fe(CN)6]3-/4- in 0.01 M PBS... ... ...51
Figure 3.6: A) FTIR-ATR spectra of gold, thiol-modified gold, NIP and MIP electrodes; B) RAMAN spectra of gold, thiol-modified gold, NIP and MIP electrodes and C) typical image from RAMAN, measured at 50x magnification, of the gold-screen printed electrodes (Au-SPE).... . ..53 Figure 3.7: A) SEM micrographs of NIP and MIP electrodes and B) confocal imaging of FITC antibody against 8-OHdG attached to NIP and MIP surfaces... ...54
xvii
Figure 3.9: EIS measurement of MIP-based sensor recorded after incubation in 5 pg/mL 8-OHdG solution, alone and in the presence of uric acid (0.4 g/mL), citric acid (0.5 g/mL) and glucose (0.1 mg/mL). All solutions were prepared freshly on PBS pH 7.4... ... ...57 Figure 3.10: Calibration curve of 8-OHdG in a urine sample. Rct relative corresponds to the normalized value of charge transfer resistance against the PBS measurement for each spiked level and S is the slope of the experimental calibration, obtained from three independent measurements... ... ...57
Figure 4.1: Schematic representation of the oxidation process of 8-OHdG molecule followed on a conductive carbon paper substrate: 1) hydrophobic white paper as substrate; 2) conductive carbon-coated paper; 3) in-situ electrochemical measurement... ... ...63 Figure 4.2: Successive cyclic voltammograms performed in PBS at pH 7.4 with 8-OHdG molecule at different scan rates. Inset: calibration plot of the 8-OHdG oxidation peak current versus scan rate... ... ...65
Figure 4.3: DPV detection of 200 ng/mL 8-OHdG solution in PBS pH 7.4 on different graphite-based electrodes prepared after the incorporation of various nanomaterials dispersed in the graphite ink, such as, PEDOT nanoparticles, CNTMW and CNTMW-COOH... ... ...66
Figure 4.4: RAMAN spectra of the different graphite-based electrodes prepared after the incorporation of nanomaterials dispersed in the graphite ink, such as, A1) PEDOT nanoparticles, A2) Graphite, A3) CNTMW and A4) COOH-CNTMW, with the calculated ID/IG ratios and B) RAMAN spectra with the magnification of the D (Disorder) band, in full-scale mode... ... ...67
Figure 4.5: Successive differential pulse voltammograms of 0.1 mg/mL 8-OHdG in PBS pH 7.4 recorded (A) without any application of conditioning potential and (B) with a conditioning potential of +0.20V applied before each measurement... ... ...68
Figure 4.6: Dependence of the sensor response on the (A) pre-accumulation potential and (B) time of accumulation during 8-OHdG oxidation in PBS pH 7.4... ... ...69 Figure 4.7: (A) Cleaning effect (after CV in PBS pH 7.4) on the 8-OHdG detection by DPV signal and (B) sensor regeneration after voltammetric cycles performed in PBS pH 7.4... .. ...69
Figure 4.8: Differential pulse voltammograms recorded for 8-OHdG solutions prepared in different buffer solutions, with different pH values... ... ...70
Figure 4.9: A) Differential pulse voltammograms for different concentrations of 8-OHdG prepared in PBS pH 7.4 and (B) calibration plot of the concentration of 8-OHdG... ... ...71
Figure 4.10: (A) DPV recordings for individual solutions with concentrations of 0.1 mM of 8-OHdG, ascorbic acid and uric acid in PBS at pH of 7.4; (B) DPV recording of a mixture with all of the 3 compounds, in the same concentrations... ... ...72 Figure 4.11: Differential pulse voltammograms for serum samples diluted 1:10 in different buffers, such as, (A) Tris pH 9.1, (B) PBS pH 7.4 and (C) Acetate pH 5.1, doped with 1 ug/mL of 8-OHdG... ... ...73
xviii
Figure 5.1: Schematic illustration of the different steps related to the sensor device, namely, A) the electrochemical apparatus for biological samples assessment; B) photo and morphological characterization of the paper-based electrodes; and C) the assembly of the electrochemical sensing platform... ... ...79
Figure 5.2: Detailed scheme of the fabrication of the paper-based electrodes... .... ...80
Figure 5.3: Cyclic voltammograms for 5 mM [Fe(CN)6]4-/3- redox couple in A) 0.1 M KCl solution and B) PBS pH 7.4, at different scan-rates; Plot representation of both the anodic and cathodic peak currents versus the square-root of the scan-rate for 5 mM [Fe(CN)6]4-/3- redox couple in C) 0.1 M KCl solution and D) PBS pH 7.4... ... ...82
Figure 5.4: A) Cyclic voltammograms for 5 mM [Fe(CN)6]4-/3- redox couple in 0.1 M KCl, at different scan-rates and B) plot representation of both the anodic and cathodic peak currents versus the square-root of the scan-rate for 5 mM [Fe(CN)6]4-/3- redox couple... ... ...83
Figure 5.5: Effect of the different redox probes upon the electrochemical response. A) plots the
peak potential separation (ΔE) versus the scan-rate and B) the anodic and cathodic peak current ratio (IpA/IpC) versus the scan-rate for [Fe(CN)6]4-/3- and [Ru(NH3)6]3+ probes at 5 mM concentration in 0.1 M KCl; Plots of current peak versus the probe concentration for C) [Fe(CN)6]4-/3- and D) [Ru(NH3)6]3+, at a scan-rate of 50 mV/s, in 0.1 M KCl and PBS pH 7.4. .. ..84
Figure 5.6: SEM images of the A) and B) WE carbon-surface at different magnifications and C) and D) Cross-section imaging of the carbon-layer at different magnifications... ... ...85
Figure 5.7: CV recordings over the potential range -1 V to +1 V in 0.1 M phosphate buffer with (colour line) and without (dashed line) 1 mM of 3-NT, at a scan-rate of 50 mV/s, and in the inset figure the chemical structure of 3-NT... ... ...86 Figure 5.8: SWV response of 1 mg/mL 3-NT A) in different supporting electrolyte solutions and B1) in 0.1 M phosphate buffer solution at different pH values ranging from 6 to 8. B2) Plot of the potential value of the SWV versus the pH obtained in 1 mg/mL 3-NT in phosphate buffer solution... ... ...87
Figure 5.9: A) SWV recordings of 3-NT at different concentrations, in 0.1 M phosphate buffer at 7.4 pH (inset figure is for lower concentrations) and B) calibration curve of 3-NT, with and without the application of an accumulation potential... ... ...88 Figure 5.10: A) Electrochemical response of tyrosine, ascorbic acid, uric acid and creatinine over the studied potential range and B) the curves of calibration for 3-NT only and in the
presence of 10 μM of tyrosine... ... ...88
Figure 6.1: Illustration of the sensor film fabrication by molecular imprinting for recognition of 3-nitrotyrosine... ... ...93
xix
Figure 6.3: Cyclic voltammograms of NIP and MIP electrodes during electrochemical polymerization of phenol for the A) 1st and B) 5th scan cycle, in KCl solution (0.1 M, pH 5.9). EIS obtained for each step of the construction for C) NIP and D) MIP electrodes, in 5 mM solution of K3[Fe(CN)6] and K4[Fe(CN)6] prepared in phosphate buffer solution (0.1 M, pH 6.0)... ....98
Figure 6.4: A) EIS measurements obtained before and after template removal, at different scan-rates: A) 15 mV/s; B) 50 mV/s and C) 150 mV/s and, with different number of cycles: D) 2; E) 5 and F) 10, recorded during phenol electropolymerization... ... ...101
Figure 6.5: EIS obtained for NIP and MIP sensors at two different phenol concentrations, A) 1 mM and B) 0.25 mM. C) 3-Nitrotyrosine response for both MIP electrodes, obtained from DPV measurements... ... ...102
Figure 6.6: A) Charge variation during phenol electropolymerization (5 cycles) obtained from MIPs with different concentrations of template molecule; B) EIS obtained for the MIPS with different concentrations of template molecule; DPV measurements after contact with different concentrations of 3-NT for MIPs with C) 0.05 mM, D) 0.25 mM and E) 0.50 mM concentration of template molecule; F) Scheme related to the distribution of imprinting sites... ... ...103
Figure 6.7: A) Raman spectra of clean carbon-based electrode, NIP and MIP-modified surfaces. SEM images of B) NIP and C) MIP materials... ... ...104
Figure 6.8: Calibration curves corresponding to the response of A) MIP and B) NIP sensors against the concentration of 3-nitrotyrosine. The inset figure is related to the DPV recordings for each standard concentration... ... ...105
Figure 6.9: Calibration curves corresponding to the response of A) MIP and B) NIP sensors against the concentration of 3-nitrotyrosine, performed in 1:10 diluted human urine samples... ... ...106
Figure 7.1: Schematic representation of the different steps related to the synthesis of the core-shell magnetic nanoparticles... ... ...110
Figure 7.2: Synthesis reaction of the iron-oxide nanoparticles via co-precipitation method... ... ...113 Figure 7.3: (A-B) TEM images of iron-oxide nanoparticles at different magnifications and C) image of the MNPs under the application of a magnetic field... ... ...115 Figure 7.4: Square-wave voltammograms concerning the two (individual) redox probes ruthenium and NADH, in PBS at a pH 7.4, applied in a clean, bare carbon-SPE... .... ...115
Figure 7.5: SEM images of the MNPs A) non-modified, modified with B) SiO2 with NADH and C) SiO2 with ruthenium; EDS spectra of the MNPs D) non-modified, modified with E) SiO2 with NADH and F) SiO2 with ruthenium... ... ...117
xx
Figure 7.7: TEM (A) and SEM (B) imaging of the silica-based nanoparticles prepared (1) without ethanol and SDS, (2) without ethanol and with SDS and (3) with ethanol and SDS... ... ...119
Figure 7.8: Square wave voltammograms of the silica-based MNPs synthesized with increasing concentration of TEOS A) 0.1 mL, B) 0.5 mL and C) 1.0 mL; TEM images of the silica-based MNPs obtained with different TEOS concentration D)0.1 mL, E) 0.5 mL and F) 1.0 mL ... 120 Figure 7.9: Schematic illustration of the fabrication procedure of the core-shell magnetic nanoparticles and their application as electrochemical probes ... 121
Figure 7.10: Square wave voltammograms of the developed silica-based MNPs at different stages of fabrication: A) TEOS with ruthenium, B) effect of a magnetic field on the previous MNPs and C) the effect of functionalization with APTES; D) Image of the electrochemical measurement of MNPs using a magneto ... 122
xxi
List of Tables
Table 2.1: Summary of the most relevant OS biomarkers and their main categories ... 11
Table 2.2: Comparison of paper as a substrate material with other traditional materials ... 31
Table 3.1: Comparison of the main characteristics of some reported assays used in the detection of 8-OHdG... ... ...59
Table 4.1: Comparison of different electrochemical sensors for determination of 8-OHdG.. . ....76
Table 6.1: Comparison of the different sensors for 3-nitrotyrosine detection in biological matrices... ... ...93
xxiii
List of Abbreviations
AFM Atomic force microscopy
APTES (3-Aminopropyl)triethoxysilane
ATR Attenuated total reflectance
C Capacitor
CE Counter/auxiliary electrode
CNTs Carbon nanotubes
CV Cyclic voltammetry
DMF Dimethylformamide
DNA Deoxyribonucleic acid
DPV Differential pulse voltammetry
EDS Energy dispersive X-ray spectroscopy
EIS Electrochemical impedance spectroscopy
ELISA Enzyme-linked immunosorbent assay
Fe2O3 Magnemite
α-Fe2O3 Hematite -Fe2O3 Maghemite
FET Field-effect transistor
FITC Fluorescein isothiocyanate
FRP Free radical polymerization
FTIR Fourier-transform infrared spectroscopy
GC-MS Gas chromatography mass spectrometry
4-HNE 4-Hydroxynonenal
H2O2 Hydrogen peroxide
HPLC High performance liquid chromatography
ISFET Ion-selective field-effect transistor
L Inductor
LC-MS Liquid chromatography–mass spectrometry
LOD Limit of detection
MB Methylene blue
MDA Malonaldehyde
MIP Molecularly imprinted polymer
MNP Magnetic nanoparticle
MRI Magnetic resonance imaging
MWNT Multi-walled nanotube
MWNT-COOH Multi-walled nanotube, carboxylic acid functionalized
xxiv
NMR Nuclear magnetic resonance
NO Nitric oxide
NO2 Nitronium group
3-NT 3-Nitrotyrosine
O2 Oxygen
O2
- Superoxide anion
O2
-. Superoxide radical
OH. Hydroxyl radical
8-OHdG 8-Hydroxy-2’-deoxyguanosine
8-OHG 8-Hydroxyguanosine
ONOO- Peroxynitrite
OS Oxidative stress
PBS Phosphate buffered saline
PEDOT Poly(3,4-ethylenedioxythiophene)
P3MT Poly (3-methylthiophene)
POC Point-of-care
PSA Prostate specific antigen
PVC Polyvinyl chloride
PVC-COOH Polyvinyl chloride, carboxylated
QCM Quartz crystal microbalance
R Resistor
RE Reference electrode
RNS Reactive nitrogen species
ROS Reactive oxygen species
RRS Resonance Raman spectroscopy
RSD Relative standard deviation
SDS Sodium dodecyl sulphate
SEM Scanning electron microscopy
SERS Surface-enhanced Raman spectroscopy
SiO2 Silicon dioxide
SnO2 Tin(IV) oxide
SPE Screen-printed electrode
SPR Surface plasmon resonance
SWNT Single-walled nanotube
SWV Square wave voltammetry
TBARS Thiobarbituric acid reactive substances
TGA Thermogravimetric analysis
TEM Transmission electron microscopy
TEOS Tetraethyl orthosilicate
xxv
WE Working electrode
WHO World Health Organization
Symbols
Cd Double-layer capacitance
E Applied potential
E0 Amplitude of the voltage signal at t = 0
Epa Anodic peak potential
Epc Cathodic peak potential
ΔEp Difference between the anodic and cathodic peak potentials
I Current
Ipa Anodic peak current
Ipc Cathodic peak current
n Number of electrons involved in the electrochemical reaction
t Time
Rct Charge-transfer resistance
RΩ Solution resistance
V Potential
Z Impedance of the system
ZW Warburg impedance
θ Phase shift
ʋ Scan-rate
1
CH
APTER
1
1
Framework
1.1 MOTIVATION
Currently, about 26% of Portuguese people died of cancer every year, according to the most recent World Health Organization (WHO) data (WHO, 2016). As a leading cause of death worldwide, the most common types of cancer death includes lung, liver, colorectal, stomach and breast. Although there are some well-identified risk factors, such as, tobacco smoking, alcohol consumption, obesity, among others, aging is another important factor to take in account for the development of cancer. So, as the way a person grows older, the incidence of cancer rises dramatically due to a danger combination of the risks for specific cancers with a less efficient cellular repair mechanism [1][2].
In this context, cancer mortality can be substantially reduced if cases are detected and treated early. However, despite all the research efforts that have been made in the last decades, screening programmes for quick, low-cost and in loco diagnostic are still lacking. So, the application of biochemical markers for the diagnosis and management of patient's status has been a growing approach in recent years, while developments in molecular biology lead to a continuous discovery of new circulating biomarkers. In parallel, molecular epidemiological studies have evidenced a link between oxidative stress (OS) and carcinogenesis. Indeed, OS-based biomarkers have been proven essential in revealing how OS may mediate toxicity induced by many known carcinogenic environmental agents [3]. Looking closer to the sub-products originated by OS, the most used and promising biomarkers found until now include 8-hydroxy-2’-deoxyguanosine (8-OHdG), 3-nitrotyrosine (3-NT), malonaldehyde (MDA) and 4-hydroxynonenal (4-HNE).
2
finely designed through specific interactions between the building blocks of a biocompatible matrix and the desired specific target [4], enabling in the end, a specific, simple, inexpensive biosensor device. Moreover, to accomplish a suitable performance regarding the selectivity and sensitivity parameters of the sensor device, suitable electrochemical platforms that include cellulose paper are designed and functionalized in order to fabricate facile point-of-care (POC) testing device.
1.2 OBJECTIVES
The study and development of biosensor devices and novel supporting materials have been the core-pieces of BioMark and CENIMAT research groups receiving this plan, including the detection of cancer and neurodegenerative diseases. Under this context, the main goals of this work are:
(1) Identification and selection of the OS biomarkers that are most relevant in cancer diseases; (2) Design and integration of a bioreceptor material, especially using molecular imprinting technology, directly assembled on an electrochemical sensing platform;
(3) Fabrication of low cost paper-based innovative conductive substrates to be fully-integrated as biosensing platforms;
(4) And ultimately, the fabrication of nanostructured electrochemical labels to be incorporated, in the future, in the development of a suitable multi-analyte platform for a simultaneous screening in POC of relevant OS biomarkers;
1.3 THESIS OUTLINE
This thesis is organized in eight chapters.
Firstly, Chapter 1 describes the motivation and the main objectives of this work, with a summary description of the structure of the thesis. The list of publications and communications (oral and poster) associated to this PhD thesis is also presented.
Chapter 2 provides some fundamental background regarding the design and principle of biosensor devices, emphasizing those with special relevance to the present project. A brief state-of-the-art applied to the selected biomarkers is also described. An overview of the most common used nanomaterials and their main applications is addressed herein.
3
quantification. This configuration was suitable is terms of analytical features and sample analysis feasibility, but it was not compatible with POC analysis.
In order to overcome the limitations of the conventional commercially-available electrodes,
Chapter 4, describes the design, fabrication and application of an innovative paper-based sensing device for assessing 8-OHdG. Under this scope, paper was employed as an environmental-friendly alternative to other electrode supports. Although the levels of detection were not comparable with the previous commercial approach, the proposed carbon-based electrochemical sensor hold special features, such as, the potential to be miniaturized into smaller portable size, being disposable and low-cost. Still, this configuration required however additional improvements in terms of production, as it was being produced solely by manual techniques, which hindered the reproducibility of the different electrodes.
Thus, more advanced techniques of microfabrication were introduced and, Chapter 5 focused on the production, characterization and application of a wax-printed paper-based device enabling the integration of the 3 electrode in the same platform for the direct assessment of NT biomarker. Besides the novelty of using a flexible paper-based printed electrode, herein 3-NT was chosen as the target molecule due to the known correlation between this product of protein oxidation and many acute and chronic diseases. Although it is the first paper-based electrochemical sensor to the detection of 3-NT molecule, the main limitation of this electrochemical sensing platform was that detection levels should be improved. This could be solved by employing a more favourable biorecognition approach.
In order to enhance both selectivity and sensitivity of the previous approach, a molecular imprinting technology for 3-NT is presented in Chapter 6. Herein, the incorporation of this strategy with the previous wax-printed paper-based electrode enabled to create specific sites of biorecognition towards the direct electrochemical detection of 3-NT molecule. In addition, the applicability of this biosensor was tested and validated through assays performed in urine samples.
4
material. Next, the redox probe also needed special tuning to ensure that its electrochemical signal was the only signal generated at its redox potential range.
Finally, Chapter 8 summarizes the main conclusions of this project and highlights potential applications for future research work.
1.4 LIST OF PUBLICATIONS
1.4.1 Papers published in international scientific journals
- Gabriela V. Martins, Ana C. Marques, Elvira Fortunato, M. Goreti F. Sales, "Electrochemical paper-based biosensor for label-free detection of 3-nitrotyrosine in human urine samples using molecular imprinted polymer", submitted.
- Gabriela V. Martins, Ana C. Marques, Elvira Fortunato, M. Goreti F. Sales, "Wax-printed paper-based device for direct electrochemical detection of 3-nitrotyrosine", Electrochimica Acta (2018), 284, 60-68.
- Gabriela V. Martins, Ana P. M. Tavares, Elvira Fortunato, M. Goreti F. Sales, "Paper-Based Sensing Device for Electrochemical Detection of Oxidative Stress Biomarker 8-Hydroxy-2′ -deoxyguanosine (8-OHdG) in Point-of-Care", Scientific Reports (2017), 7, 14878-14887.
- Gabriela V. Martins, Ana C. Marques, Elvira Fortunato, M. Goreti F. Sales, "8-hydroxy-2′ -deoxyguanosine (8-OHdG) biomarker detection down to picoMolar level on a plastic antibody film", Biosensors and Bioelectronics (2016), 86, 225-234.
1.4.2 Communications presented in national and international scientific
conferences
- Gabriela V. Martins, Stefano Chiussi, Goreti F. Sales, "Fabrication of flexible sensing devices for application in cancer diagnosis", IV Jornada Científica de IBEROS, Lugo (Spain), 11 July 2018 (oral presentation)
- Gabriela V. Martins, Ana C. Marques, Elvira Fortunato, M. Goreti F. Sales, "Electrochemical paper-based sensor integrated with molecular imprinting towards point-of-care diagnosis", 6th World Congress and Expo on Nanotechnology and Material Science, Valencia (Spain), 16-18 April 2018 (oral presentation).
5
- Gabriela V. Martins, Ana C. Marques, Elvira Fortunato, Helena R. Fernandes, M. Goreti F. Sales, "Carbon-based electrodes on paper substrates for biosensing purposes", iBEM - International Biomedical Engineering Meeting, Porto (Portugal), 21 March 2018 (poster
presentation).
- Gabriela V. Martins, Elvira Fortunato, Helena R. Fernandes, M. Goreti F. Sales, "Chip-on-Paper for sensoring 8-hydroxy-2'-deoxyguanosine (8-OHdG) oxidative stress biomarker in point-of-care", NanoPT2016 International Conference, Braga (Portugal), 16-19 February 2016 (oral
presentation).
- Gabriela V. Martins, Elvira Fortunato, Helena R. Fernandes, M. Goreti F. Sales, "A molecularly imprinted sensor for sensitive detection of 8-hydroxy-2'-deoxyguanosine (8-OHdG) oxidative stress biomarker", Graduate Student Symposium on Molecular Imprinting, Kent (UK), 27-28 August 2015 (poster presentation).
7
CHAPTER 2
2
Introduction
Along this chapter, a brief background concerning the fundamental principles of biosensors, the importance of biomarkers and their application in the context biomedical devices is presented and discussed. In addition, the integration of novel electrode systems based on modified-conductive substrates is also explored, as a potential alternative in the design of low-cost, efficient and portable sensor platforms.
2.1 OXIDATIVE STRESS
An overview of the current literature highlights the diversity and, in some cases, divergent theories proposed to understand the aging process and their mean features. Generally, "aging" can be defined as the sum of all the mechanisms that can, direct or indirectly, modify the functions of a living being, by preventing it from maintaining physiological balance and, consequently, causing the death of the organism. One of the first theories proposed by Harman in the 1950s was the so-called "free radical theory" claiming that the production of free radicals among aerobic organisms was determinant for causing cellular damage [5]. Under this scope, the definition of "free radicals" comprises atoms and molecules composed by unpaired and highly reactive electrons in their outer orbits, making these radicals quite unstable and highly reactive [6].
8
Figure 2.1: Adapted scheme highlighting the various activators and inhibitors factors associated to the
production of ROS [7].
Nowadays, some believe that our cell metabolism may be the source of our aging process. This "oxidative stress theory" claims that high levels of ROS are directly linked to damage of macromolecules, like proteins, nucleic acids and lipids [8]. Although low levels of ROS enable cell signal transduction and immune response, a high accumulation of ROS in the organism can overload cellular macromolecules under OS circumstances, resulting in some human diseases, specially from cardiovascular and neurodegenerative origin. These include, Alzheimer, Parkinson and Huntington disease, and also some cancer pathologies [9][10]. In this regard, recent studies have shown that high concentrations of biological markers originated from OS occurrence can be associated with degenerative diseases, hypertension, type II diabetes and several types of cancer [11]. In parallel with ROS, reactive nitrogen species (RNS) can also occur, enabling analogous nitrosative effects.
9
controlled and relevant enzymatic reactions that are important for cellular maintenance function [3]. In particular, the endogenous antioxidant defences include a network of antioxidant enzymes, such as, superoxide dismutase, gluthathione peroxidase and catalase that are widely distributed in the cells holding the ability to counterbalance oxidative stimulus. Thus, on a normal and continuous basis, all living organism are exposed to ROS, in aerobic environment conditions.
Figure 2.2: Adapted scheme showing the proposed mechanisms for ROS production and their
contribution to the aging process [14].
10
establishing and understanding early biological markers has been a growing need in order to accomplish novel therapeutic approaches and, consequently, reduce disease's mortality.
2.1.1 Biomarkers of Oxidative Stress
In order to assess OS in biological matrices, two different approaches can be employed:
(i) the increase of the levels of ROS can be directly quantified or;
(ii) the damage resulted from OS can be measured.
There are some studies related to the direct detection and quantification of ROS in complex biological samples but their main limitations resulted from their low stability, high reactivity and short half-lives [18][19]. Therefore, the most common way is not measuring the level of ROS themselves, but quantify the damage originated from these, since in terms of consequences to the organism, it is the outcome of OS that matters rather than the total amount of ROS originated. As mentioned before, the radical species that are formed during OS phenomena will interact directly with the biomolecules present in the cells, such as, proteins, phospholipids and nucleic acids, causing cell degeneration and death [13][20]. In parallel, specific molecules are produced and their quantification can be used as OS biomarkers for different biological matrices [21]. Overall, biomarkers of OS can be designated as molecules that are modified by suffering interactions with ROS in a biological microenvironment.
According to IUPAC recommendations, "biomarker" is defined as a parameter that can be used to identify a toxic effect in an individual organism and can be applied in extrapolation between species, or as an indicator signalling an event or condition in a biological system or sample and giving a measure of exposure, effect, or susceptibility [22]. Moreover, a successful biomarker should have (1) high specificity for the effect of interest; (2) high sensitivity; (3) reflection of an early effect; (4) easy and inexpensive analysis; (5) low background level of the biomarker in the body fluid of interest; (6) a well-established relationship between the response of the biomarker and exposure, and (7) a well-established relationship between the response of the biomarker and the induced damage [10].
11
disease-specific biomarkers, the diagnostic and prognostic could potentially be improved [24]. Thus, there is a need to work with a wide screen of possible biological markers. According to the origin of the biomolecule, OS biomarkers can be categorized in the following way (see Table 2.1):
Table 2.1: Summary of the most relevant OS biomarkers and their main categories.
MEASURE Biological Marker Reference
DNA oxidation
8-Hydroxy-2'-deoxyguanosine [25–30] 8-Hydroxyguanosine [31,32]
Lipid peroxidation
Malondialdehyde [33–38]
4-Hydroxynonenal [39,40]
8-Isoprostane [41]
Acrolein [42,43]
Protein oxidation
3-Nitrotyrosine [44–48]
3-Chlorotyrosine [49]
2-Pyrrolidone [50]
12
2.1.1.1 8-Hydroxy-2'-deoxyguanosine
The most commonly studied biological markers of DNA damage obtained through the attack of nucleotides bases are 8-OHdG and 8-hydroxyguanosine (8-OHG). Both 8-OHdG and 8-OHG products constitute oxidation derivates of guanine, one of the four main nucleobases found in the nucleic acids DNA and RNA. In this context, the formation of 8-OHdG through DNA hydroxylation is an important mechanism of oxygen-radical induced mutagenesis [51] and has already been acknowledged as a suitable biomarker of OS [52]. For now, high-performance liquid chromatography (HPLC) has been the popular choice for determining the levels of this kind of biomarker. In addition, 8-OHdG is the most widely used fingerprint of DNA damage, yielding strong implications along carcinogenesis evolution. Two possible mechanisms can be presented concerning the formation of 8-OHdG, as can be seen in Figure 2.3:
Figure 2.3: Adaptation of the proposed mechanism for the formation of 8-OHdG [16].
13
handling of biological samples. Specifically, biochemical methods such as ELISA can undertake cross-reactions, which can give false-negative or false-positive results. Furthermore, in most cases, GC-based methodologies operate with pre-treatment procedures prior to qualitative and quantitative analysis, originating long analysis periods. So, the development of fast, sensitive, easy-to-use and low cost approaches for 8-OHdG detection remains a continuous challenge. Over the last years, 8-OHdG biomolecule has been quantified in various biological samples, such as, urine [57], saliva [58], blood [29] and tissue [59]. It was found that the average levels of 8-OHdG in healthy humans is around 20 ng/mL, a value that increases when OS rises [60]. Bolner et al. have demonstrated that 8-OHdG levels in Parkinson's disease patients can be 2-3 times higher than in healthy controls [29]. Therefore, highly sensitive (nanomolar level) methodologies are needed for the assessment of 8-OHdG.
Although the detection of oxidative damage is being widely applied in human research and clinical applications, we still need more data about the main factors that determine the basal levels of these biomarkers among general population. Meanwhile, some interesting studies have suggested that some variables, such as, age, sex, alcohol consumption, level of education, the time season of sample collection and exposure to heavy metals are implicated with 8-OHdG quantification [61][62]. Thus, special care must be taken during data analysis because the occurrence of this type of OS biomarker can be monitored not only in body fluids and tissues of patients, but also in healthy people in physiological (and variable) concentrations.
2.1.1.2 3-Nitrotyrosine
Looking more closely into the OS pathway, one finds nitric oxide (NO), a reactive nitrogen specie that plays an important role in many pathologies, such as, ischemia-reperfusion, septic shock, neurodegenerative and chronic inflammatory diseases [63]. The overproduction of this nitric oxide can generate a cytotoxic molecule called peroxynitrite (ONOO˙) that is responsible for attacking protein residues [64]. As a consequence, 3-NT is obtained as a stable final-product and has been indicated as a biomarker for OS diagnosis [63]. Although peroxynitrite has been regularly correlated with increased oxidative reactions and DNA damage in inflamed tissues [63][64], it is not the only source of production of 3-NT marker.
14
resulting in free or protein-associated 3-NT. Consequently, the formation of nitro-aromatic compounds such as 3-NT can be directly associated with nitrosative stress [65].
Figure 2.4: Adapted scheme showing the different pathways responsible for the nitration of tyrosine
residues of proteins and consequent production of 3-NT [44].
Meanwhile, independently of the route of formation of 3-NT (via oxidation of nitric oxide, via peroxynitrite formation, etc.), the quantitative estimation of 3-NT, either free or bound to proteins, has been employed as a marker of oxidative damage in chronic inflammation [66], cardiovascular [67], atherosclerotic [68] and tobacco smoke–associated lung diseases [69]. Moreover, as mentioned before, the reactive species responsible for leading to tyrosine nitration usually have very short half-lives and, consequently, their direct measurement in biological environment is highly difficult.
15
effort has been made to implement portable, facile and rapid analysis of clinical samples in POC screening, as a way to improve the outcome of prevention and therapeutic approaches.
2.1.1.3 Malondialdeyde and Hydroxynonenal
As mentioned earlier, lipids are one of the major targets of oxidative attack and, the modification of these molecules can increase the risk of some degenerative diseases [77]. Once lipid peroxidation is initiated, the propagation of chain reactions will occur until a number of secondary, but highly damaging products are produced. Among others, the two most used end products of lipid peroxidation are MDA and 4-HNE (see Figure 2.5).
Figure 2.5: Chemical structure of A) malondialdehyde and B) 4-hydroxynonenal.
One of the most common techniques to quantify MDA levels is through the spectrophotometric thiobarbituric reactive specie (TBARS) assay. Although this methodology is quite easy and straightforward to be implemented, it is a non-specific test that can detect aldehydes other than MDA, with some artefact issues related to sample preparation [76]. Moreover, MDA data obtained through TBARS approach seem to be highly influenced by the smoking status, meaning that a wide variety of studies have found a significantly increased level of MDA in smokers in comparison with non‐smokers [76].
MDA quantification as an OS biomarker has been used in various biological matrices, such as, saliva [37], urine [77], plasma [78], tissue [38], among others. Another technique also employed to assess MDA levels in biological samples is by using an HPLC approach [79]. Therein, a comparative study against the traditional TBARS assay have showed an overestimation of the MDA concentration found during the TBARS methodology. Nevertheless, MDA is still employed as a known biomarker of OS in various pathologies despite its basal level variations among healthy people [80][81][82].
The occurrence of 4-HNE, a sub-product originated as a consequence of oxidative damage, has been commonly associated to onset of memory loss and cognitive dysfunction, characteristic
16
cell processes and can be accumulated during numerous oxidative stress-related diseases, such as neurodegenerative and cardiovascular diseases, metabolic syndrome and also cancer [84][85]. Some studies have performed 4-HNE quantification by using an enzyme immunoassay approach [39], fluorescence immunoassay [86] liquid chromatography tandem mass spectrometry (LC-MS) [87], TBARS assay [88]. Interestingly, 4-HNE should not be found in urine fluids so, urinary biomarkers for 4-HNE offer a non-invasive biomarker of lipid peroxidation and OS [89]. In sum, one still do not reach a consensus related to the cut-off of some individual biomarkers of OS, but their important relevance in the genesis of many diseases have been well established, making them ideal candidates to be investigated and applied in early screening.
2.2 BIOSENSORS
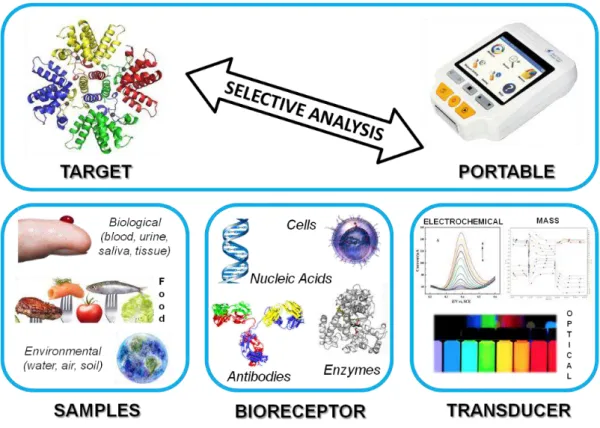
In the last decades, along with the digital and technological evolution, biosensor research has boosted in different direction areas, such as, healthcare, environment, food safety, industry, pharmacology, sportswear, regenerative medicine, among others [90][91][92][93][94]. In general, a biosensor is a chemical sensing device comprising a biologically derived recognition element coupled to a physicochemical transducer [95][96]. Mainly, biosensor devices can incorporate three distinct parts: (i) the biological component that recognizes the target molecule resulting in a signalling, (ii) the transducer platform and, finally, (iii) a reading equipment responsible for the data output (see Figure 2.6).
Figure 2.6: Schematic representation illustrating the main constitution, function and practical application of
17
2.2.1 Recognition Element
Molecular recognition has been the crucial phenomenon for biosensing, as it is responsible for distinguishing the target analyte from many other analytes present in a sample. Chemical sensors and biosensors may be classified according to their type of biorecognition element, being the most common ones, enzymes, nucleic acids, antibodies and living organisms, such as, cells and cell organelles [97]. Among these, one can also include two distinct classes of sensing elements, namely, the catalytic sensors that are related to enzymes, microorganisms and other biomimetic catalysts, and the affinity-based sensors that incorporate nucleic acids, antibodies and synthetic receptors [98].
Specifically, catalytic enzyme based-biosensors have become a prominent and widely chosen approach making use of specific reaction products that can be easily measurable, like, electrons and protons. The main advantages of using enzymes as recognition elements are also due to their high selectivity and sensitivity response. In contrast, these catalytic enzymatic sensors can be quite expensive and, in some cases, during immobilization process the catalytic activity may become compromised.
Meanwhile, affinity biosensors imply the immobilization of a specific recognition layer, such as, antibodies, nucleic acids and other affinity proteins, on the surface of the electrode in order to selectively recognize the target biomolecule. Thus, the application of antibodies as the recognition element is among the most popular choices for quick detection purposes, due to the high sensitivity and specificity of antibody-antigen interaction [99]. Despite this popularity, antibodies hold some limitations associated to their solubility and stability in aqueous conditions. Concerning typical nucleic acid-based sensors, the biorecognition process involves non-covalent interactions between the complementary bases. Moreover, as recognition elements, nucleic acids are chemically more stable in comparison with their counterparts antibodies. In parallel, the design of the sensor can also be differentiated by way the bio-receptor is immobilized that includes, physical sorption, covalent binding, immobilization in a polymer matrix, covalent binding and affinity immobilization [100]. This constitute an important and crucial step that will affect the performance and efficiency of the sensor device. Generally, the adsorption approach is the most simple and easiest to use, but the stability of the binding is limited. In contrast, covalent interactions hold a longer lifetime due to the stronger bond formation between the biomolecule and the solid support.
2.2.2 Signal Transduction
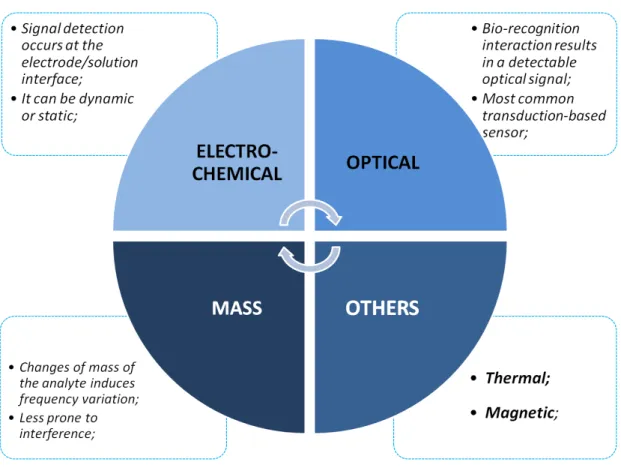
18
Figure 2.7: Schematic representation with the main features of the different types of sensor transduction.
Piezoelectric sensors are mass-sensitive sensors that, by tracking the resonant frequency of quartz crystal, are capable of measuring mass variations on the surface of the quartz electrode [109]. Optical sensors use light as the way of transducing and their main advantage is the quick and facile ability to give a visual response of the presence of a target molecule [110]. Among these sensors, a wide variety of optical contrasts, such as, absorption, fluorescence, Surface-Enhanced Raman Scattering (SERS) and refraction are used to detect optical changes. And finally, an electrochemical sensor holds an electrochemical transducer, measuring the variation of electrical current, potential, conductance or impedance at the interface of the electrode-sample [111]. In addition, other physical properties, such as, heat and magnetic field can be also employed for the conversion of the biological signal during the design of calorimetric and magnetic based-sensors, respectively.
In sum, the continuous development and application of these novel biosensor devices is the result of the combination of various advantages, such as [94]:
(i) high sensitivity and affinity toward their target molecules;
(ii) a suitable biological recognition that enables very selective sensing materials; (iii) good and proper limits of detection targeted to the analyte of interest;
19
So far, biosensing approach constitutes a suitable choice to be integrated in a POC device enabling special features, like, portability, automation and quick in-loco analysis. Among all transduction schemes, electrochemical-based biosensors are currently the most promising approach, where cost and minimized size are crucial needs.
2.3 ELECTROCHEMICAL BIOSENSORS
To overcome the growing need to develop biosensors with higher sensitivity and selectivity, electrochemical detection has been acknowledged as the more suitable strategy [112]. Electrochemical sensing technology has proven to be a valuable candidate for future clinical diagnosis, targeting relevant biomolecules, such as, proteins, nucleic acids and other small molecules [113]. Recently, an interesting review has compiled and discussed the development of versatile electrochemical genosensing of circulating biomarkers associated with cancer, neurodegenerative diseases and viral/ bacterial infections [114].
In general, an electrochemical sensor is designed to transform the effect of the physicochemical interaction between analyte and the electrode surface into an electrical signal [115]. It has been a very promising approach, due to its advantages, like high sensitivity, selectivity, a broad linear range of application and low cost instrumentation, enabling to overcome the most common challenges of analytical analysis.
Currently, a wide diversity of electrochemical studies have been conducted with biosensors, including the development of enzyme-based detection systems [116]; the establishment of microfluidic platform for therapeutic drug monitoring [117]; the construction of carbon-based paste for antioxidant estimation in wine samples [118]; the preparation of smart conductive films for cell culturing [119]; or the implementation of multiplexed immunoassay targeted for cancer biomarkers [120], among others. The use of electrochemical biosensors can also be performed under two different ways of transduction, direct or indirect, if a redox mediator is required or not to promote reversible electrochemical processes, enhancing the sensitivity and improving the detection limits. Moreover, according to the type of transducer, electrochemical techniques can be organized into conductometric, potentiometric or voltammetric biosensors or electrochemical impedance spectroscopy (EIS) biosensors [96].
20
In potentiometric biosensors the potential difference of an electrochemical cell is measure, in negligible (near-zero) current conditions. Usually, the transducer consists of an ion-selective permeable membrane, being pH electrodes the most common potentiometric devices among analytical laboratories.
EIS biosensors monitor the response of an electrochemical system (cell) to an applied potential, in which the frequency dependence may reveal underlying chemical processes. It indicates the resistive and capacitive properties of materials when a low amplitude sinusoidal perturbation is applied [121]. EIS is routinely used for the characterization of functionalized electrode surfaces, enabling sensitive measurements related to surface phenomena or variation of bulk properties. Overall, the electrochemically-based biosensors that are most explored in recent scientific papers for POC purposes are the ones of voltammetric and EIS nature. These are addressed next in more detail.
2.3.1 Voltammetry
As mentioned before, voltammetric based-biosensors allow tracking the concentration of the target-analyte as a function of current variation. Typically, voltammetry is characterized by the occurrence of an oxidation or/ and a reduction reaction of an electroactive(s) specie(s) at the electrode surface. Briefly, the current will change accordingly to the kinetic and mass transport involved during the reaction and diffusion of the species [122]. As an alternative to the conventional approaches, some biosensing devices targeted for OS biomarkers have been reported in the literature, relying mostly on electrochemical or QCM detection modes. For instance, such devices establish a direct reading of 8-OHdG, making use of its active redox properties on glassy carbon [27][123] or pyrolytic graphitic [124] supports, modified with highly conductive nanomaterials. In general, the detection capability of these devices varies from 1.1 to 97 nM, but some methods have shown severe interference from urine elements (mostly uric acid), solved therein by the addition of specific enzyme prior to the analysis stage. Furthermore, the strategy behind electrochemical biosensors designed as relevant tools of oxidative damage allows to track directly their oxidant activity and simultaneously, their biological and physicochemical features as clinically relevant biomolecules. Nevertheless, this kind of electrochemical technique is known to enable the detection of low concentrations of analyte and different voltammetric approaches can be used according to the way the potential is applied.
2.3.2 Cyclic Voltammetry
The most common voltammetric technique used for primary research concerning the electrochemical behaviour of biomolecules is cyclic voltammetry (CV). CV measurements allow to monitor current variation while the potential applied on the working electrode is reversibly varied, under a fixed scan-rate value. As can be seen in Figure 2.8, cyclic voltammogram is the graphical representation of the current response as a function of the applied potential and the most relevant parameters to evaluate a redox system include:
![Figure 2.1: Adapted scheme highlighting the various activators and inhibitors factors associated to the production of ROS [7]](https://thumb-eu.123doks.com/thumbv2/123dok_br/16694438.743761/36.892.193.702.106.491/figure-adapted-highlighting-various-activators-inhibitors-associated-production.webp)
![Figure 2.2: Adapted scheme showing the proposed mechanisms for ROS production and their contribution to the aging process [14]](https://thumb-eu.123doks.com/thumbv2/123dok_br/16694438.743761/37.892.153.729.313.741/figure-adapted-showing-proposed-mechanisms-production-contribution-process.webp)
![Figure 2.3: Adaptation of the proposed mechanism for the formation of 8-OHdG [16].](https://thumb-eu.123doks.com/thumbv2/123dok_br/16694438.743761/40.892.140.755.444.903/figure-adaptation-proposed-mechanism-formation-ohdg.webp)
![Figure 2.15: Adapted scheme with the various routes available to pattern paper-based sensors, with respective main advantages and limitations [165]](https://thumb-eu.123doks.com/thumbv2/123dok_br/16694438.743761/58.892.159.738.568.897/figure-adapted-various-available-pattern-respective-advantages-limitations.webp)