MASTER
ACCOUNTING, TAXATION AND
CORPORATE FINANCE
MASTER’S FINAL WORK
DISSERTATION
Earnings Management determinants in non-listed
European companies
Filipa Chedas de Sampaio e Sousa Pereira
i
MASTER
ACCOUNTING, TAXATION AND
CORPORATE FINANCE
MASTER’S FINAL WORK
DISSERTATION
Earnings Management determinants in non-listed
European companies
Filipa Chedas de Sampaio e Sousa Pereira
Adviser: Professor Cristina Gaio Silva
Co-adviser: Professor Rita Fuentes Henriques
ii
Abstract
The aim of this study is to determine accruals earnings management causes in
non-listed companies. Prior surveys mostly exploit earnings management characteristics
in stock-market corporations, thus the unlisted companies’ sector has been left out
of the academic research. However, it is known that unlisted companies are more
likely to engage in earnings management practices than listed firms (Burgstahler et
al., 2006). Throughout our investigation we’ve tried to find the main reasons behind
accruals earnings management in non-listed firms and if there were specific
motivations that explain why earnings management practices are more common in
this sector. Using data collected from the Amadeus database, the work focuses on
unlisted firms from fourteen European countries. Overall results provided evidence
that «leverage», «size», «growth» and «assets profitability» (Return on Assets -
ROA) are relevant to understand why companies engage in earnings management
(which is in line with previous studies).
Key words: Accruals, Accruals Quality, Earnings Management, Non-listed
iii
Resumo
O objetivo do presente estudo é descobrir quais os determinantes da gestão de
resultados por accruals nas empresas não cotadas europeias. Estudos anteriores
baseiam-se essencialmente nas características da gestão de resultados nas empresas
cotadas, ficando as empresas não cotadas postas, por vezes, de fora dos estudos
académicos. No entanto, reconhece-se que é mais provável as empresas não cotadas
incorrerem em práticas de gestão de resultados do que as empresas cotadas
(Burgstahler et al., 2006). Ao longo da nossa investigação, tentámos perceber as
principais razões por detrás da gestão de resultados por accruals nas empresas não
cotadas e se existem motivações específicas que expliquem porque é que a prática
de gestão de resultados é comum neste setor. Utilizando dados da Amadeus, o
trabalho foca-se em empresas não cotadas de 14 países Europeus. Os resultados
evidenciam que «leverage», «size», «growth» e «assets profitability» (Return on
Assets – ROA) são relevantes para entender porque é que as empresas incorrem em
gestão de resultados (o que está em linha com estudos anteriores).
Palavras-chave: Accruals, Accruals Quality, Earnings Management, Non-listed
Companies, Leverage, Size, Assets Profitability, Return on Assets (ROA),
iv
Thanks
To my adviser and co-adviser, Professors Cristina Gaio Silva and Rita Fuentes
Henriques, for all the support and prompt availability to assist me with their sound
advice, skilled comments and helpful input, all contributing to make this work
better.
To Professor João Andrade e Silva for the ready response whenever I need to
overcome statistic related subjects.
To my mother Luísa, my father Luís and my sister Maria Pedro for not letting me
down, giving me the emotional strength I needed throughout these past months. I’m
grateful to them all for pushing me to go further, challenging me to do more and
better and encouraging me not to give up in front of adversity. I particularly value
my mother´s prayers, and my father’s support with the wording, together with his
continuous contesting, which drove me further deep into the investigation and made
me better understand the problems at hand.
A very special and meaningful thanks to Professor Filomena Teodoro from the
Portuguese Naval Academy, who was undoubtedly crucial to enhance my
understanding about the academic model behind the statistics analysis. Professor
Filomena was always present, gave me a lot of confidence and made me believe. It
was Professor Filomena attitude and strong support that helped me overcome my
fears, motivated me to deepened my knowledge about the statistics tools, and to
discover how better to exploit it.
It is fair to say that without the support of Professor Filomena Teodoro the analysis
would be much more painful and complicated if not unattainable at all.
v
Table Index
Table I – sample composition by industry and auditor type ... 22
Table II – sample composition by country and auditor type ... 23
Table III – Variables Correlation Matrix ... 23
Table IV - Regression Model Results ... 25
Appendix Table I – Variables ... 35
Table II – Industry Dimension ... 35
Table III – Descriptive Statistics ... 36
vi
Index Figures
vii
Abbreviations
AQ – Accruals Quality
Big Four – the 4 biggest audit companies worldwide (PricewatherhouseCoopers,
Deloitte, KPMG and Ernest & Young)
CEO – Chief Executive Officer
EM – Earnings Management
EU – European Union
FASB – Financial Accounting Standard Board
GAAP – Generally Accepted Accounting Principles
IEM – Informative Earnings Management
IFRS – International Financial Reporting Standards
OEM – Opportunistic Earnings Management
SFAC – Statement of Financial Accounting Standard Board
Reg FD – Regulation Fair Disclosure
viii
Index
Abstract ... ii
Resumo ... iii
Thanks ... iv
Table Index ... v
Index Figures... vi
Abbreviations ... vii
Index ... viii
1. Introduction ... 1
2. Previous Literature and Research Development... 4
2.1. Earnings Management ...4
2.1.1. Earnings Management – definition ...4
2.1.2. Earnings Management - perspectives ...5
2.1.3. Differentiating earnings management from earnings expectations and fraud ...7
2.2. Motivations for Earnings Management ...9
2.3. Accrual-based earnings management ... 11
2.3.1. Definition of accrual based earnings management ... 11
2.3.2. Types of accruals ... 12
2.3.3. Constraints on accrual-based earnings management ... 13
2.4. Earnings management in non-listed firms ... 14
2.5. Research Question ... 15
3. Research Methodologies ... 16
3.1. Model and Variables... 20
3.2. Data and Sample ... 21
4. Results ... 23
4.1. Correlation Matrix ... 23
4.2. Descriptive Analysis and Evaluation of the Results ... 24
5. Conclusions ... 28
5.1. General overview of the study ... 28
5.2. Limitations ... 29
5.3. Further Research... 30
6. References ... 31
1
1.
Introduction
The economic crisis in the financial market together with the public disclosure of
related accounting scandals at the beginning of the 21st century (just like Enron in
2001 and Lehman Brothers in 2008) contributed to a breach of trust in
what earnings quality, corporate governance, and auditors quality and
independence was concerned. Levitt (1998) stated that “The rise of earnings
management and the decline of quality of earnings are a financial community
problem that urge for major actions to address financial reporting abuses, the
performance of auditors and the responsibility of audit committees”.
Because accounting earnings is the main source of companies’ specific information
and the core performance measure used by analysts and investors, is it important to
study how today’s society, especially the corporate community, addresses earnings
management (Francis, Schipper & Vincent, 2003).
Earnings quality is a multidimensional concept with different definitions and
different perspectives to evaluate. According to Dechow & Schrand (2004): “A high
quality earnings number is the one that accurately reflects the company’s current
operating performance; is a good indicator of the future operating performance; and
is a useful summary measure for assessing firm value”.Because managers’ self
-interests can collide with the principles of the organization, recent studies have
focused on the importance of earnings quality and earnings management.
Earnings management (EM) can be defined as the intentional misstatement of
earnings to have figures reflecting values that couldn’t be reach without
manipulation. If managers take decisions in order to change earnings not for
2
2003). Bearing in mind Dechow & Schrand definition it then becomes clear that
those who need to decide over of any kind of financial statement should be able to
clearly understand what earnings management is and why it takes place.
Most of existing studies focus more on stock-market companies and the quality of
their information release, and earnings management in non-listed firms has not been
very developed in previous surveys, though nowadays it is a matter that is receiving
more attention. That is why this study concentrates on non-listed firms. In fact,
recently it has been acknowledged that non-listed companies are more likely to
engage in earnings management than listed firms (Burgstahler, Hail & Leuz,
2006). Ball & Shivakumar (2005) also concluded that, when compared with listed
firms, non-listed companies can better accommodate losses but have lower quality
financial reports due to different market demand conditions. Several authors also
referred that reasons behind earnings management practices in non-listed firms and
stock-market companies’ might differ. Because we are dealing with people and will
be applying a mathematical (exact science) analysis to a problem that has a strong
behavioral variable (a subject normally addressed by the social sciences), it might be
interesting to compare the results achieved with other studies and take it a step
further, bringing together the «exact» and the «social» parts of what we see as a
rather complex issue. Therefore the study’s conclusions can trigger new lines of
investigation, something we understand as yet an additional motivation to proceed
with our investigation.
The investigation will thus try to respond to the key question, «what are the earnings
management determinants on non-listed European companies».
For the purpose of the analysis we particularly focused on «accruals-based earnings
3
assumptions allowed by accounting standards (Xu, Taylor & Dugan, 2007 and Li,
Rider & Moore, 2009). «Accrual-based earnings management techniques» can be
set to demonstrate financial reporting results that look more encouraging to a
potential investor, though used within a legal framework. This makes it a potential
tool that managers can get hold of to artificially boost their companies’ results. As
per the survey itself, we’ve used data from the Amadeus database. The information
gathered relates to 5757 companies from fourteen EU countries, encompassing 17
different industries and a 10 years period (2006 to 2015). To uncover if unlisted
companies actually use «accrual-based earnings management» (as proposed in our
research question.), we’ve used a regression conform to the Dechow & Dichev
(2002) model, adapting it to some of McNichols' (2002) variables.
Given the results reached through the descriptive statistics, we’ve concluded that
«leverage», «size», «growth», «Return on Assets (ROA)» and the «Big Four»
variables play a significant role on earnings management. In addition, the analysis
of the correlation matrix showed that larger companies, with higher assets
profitability, lesser sales variation and higher in debt, have worse earnings quality,
meaning it will probably incur more in earnings management practices.
The work itself was structured along five chapters. Chapter two – that follows this
introduction – is comprised by the Previous Literature and Research Development,
bridging all the literature that supported the study and the questions to be answered.
In the third chapter we explained the research methodologies, including
the detailed variables used in the study as well as the sample. In chapter four we
focused on the discussion of the results and on the analysis of the statistics. The fifth
chapter is where we presented our main conclusions, elaborated about
4
2.
Previous Literature and Research Development
As previously mentioned, earnings management and derived earnings quality have
been the subject for innumerous studies, especially because there is a framework
whereby it can be done legally. Notwithstanding, managers motivations can vary,
and the handling of companies’ results and outcomes becomes particularly sensitive
if/when managers’ self-interests collide with the stakeholders’ interests. Whilst
addressing those issues, different authors have used and put together a set of
definitions, rules practices and procedures, that concurrently with their own analysis
and considerations functioned as references and were of the utmost importance to
our academic investigation. In this chapter we will review the main existing studies
that can contribute to a better understanding of the main ideas underlying this work,
namely the concepts of earnings management, and of accrual-based earnings, as
well as the motivation behind it.
2.1.Earnings Management
2.1.1. Earnings Management – definition
Companies commonly try to maximize shareholders’ value by carefully managing
assets and goods acquired both through capital and debt, so that investors feel
encouraged to invest as they expect high firm performances in the future. Firms’ are
interested in reporting positive earnings and positive earnings growth because it
means that they can meet analysts’ predictions in order to acquire capital (Degeorge,
Patel & Zeckhauser., 1999). But it’s not always easy to meet market’s expectations,
and firms need to find inventive ways to manage results in order to do it.
Earnings management (EM) is defined differently according to distinctive authors.
5
external financial reporting process, with the intent of obtaining some private gain
(as opposed to merely facilitating the neutral operation of the process)”. Healy &
Wahlen (1999) argued that “earnings management occurs when managers use
judgement in financial reporting in order to change financial reports to either
mislead some stakeholders about the underlying economic performance of the
company, or to influence contractual outcomes that depend on reported accounting
numbers”.
One of the most well-known EM practices is called «earnings smoothing». Earnings
smoothing is done by reducing earnings and cash flows variations in order to make
them less unstable. By subjectively making use of standing rules, managers will thus
change financial reports and handle financial statements as best suited to meet
investors and stakeholders predictions and to change their opinion about the
company economic performance, or to influence contracts that may depend of
accounting results (Healy & Wahlen, 1999).
2.1.2. Earnings Management - perspectives
As per Beneish (2001) there are two EM perspectives: (a) «Opportunistic Earnings
Management» (OEM) and (b) «Informative Earnings Management» (IEM).
(a)«Opportunistic earnings management» (OEM), is defined as the act of altering
the financial information released to mislead stakeholders. It happens when
managers see an opportunity to mask firm’s low performance, pretending the
company is higher in profit than truly is (Beneish, 2001). The same author also
explained that this can create problems through high free cash flow. In fact, if
there’s a surplus of free cash flow to finance any project, and managers wrongly
invest it or invest it disregarding stakeholders’ interests or wealth, it may lead to
6
Also, the higher the free cash flows, higher the ambition of managers for self-gain
or benefit (Ross, 1973; Jensen & Meckling, 1976; Jensen, 1986; Gul & Tsui, 2001).
For Guay, Kothari & Watts (1996), opportunistic behaviors are a way of manage
earnings by reducing reporting accuracy, while Christie & Zimmerman (1994)
defended that opportunistic EM occurs when managers increase their own wealth,
but do not increase the wealth of contracting parties as a whole. This is particularly
the case when management and ownership is not directly related – thus potentially
separating managers from dividends’ sharing decisions – or when management
flexibility is limited by accounting constraints (Warfield, Wild & Wild, 1995). Still,
Fudenberg & Tirole (1995) added that opportunistic EM can manifest in different
forms, namely through managers’ concern in maintaining their position in the
company or avoiding competitors.
(b)«Informative perspective» (Informative Earnings Management – IEM) is defined
as adding firms’ private expectations about future cash flows to the financial
information, in order to better support the stakeholders’ decision making process. As
managers are deeply involved in firm’s operating and investment decisions, they’re
able to easily access more and better information about future scenarios. This may
motivate managers to use discretionary accruals to better mirror economic
performance in reported earnings when communicating that information to investors
(Gul, Chen & Tsui., 2003). According to Fishman & Hagerty (1989) low investment
in firms can be explained by agency problems namely investors’ difficulty to
monitor management investment decisions. There is then an incentive for companies
to be more transparent and disclosure more information to make a better use of
investment opportunities, trigger investors’ attention and reduce underinvestment
7
Either way IEM stands as a mean for managers to communicate their knowledge to
investors through high valued private information, with discretion set by Generally
Accepted Accounting Principles (GAAP), whilst OEM would normally be a
preferred choice when managers’ strategy do not consider private information to be
relevant (Healy & Palepu, 1993 and Gul et al., 2003).
2.1.3. Differentiating earnings management from earnings expectations and fraud
Though this study is focused in EM, it is important to differentiate this concept from
«expectations management» and fraud.
Bartov et al. (2002) defined «expectations management» (or forecast guidance) as
the process of driving down analysts’ earnings predictions in order to create a
positive earnings surprise (or avoid a negative earnings surprise) upon earnings
release.
EM, in turn, usually involves using accrual accounting in order to enhance results to
exceed the estimated earnings’ goal. Li et al. (2009) also said that EM is defined as
the best accounting policies that suit a desired financial reporting result. EM can
therefore be used to mask results and bring it closer to «expected outcomes». But
EM can also be regarded as a form of result’s manipulation, something that
undermines investors’ confidence. Both «earnings management» and «expectations
management» can be used (together and/or separately) to try to control market’s
reaction to unexpected corporations’ outcomes.
It is also important to differentiate EM from fraud. Dechow & Skinner (2000)
defended that EM respects the Generally Accepted Accounting Principles (GAAP),
8
a pre-determined action to make a company’s performance look better than it is in
reality throughout material irregularities and not simple accounting errors. The
National Association of Certified Fraud Examiners (1993, pp. 12) defines financial
fraud as “…the intentional, deliberate, misstatement or omission of material facts, or
accounting data, which is misleading and, when considered with all the information
made available, would cause the reader to change or alter his or her judgment or
decision”. Dechow & Skinner (2000) summarize (Figure 1) the different types of
managerial choices, separating those characterized as fraud from the ones that
involve acceptable accounting management options.
Figure 1: The distinction between Fraud and Earnings Management
They showed that while accounting fraud implies intent to deceive, other accounting
exercises (“Conservative”, “Neutral” and “Aggressive” accounting) may be
consented within GAAP but need to be tested against managerial intent.
Determining «intent» is paramount when judging the true consequences of
management’s decisions, as these might easily fall within the broad classification of
fraud even when undertaken as a strategy that conforms to GAAP.
9
2.2.Motivations for Earnings Management
Healy & Wahlen (1999) and Fields, Lys & Vincent (2001) pointed out three main
reasons for EM: capital markets, contracting and regulatory motivations.
Capital markets motivations are related with listed firms and the influence in stock
prices by reported accounting information. Once stock prices in non-listed firms are
not publically traded, this motivation should not be considered to justify EM in
non-listed companies (Healy & Wahlen, 1999 and Fields et al., 2001). Because our study
focuses on non-listed firms, capital market motivations will not be a variable for us.
Contracting motivations are related to contracts between companies and their
contracting parties. EM may result from executive compensation contracts to
maximize CEO’s remuneration if there’s an explicit or implicit link among
executive compensation and accounting numbers (Healy, 1985 and Holthausen,
Larcker & Sloan, 1995). Another contracting motivation example is manager
earnings to accomplish debt covenants requirements (Sweeney, 1994). Contracting
motivations in listed firms can thus result in internal conflicts (executive
compensation) or external conflicts (obligations to lenders or minority shareholders)
(Healy & Wahlen, 1999 and Fields et al., 2001).
Regulatory motivations are associated with the need to meet government regulation
that is accounting sensitive, such as taxation, banks’ and insurance companies’
capital acceptability rates, or fair competition legislation. Tax based EM depend on
the degree of book-tax conformity, which differ from country to country (Healy &
Wahlen, 1999 and Fields et al., 2001).
According to Healy & Wahlen (1999) and Fields et al. (2001) companies may want
10
Kasanen, Kinnunen & Niskanen (1996) concluded that having a dividend policy as a
form of regulation may enhance EM practices, as managers focus on maximizing
present value of future dividends to shareholders. However, tax regulations don’t
appear to be relevant for EM in countries with weak book-tax alignment (Kasanen et
al., 1996).
Abdolmohammadi, Kvaal & Langli (2010) stated that motivations for EM are
different when stock-market and non-listed firms are concerned. The authors even
separated family from non-family private enterprises, and hypothesized that family
businesses have more tendency to upward results. Analyzing some firms’
characteristics such as «time in-business», size, growth, profitability and auditor
(Big Four or not), these authors found CEO’s in family corporate take EM priorities
more serious than non-family CEO’s, concluding independent boards should be
applied in family firms to help mitigate EM.
In conclusion, the need to avoid agency problems, to reduce tax burden and/or to
ease a particular dividend patterns are some of the reasons behind EM in non-listed
companies (Abdolmohammadi et al., 2010). However, managers’ motivations are
not the only reasons responsible for the quality of financial reporting (Ball, Kothari
& Robin, 2000 and Bushman & Piotroski, 2006). The institutional setting and users’
requirements also assume an important role in this field. While listed firms are
subjected to International Financial Reporting Standards (IFRS), non-listed
companies are only dependable of external control, carried out by their auditors.
That said, EM can result from flexible accounting standards, unassertive
supervision, low litigation risk and transparency degree of privatenon-listed firms’
financial reporting (Abdolmohammadi et al., 2010). Abdolmohammadi et al. (2010)
11
especially when countries have more flexible local GAAP than international GAAP
(IFRS) and moderate book/tax alignment. Although financial statements in
non-listed firms are subjected to audits and are public to their users, they’re less
scrutinized by supervisors, analysts and the media.
2.3.Accrual-based earnings management
2.3.1. Definition of accrual based earnings management
Xu et al. (2007)characterized accruals-based EM as the use of judgment, estimates
or assumptions allowed by accounting standards, through recovering values of
long-term assets and expected lifespan, deferred taxes, losses from asset impairments and
bad debt, obligations for pension benefits and other post-employment benefits. Li et
al. (2009) defined accrual-based EM as a technique by which managers bend
assumptions and estimations inside the accounting system. They also described
accruals as the difference between net income and cash flows.
«Accrual-based EM techniques» are consequently set to demonstrate financial
reporting results that look more promising to a potential investor.
According to Healy & Wahlen (1999), when managers book accruals for events that
require accounting standards discretion, such as «losses from bad debts, asset
impairments and the salvage value of long term assets», one can expect to find
accruals’ EM, once those assessments might impair on third party perception about
corporate economic performance.
EM can be conducted either by accrual based management or through real1
activities’ manipulation (Cohen & Zarowin, 2010). Despite the recent preference
1
12
from companies for the latter (Graham, Harvey & Rajgopal, 2005), we will here
focus on accrual based EM.
2.3.2. Types of accruals
In accordance with Li et al. (2009) accruals can be separated in two types:
discretionary or non-discretionary.
Non-discretionary accruals refer to EM practices that focus on the increase or
decrease revenues through the creation of accruals. If non-discretionary accruals are
a function of revenue, negative deviations resulted from accruals’ estimation are,
consequently, a result of non-discretionary adjustments (Jones, 1991).
Discretionary accruals convey to changes in reported earnings (managers’ choices to
influence reported earnings) and include increase or decrease estimates of bad debt
reserves, warranty costs and inventory files.
In most of the literature, accruals result from the sum of discretionary and
non-discretionary accruals. Dharan (2003) concluded that nowadays the use of accruals
within EM became increasingly common in big corporations. It stands as an activity
by which a manager increases or decreases the levels of accounting accruals (such
as accounts receivable, inventory, accounts payable, deferred revenue or accrued
liabilities) to attain the foreseen results. Managers can also make use of Generally
Accepted Accounting Principles to create a surplus instead of a deficit and
consequently modify reported results to meet quarterly targets for a particular
division.
Dharan (2003) identified three main features associated with the use of accruals:
they permit to manage the income statement, not concerning with potential effects
13
accounting decisions, whereby there’s no need to create new business transactions;
and EM might involve one or a small group of managers, and not the entire
company. Simultaneously, the Statement of Financial Accounting Concepts (SFAC)
number 6, paragraphs 139 and 145 in the 1985’s Financial Accounting Standard
Board (FASB), maintains that whilst accruals should only reflect the true
performance of a firm, registering revenues and expenses only at the period they
occurred, they’re often also used to manipulate earnings (Joosten, 2012).
2.3.3. Constraints on accrual-based earnings management
While accrual-based EM can increase reported earnings, it demands for the creation
of an «accrual entry» in the company’s balance sheet, a «variable» also referred as
«deferred subscriber acquisition cost» (Dharan, 2003). This is however not a
permanent entry and tends to be amortized over time, meaning it will translate into
future losses for the company, consequently reversing the short term income benefit
on specific items such as inventory, accounts receivable, accounts payable and
capitalized costs, and suppressing future stock prices. This will also turn planned or
unplanned EM ineffective when considering it altogether over a period of time
(Dharan, 2003).
In short, accrual-based EM can be limited by different aspects. One is auditing. Big
auditors firms, like the Big Four, are manned by experienced people, who have
lifelong professional training and face more reputational risk than small audit
companies. Therefore, big audit firms invest more in resources to detect accrual EM
and to account for related bad practices (Becker et al., 1998).
Further, Barton & Simko (2002) concluded that the capability of a firm to
manipulate earnings through accruals is constrained by past periods’ accruals if they
14
translate into lower accounting flexibility, meaning that a company’s operating
cycle affects its accounting flexibility. Zang (2012) added that accrual reversals are
larger as the operating cycle becomes longer. Also, Leuz, Nanda & Wysocki (2003)
established an inverse relation between investor protection and accrual EM. This is
because when investors are better protected, managers’ ability to control «private
benefits» decreases as does the motivation to mask firm’s economic performance.
In short, accruals-based EM can become ineffective because of “deferred subscriber
acquisition costs”, when considering it altogether over a period of time (Dharan,
2003), and either be constrained by auditors’ scrutiny (Becker et al., 1998), firm´s
operating cycle (Zang, 2012) and accounting flexibility (Barton & Simko, 2002), or
investors’ protection (Leuz et al. 2003).
2.4.Earnings management in non-listed firms
Despite most of the studies focus more on listed companies and the quality of their
information release, recent studies are concerned on the demand and supply of
financial reporting quality in non-listed companies. Burgstahler, Hail & Leuz
(2006), for instance, concluded that non-listed corporations are more likely to
engage in EM than listed firms, and that stronger legal systems are a disincentive to
EM in both types of companies; in turn, Ball & Shivakumar (2005) uncovered that
comparing with listed , non-listed companies can better accommodate losses but
have lower quality financial reports, which might be explained by the significantly
different market demand conditions.
According to Ball & Shivakumar (2005), non-listed firms’ stakeholders have better corporate management control because of their strong ownership, a greater demand
15
Nevertheless, and as opposed to the stock-market sector, their financial statements
are unequally disclosed among the tax payers but may be more biased by tax
objectives. Coppens & Peek (2005) added that tax minimization and better
agreements with banks (usually the financial source for non-listed companies),
suppliers, customers, employees and governments, may be a cause for EM and for
the development of enduring income-increasing accounting strategies. Those
agreements encompass costs and amount of trade credit, selling prices, payment
terms of products supplied to consumers and employees’ wages and benefits.
Bowen, DuCharme & Shores (1995) concluded that even in the absence of capital
market pressures, non-listed firms still try to avoid reporting minor losses.
Managers’ self-interests may also lead to the manipulation of a company’s
economic performance thus deceiving stakeholders or influencing contractual terms
that are based on reporting accounting numbers (Healy & Wahlen, 1999).
Given the different reasons behind EM among non-listed companies and listed
firms, one fundamental reason to study the former is that there’s still little work
done about it, even though non-listed companies represent the main EU economy
and the EU market. Because of that, malpractices among non-listed corporations can
have a very strong impact in the economy (Leuz et al., 2003).
2.5.Research Question
This study will try to respond to a central question:
What are the EM determinants in non-listed European companies?
The response to this question will help us to find whether a particular reason, or a
16
When discussing the possible approaches to the problem, we’ve decided not analyze
each area of business as a variable. Although we might learn (or not) that a
particular set of industries would look more motivated towards EM than others,
we’ve anticipated that both the size of the sample and other outstanding issues (like
context of operations, countries´ legal framework, etc.) would not allow for a
decisive conclusion.
Furthermore, as we’ve learned from Healy & Wahlen (1999), managers’ self
-interests is another variable to take into consideration. And as mentioned by Christie
& Zimmerman (1994), opportunistic EM is a tool used by managers that aim to
increase their own wealth, but that are not worried with the wealth of contracting
parties as a whole. Although being an important issue, manager’s self-interest is also
something very difficult to evaluate because we would need to study managers’
profiles and personality. This shows that «behavior» may also be regarded as
another EM determinant and suggests there are others possible lines of investigation
along this path. One of such lines could address issues like managers wanting to
develop a good reputation to improve their professional competence and apply for
new jobs, what would made them less available to mask results than the ones that
know they will no longer be promoted (focusing on immediate gains and benefits
instead).
3.
Research Methodologies
To try uncover if non-listed companies use accrual-based EM, we’ll be analyzing
data from Amadeus through a regression conform to the Dechow & Dichev (2002)
model, adapting it resorting to some of McNichols' (2002) variables, as detailed
17
and on its correlation with other variables, as it stands as an (inverse) expression of
earnings quality.
Earnings quality is defined differently accordingly to the author. Some authors say
that earnings quality might vary over time, because different estimates in different
time periods will result in changing patterns of earnings, cash flows and accruals
(time series properties of earnings). Others argue that quality of earnings is better if
truthfully denoting the economic effects of fundamental transactions and events
(McNichols, 2002). Dechow & Dichev (2002) defended that there’s a strong relation
between current accruals and past, present and future cash flows, and explain that
the level and quality of accruals follow each other to explain results. If there’s a
correct allocation of cash flows to the reference periods, accruals can contribute to a
better performance throughout a firm’s results. However, once accruals work as
estimates and assumptions, they should be corrected in the future if there are
changes in predictions. Future outcomes depend on those corrections, meaning
errors affect the information based in accruals about cash flows and future results.
Accruals quality is thus measured through the working capital reflected in the
operating cash flow results, and the beneficial role of accruals falls with eventual
estimation errors (Palepu & Healy, 2000).
Still, Dechow & Dichev (2002) agreed that accruals quality is also related to
companies’ characteristics, independently of intentional EM, and might be
perceptible and recurring if compared to determinants of opportunism management
(these being many times unnoticeable or sporadic, the volatility of operations is
usually related to the propensity to make estimation errors). Firm’s observable
characteristics, as the length of the operating cycle, operations’ changeability, size,
18
all tools to evaluate accruals’ quality. They thus concluded that higher sales,
accruals and cash flows’ volatility, mirror an instable operational environment,
taking to higher estimation errors and lower quality of accruals. Equally, larger
magnitude accruals means more accruals and more propensity for estimation errors,
so poorer accruals’ quality. Referring to the operational cycle of a company, larger
cycles mean the company is more expose to uncertain situations, which in return
reflects in lower accruals’ quality.
This study main focus is the working capital accruals, where by Dechow & Dichev
(2002) model «Earnings equal Cash Flows plus Accruals» («E = CF + Accruals»),
and the benefit of using accruals encompasses the cost of having both the estimation
and the correction of estimation errors as a measure of performance. Accordingly,
when there’s place for corrections, future earnings are influenced by accruals’
assumption errors about future cash flows. The Accounting Principles, the
accounting standards, or a management’ inability to estimate incomes in the most
accurate way might be some of the causes for those estimation errors.
Dechow and Dichev’s model has, however, some constraints. In a situation where
there are deferred taxes or depreciation (equaling a time interval prior or subsequent
to the t-1 and t+1 periods) the model is not functional/adequate, because accruals / earnings’ quality are considered as current accruals. Consequently the current
analysis will exploit a modified Dechow & Dichev's (2002) model, adding
McNichols' (2002) revenue variation, and property, plant and equipment variables,
as it will reduce evaluation errors and potentially contribute to a better explanation
of the original model (Miranda, 2013).
19
WCAi,t = 𝛽0,I + 𝛽1,iCFOi,t-1 + 𝛽2,iCFOi,t + 𝛽3,iCFOi,t+1 + 𝛽4,i∆Revi,t + 𝛽5,iPPEi,t + 𝜀i,t (1)
Where:
WCAi,t = iCompany’s Working Capital Accruals in period t;
CFOi,t-1 = iCompany’s Operating Cash Flows in period t-1;
CFOi,t = iCompany’s Operating Cash Flows in period t;
CFOi,t+1 = iCompany’s Operating Cash Flows in period t+1;
∆Revi,t = iCompany’s revenue variation between periods t and t-1;
PPEi,t = iCompany’s Property, Plant and Equipment in period t;
𝜀i,t = iCompany’s Estimate Residuals in period t.
As per the later equation, accruals are measured through the working capital
equation errors (𝜀i,t), assuming it will counterweigh for the time gap between the
moment of a firm’s economic achievements and sacrifices and its associated cash
flows records, thus allowing for a better company’s based earnings performance.
The estimation error is the difference between the amount accrued and the amount
realized. Period t’s earnings thus include the opening error to be realized in t+1 when actual (t) and projected (t+1) cash flows are compared, and the reversing error, denoting the cash flows realized in period t that differ from the estimations in period
t-1 (McNichols, 2002).
Working Capital Accruals and Operating Cash Flows were calculated as follows:
a. Working Capital Accruals (WCA):
WCAi,t = ∆CAi,t - ∆CLi,t– Cashi,t + ∆Debti,t (2)
Where:
∆CAi,t = iCompany’s Current Assets variation between years t-1 and t;
20
∆Cashi,t = iCompany’s Cash variations between year t-1 and t;
∆Debti,t = iCompany’s Debt variations in current liabilities between years t-1 and t.
b. Operating Cash Flows (CFO)
CFOi,t = NIBEi,t– (∆CAi,t - ∆CLi,t - ∆Cashi,t + ∆Debti,t– Depi,t) (3)
Where:
NIBEi,t = iCompany’s Net Income Before Extraordinary Items at period t;
Depi,t = iCompany’s Depreciation and Amortization Expense at year t.
After the estimating in equation (1), the calculated quality measure for accruals
(AQ) is done through the residuals’ standard deviation, AQi, = 𝜎 (𝜀i,) (4).
As already mentioned, when AQ increases accruals quality decreases and company
earnings’ quality also diminishes.
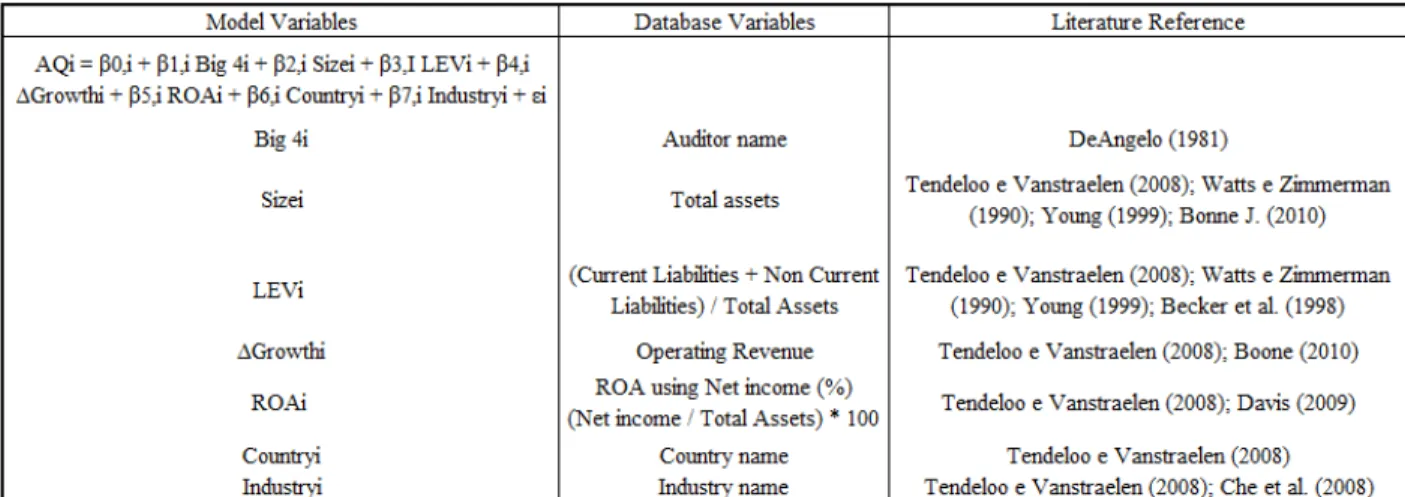
3.1. Model and Variables
As detailed in chapter 7.(Attachments), Table I – Variables, the multivariable model
to test the hypothesis of this study and to answer the research question is defined as:
AQi = 𝛽0,i + 𝛽1,i Big 4i + 𝛽2,i Sizei + 𝛽3,I Levi + 𝛽4,i ∆Growthi + 𝛽5,i ROAi + 𝛽6,i
Countryi + 𝛽7,i Industryi + 𝜀i (5)
According to DeAngelo (1981) the permanent concern about reputation and market
position induces Big Four audit companies towards higher quality and diminish
penalties, which making them incur less in EM. Bigger companies are as well less
willing to involve in EM because of litigation risk, hence management transparency
improves, resulting in a more straightforward financial reporting (Van Tendeloo &
Vanstraelen, 2008; Watts & Zimmerman, 1990; Young, 1999 and Boone et al.,
21
EM since they need to avoid debt contracts violations. But those practices can be
reduced when there’s a place for contract’s renegotiation and firms find themselves
in a great financial stress (Van Tendeloo & Vanstraelen, 2008; Watts &
Zimmerman, 1990; Young, 1999 and Becker et al., 1998).
Volume of sales is yet another relevant variable to evaluate different firms’
performance, with higher volume of sales being associated to higher level of EM
(Van Tendeloo & Vanstraelen, 2008 and Boone, Khurana & Raman, 2010). These
authors came to the same conclusion when assets profitability is considered.
In addition, and much to our own belief, Van Tendeloo & Vanstraelen, 2008 and
Boone et al., 2010 anticipated different «countries’ characteristics» and «type
industry» could influence the level of EM thus becoming an interesting subject for
further studies.
3.2.Data and Sample
The data was collected from database Amadeus. These data were initially composed
by 10870 companies, sorted by: companies from European Union (15 countries);
unlisted companies; all commercial activities, except financial and insurance
corporations, public administration, defense, and compulsory social security
(Miranda, 2013); medium, large and very large companies (covering a number of
employees between 50 and 250). After eliminating companies with no data, the final
figures set at 5757. Also, for lack of information respecting operating revenue and
tangible fixed assets from Denmark in the time chosen, it was discarded.
As we can see in Table I – Sample composition by industry and auditor type, and in
Table II – Sample composition by country and auditor type, the majority of the
22
retail trade; repair of motor vehicles and motorcycles); and M (Professional,
scientific and technical activities). These are also the sectors that include more firms
that have both been audited and non-audited by the Big Four auditors (see paragraph
7. (Attachments), Table II – Industry Dimension). In general there are more
companies not audited by the Big Four than audited (66% against 34%).
In terms of countries, the sample is mainly composed by companies from the United
Kingdom (39%), Italy (22%) and France (12%). The United Kingdom is the country
that has more companies audited by the Big Four’s (13%), followed by France (7%)
and Sweden (4%). Noteworthy, the United Kingdom and Italy are the two countries
with more companies not audited by Big Four auditors (26 and 21% respectively).
23
Table II – sample composition by country and auditor type
4.
Results
4.1.Correlation Matrix
Table III represents the correlation matrix for the variables chosen for this study.
Table III – Variables Correlation Matrix
* and ** - indicate 1% and 5 % correlation levels respectively (Pearson Correlation)
AQ = Accruals Quality; Lev = leverage; Size = logarithm of total assets; Growth = operating revenue variation; ROA = Return on Assets using net income; Big Four = dummy variable assuming “1” if the company was audited by a Big Four audit or “0” otherwise.
Through the correlation table it is possible to conclude that «leverage» establishes a
positive correlation with the dependent variable accruals quality (0,003), meaning
most indebted companies have lower earnings’ quality (or vice versa, less indebted
24
correlation (0,360 and 0,031 respectively) meaning bigger companies and firms with
a higher value of ROA have worse estimated accruals quality and, consequently,
less earnings’ quality as well. It is also interesting to observe the correlation
between the most significant variables. When linking «leverage» and ROA, or
«size» and «ROA», we can see that more indebt firms present lower levels of ROA
(-0,083), while bigger companies have better ROA (0,010). In general «leverage»,
«size» and «ROA» are positively correlated with AQ, whilst «growth» is negatively
correlated with AQ. Therefore, larger companies with higher ROA, lesser sales
variation and more indebt have a worse earnings quality.
The results obtained are not all in line with some of the referenced authors.
According to Van Tendeloo & Vanstraelen (2008) and Davis, Soo & Trompeter
(2009) higher assets profitability, equaling a higher ROA, is associated with lower
EM practices, while we conclude to the contrary. The same happens when the
authors address the «size» variable. Otherwise, our conclusion about leverage seems
to be in line with Van Tendeloo & Vanstraelen (2008) assumption, whereby firms
with high level of leverage are more willing to practice earnings management.
4.2.Descriptive Analysis and Evaluation of the Results
When analyzing Table III – Descriptive Statistics, in paragraph 7. (Attachments), it
is possible to see that, except for «growth» with a -1,968 mean value, all variables
have a positive mean. Through the descriptive statistics is it also possible to
conclude that our variables don’t follow a symmetric distribution (mean and median
have different values for each variable), what is confirmed by the kurtosis parting
25
In general, and again except for «growth», the standard deviation tends to be small,
meaning there’s no significant data dispersion (data is clustered around the mean).
Each company’s WCA and CFO values were calculated through equations 2 and 3,
and later used to estimate the regression (1). Upon this, standard deviation from
residuals could be obtained for each industry and for the total of companies.
Table IV - Regression Model Results
AQ = Accruals Quality; Lev = leverage; Size = logarithm of total assets; Growth = operating revenue variation; ROA = Return on Assets using net income; Big Four = dummy variable assuming “1” if the company was audited by a Big Four audit or “0” otherwise.
Through Table IV – Regression Model Results, it’s possible to see that the variables
«lev», «size», «growth» and «return on assets (ROA)» seem to be meaningful at
both a 5 and 10% level of significance. This means that leverage, size, growth and
ROA might be seen as reasons for EM. When those variables have a positive sign,
this means there is a positive relation with the AQ variable and consequently
companies will display worse accruals quality. That’s what happens with the, «lev»,
«size» and the ROA variables (see correlation matrix in paragraph 4.1. for details),
thus higher indebt firms, larger (bigger size) firms and companies with better return
26
In regards to the «leverage» variable, our findings agree with Watts & Zimmerman
(1990) who explained that high leverage firms are more prone to EM because they
want to avoid the violation of debt covenants. However, in what «size» is concerned
we’ve concluded against Van Tendeloo & Vanstraelen, 2008, who believe larger
firms’ managers will engage less in EM to avoid litigation risks. The same happened
for «growth», where our analysis did not abide to all of the referenced literature.
Boone et al. (2010) and Van Tendeloo & Vanstraelen (2008), for instance,
concluded that higher volume of sales is associated with higher levels of EM, stating
that higher sales volatility mirrors an instable operational environment, taking to
more estimation errors and lowering the quality of accruals.
Looking to the “Big Four” variable, it seems also to be significant. However it has a
negative correlation with the dependent variable AQ, meaning companies audited by
the Big Four’s audits incur less in EM practices, once they usually produce better
quality accruals. This follows DeAngelo (1981) and Van Tendeloo & Vanstraelen
(2008) conclusions, for whom auditors need to maintain a sound reputation in the a
very competitive market, and will do the utmost to ensure the quality of their work
so not to endanger that reputation.
As per the «countries’ dummy variable», it is not statistically relevant, denoting
localization is a reason to link a company to its quality of accruals.
Examining trends against type of industry, the later appears not to be significant to
explain EM. Nevertheless, some industries as A, D and P, where p-values range
from 0,038 to 0,254, denote that there are some areas more significant than others.
But taking into consideration the descriptive statistics in paragraph 7.
(Attachments), Table IV – Descriptive Statistics for AQ for each industry, industries
27
denoting we cannot conclude about a direct relationship between type of industry
and EM as it is influenced by a multiplicity of factors.
Therefore, despite the regression outcomes, we would need to deepen the analysis
over other variables if wanting to conclude whether particular industries show an
increased tendency towards EM than others, as already mentioned.
All in all, our findings may have been influenced by the environmental context and
the «human behavior», all driving available data and derived statistical analysis with
a decisive impact on the results attained. The reference period of our sample goes
deep into the years of the financial crisis, where there were several setbacks in the
overall sales market, with different variables being simultaneously affected. Because
we’re actually looking at firms’ and managers’ behaviors, diverse reference periods,
dissimilar contexts and/or an unusual combination of effects can trigger distinct type
of responses, which may be a cause why our analysis didn’t confirm some of the
literature findings. Matsumoto (2002) valued «earnings surprise behavior» as a
variable that evaluates differences in firms performances that manage their earnings
distinctively to be in an economical advantage2 or simply because companies’
managers' are moved by different motivations.
In addition, Ball & Shivakumar, (2005) believed non-listed firms’ financial
statements are possibly more influenced by tax reasons than any other motive. This
suggests that despite their significance some variables may have a stronger impact
in the results than others therefore there might be the need to unequally balance
variables to better mirror determinants weights in the final results. This may stand as
yet another suggestion for future investigations.
2
28
Though previous comments cannot be regarded as a direct conclusion of the study,
we see it as one possible explanation to what we found to be a very complex
problem / challenge.
5.
Conclusions
5.1.General overview of the study
The purpose of this study was to understand accruals earnings management
determinants in European unlisted firms.
To answer that question we’ve exploited an existent model, defined by Dechow &
Dichev (2002) and modified by McNichols (2002), setting the dependent variable as
the accruals quality measure (AQ). The sample was composed by 5757 companies
from 14 European countries, considering a 10 year period (2006 a 2015), with data
been collected from the Amadeus database.
The results indicated that «leverage», «size», «growth», and «return on assets » are
statistically significant variables to explain our dependent variable Accruals Quality
(AQ), and that it might be considered as possible reasons for EM. Except for the
case of «growth», all those variables establish a positive relation with the variable
AQ, suggesting more in debt, bigger and with higher assets profitability companies
have worse accruals quality and, consequently poorer earnings quality (thus more
susceptible to handle results).
The Big Four variable in our study is also significant, indicating that companies
audited by the Big Four auditors would incur less in EM.
With respect to the «leverage» variable, the results suffice to sustain that it might be
29
correlation between the former and the latter, confirming that high leverage firms
are more expected to incur in EM.
In terms of «size», we’ve concluded that larger firms are more prone to EM.
Our «growth» variable is also statistically significant and has a negative correlation
with AQ.
«Return on Assets» also proved as significant, positively relating with the AQ
variable, thus being linked to lower accruals and earnings quality (and to firms more
probable to incur in EM).
Through the descriptive analysis we’ve also determined that the most relevant
variables influencing accruals quality are «leverage», «size», «growth», «return on
assets» and «Big Four».
In sum, we found «leverage», «size», and «ROA» are positively correlated with AQ
and «growth» negatively correlated with AQ. Therefore we’ve concluded that larger
non-listed companies with higher ROA, lesser sales variation and more in debt have
a worse earnings quality hence stronger tendency towards EM.
5.2.Limitations
Despite acknowledging that the prevailing financial / economic crisis may definitely
impact on the results – as advanced in paragraph 4 – it could not be fed into the
model as a variable.
Also differences in different companies ‘sizes were not controlled, once they were
30
5.3.Further Research
Once this is a subject only developed in recent studies, it would be interesting to try
or add different variables to the model used. The comment about the impact of the
financial / economic crisis is an example.
We might also need to deepen the reasons behind what we’ve evaluated as
«different motivations» for EM among non-listed firms and listed companies. While
we’ve offer our conclusions based on several referenced authors hypothesis,
bridging descriptions, thoughts, reasons and explanations, there is room for more
specific and direct investigation about each of the studied variables considered
individually.
Future investigation should also be able to determine whether unevenly weighting
subject variables would better mirror their true influence when reasoning firm EM
motivations.
Finally, we’ve used a 10 year reference sample but some of the mentioned authors
have their thoughts based in rather dissimilar time periods. Because time makes the
study ever more valuable, and the results become more trustworthy as the sample
period gets wider, one should be able to also reflect time as a variable.
Last but not least, behavior should one should not be underestimate as a major
determinant. This suggests future studies could balance the exact and the social
31
6.
References
Abdolmohammadi, M., Kvaal, E. & Langli, J.C. (2010). Earnings management priorities of private family firms, Unpublished Manuscript, Norwegian School of Management, Norway. (3), 1-37.
Ball, R., Kothari, S.P. & Robin, A. (2000). The effect of international institutional factors on properties of accounting earnings. Journal of accounting and economics, 29(1), 1–51.
Ball, R. & Shivakumar, L. (2005). Earnings quality in UK private firms: comparative loss recognition timeliness. Journal of accounting and economics, 39(1), 83–128. Barton, J. & Simko, P.J. (2002). The balance sheet as an earnings management
constraint. The Accounting Review, 77, 1–27.
Bartov, E., Givoly, D. & Hayn, C. (2002). The rewards to meeting or beating earnings expectations. Journal of Accounting and Economics, 33(2), 173–204.
Becker, C.L., Defond, M., Jiambalvo, J. & Subramanyam, K.R. (1998). The effect of audit quality on earnings management*. Contemporary accounting research, 15(1), 1–24.
Beneish, M.D. (2001). Earnings management: A perspective. Managerial Finance, 27(12), 3–17.
Boone, J.P., Khurana, I.K. & Raman, K.K. (2010). Do the Big 4 and the second-tier firms provide audits of similar quality? Journal of Accounting and Public Policy, 29(4), 330–352.
Bowen, R.M., DuCharme, L. & Shores, D. (1995). Stakeholders’ implicit claims and accounting method choice. Journal of Accounting and Economics, 20(3), 1–17. Burgstahler, D.C., Hail, L. & Leuz, C. (2006). The Importance of Reporting Incentives:
Earnings Management in European Private and Public Firms. The Accounting Review, 81(5), 983–1016.
Bushman, R.M. & Piotroski, J.D. (2006). Financial reporting incentives for conservative accounting: The influence of legal and political institutions. Journal of Accounting and Economics, 42(1), 107–148.
Christie, A.A. & Zimmerman, J.L. (1994). Efficient and opportunistic choices of accounting procedures: Corporate control contests. Accounting Review, 539–566. Cohen, D.A. & Zarowin, P. (2010). Accrual-based and real earnings management
activities around seasoned equity offerings. Journal of Accounting and Economics, 50(1), 1–46.
Coppens, L. & Peek, E. (2005). An analysis of earnings management by European private firms. Journal of International Accounting, Auditing and Taxation, 14(1), 1–17.
32
meet or beat earnings forecasts. Contemporary Accounting Research, 26(2), 517– 548.
DeAngelo, L.E. (1981). Auditor size and audit quality. Journal of accounting and economics, 3(3), 183–199.
Dechow, P.M. & Dichev, I.D. (2002). The quality of accruals and earnings: The role of accrual estimation errors. The accounting review, 77(1), 35–59.
Dechow, P.M. & Schrand, C.M. (2004). Earnings Quality, United States of America; Elizabeth Collins Book Editor.
Dechow, P.M. & Skinner, D.J. (2000). Earnings management: Reconciling the views of accounting academics, practitioners, and regulators. Accounting Horizons, 14(2), 235–250.
Degeorge, F., Patel, J. & Zeckhauser, R. (1999). Earnings management to exceed thresholds*. The Journal of Business, 72(1), 1–33.
Dharan, B.G. (2003). Earnings management with accruals and financial engineering.
The Accounting World.
Fields, T.D., Lys, T.Z. & Vincent, L. (2001). Empirical research on accounting choice.
Journal of accounting and economics, 31(1), 255–307.
Fishman, M.J. & Hagerty, K.M. (1989). Disclosure decisions by firms and the competition for price efficiency. The Journal of Finance, 44(3), 633–646.
Francis, J., Schipper, K. & Vincent, L. (2003). The Relative and Incremental Explanatory Power of Earnings and Alternative (to Earnings) Performance Measures for Returns. Contemporary Acounting Research, 20(1), 121–164.
Fudenberg, D. & Tirole, J. (1995). A theory of income and dividend smoothing based on incumbency rents. Journal of Political economy, 103 (1), 75–93.
Graham, J.R., Harvey, C.R. & Rajgopal, S. (2005). The economic implications of corporate financial reporting. Journal of accounting and economics, 40(1), 3–73. Guay, W.R., Kothari, S.P. & Watts, R.L. (1996). A market-based evaluation of
discretionary accrual models. Journal of accounting research, 34, 83–105.
Gul, F.A., Chen, C.J.P. & Tsui, J.S.L. (2003). Discretionary accounting accruals, managers’ incentives, and audit fees. Contemporary Accounting Research, 20(3), 441–464.
Gul, F.A. & Tsui, J.S.L. (2001). Free cash flow, debt monitoring, and audit pricing: Further evidence on the role of director equity ownership. Auditing: A Journal of Practice & Theory, 20(2), 71–84.
Healy, P.M. (1985). The effect of bonus schemes on accounting decisions. Journal of accounting and economics, 7(1), 85–107.
33
Holthausen, R.W., Larcker, D.F. & Sloan, R.G. (1995). Annual bonus schemes and the manipulation of earnings. Journal of accounting and economics, 19(1), 29–74. Jensen, M.C. (1986). Agency cost of free cash flow, corporate finance, and takeovers.
Corporate Finance, and Takeovers. American Economic Review, 76(2), 323-329. Jensen, M.C. & Meckling, W.H. (1976). Theory of the firm: Managerial behavior,
agency costs and ownership structure. Journal of financial economics, 3(4), 305– 360.
Jones, J.J. (1991). Earnings Management During Import Relief Investigations. Journal of Accounting Research, 29(2), 193–228.
Joosten, C. (2012). Real earnings management and accrual-based earnings management as substitutes. Master thesis in Department Accountancy Faculty of Economics and Business Studies, Tilburg University, Tilburg.
Kasanen, E., Kinnunen, J. & Niskanen, J. (1996). Dividend-based earnings management: Empirical evidence from Finland. Journal of Accounting and Economics, 22(1), pp.283–312.
Leuz, C., Nanda, D. & Wysocki, P.D., 2003. Earnings management and investor protection: an international comparison. Journal of financial economics, 69(3), 505–527.
Levitt, A. (1998). Remarks by chairman Arthur Levitt, Securities and Exchange Commission, The numbers game. NYU Center for Law and Business, New York, NY, 68(12), 14-19.
Li, F., Rider, E. & Moore, E. (2009). Accrual Based Earnings Management, Real Transactions Manipulation and Expectations Management: US and International Evidence, Unpublished Manuscript, USA.
Matsumoto, D.A. (2002). Management’s Incentives to Avoid Negative Earnings Surprises. The Accounting Review, 77(3), 483–514.
McNichols, M.F. (2002). Discussion of The Quality of Accruals and Earnings: The Role of Accrual Estimation Errors. The Accounting Review, 77(4), 61–69.
Miranda, V. (2013). Qualidade dos Resultados e Qualidade de Auditoria nas Empresas não cotadas Europeias. Master Dissertation in Accounting, Taxation and Corporate Finance, Lisbon School of Economics and Management.
Mohanram, P.S. (2003). How to manage earnings management. Accounting World, 10(1), 1–12.
Mulford, C.W. & Comiskey, E.E. (2011). The financial numbers game: detecting creative accounting practices, John Wiley & Sons.
National Association of Certified Fraud Examiners. (1993). 12.
Palepu, K.G. & Healy, P.M. (2000). Business Analysis and Valuation Cincinnati. 3rd Ed. Canadda: OH: South-Western College Publishing.