M
ESTRADO
DESENVOLVIMENTO
E
COOPERAÇÃO
INTERNACIONAL
T
RABALHO
F
INAL DE
M
ESTRADO
DISSERTAÇÃO
EAST
TIMOR
AND
THE
IMPORTANCE
OF
AID
IN
AN
OIL-PRODUCING
COUNTRY
MARIANA
MORAIS
CORREIA
VIEIRA
M
ESTRADO EM
DESENVOLVIMENTO
E
COOPERAÇÃO
INTERNACIONAL
T
RABALHO
F
INAL DE
M
ESTRADO
DISSERTAÇÃO
EAST
TIMOR
AND
THE
IMPORTANCE
OF
AID
IN
AN
OIL-PRODUCING
COUNTRY
MARIANA
MORAIS
CORREIA
VIEIRA
ORIENTAÇÃO:
MANUEL
ANTÓNIO
DE
MEDEIROS
ENNES
FERREIRA
Table of Contents
Introduction ... 1
1.Review of the literature: ODA’s motivations ... 2
2. A brief overview on East Timor ... 6
2.1. Towards the Independence (2002)………..6
2.2. Post-independence period……….8
2.3. The economic context………9
3. Financing Development in East Timor ... 11
3.1. Official Development Aid………12
3.2. Foreign Direct Investment………...20
3.3. Remittances……….21
3.4. Loans………22
3.5. Return of Petroleum Fund………...22
4.Discussing………23
Conclusion ... 29
References ... 31
Introduction
Financing development has always been a challenge for the majority of the developing countries. Among the several ways that external financing sources can assume, for the least developed countries (LDC) and in average, Official Development Aid (ODA) is the main external inflow. At the same time, many of those countries have a natural resources-based economy, a situation that allows them to assure a share of their own income in hard currency.
East Timor is an LDC, and became independent in 2002. Looking at domestic and external financing sources, the former means oil and gas export revenue (and a non-renewable commodity) and the latter is ODA, but it is by no means the main external inflow. In this context, how important are the sources of financing, both in relative and absolute terms? How important are the other forms of external financing sources, such as foreign direct investment (FDI), remittances or loans? And looking at East Timor’s future, are they stable and guaranteed?
In general, annual value of ODA depends on the needs of the recipient country. However, and sometimes mainly, donors’ different motivations and interests are the key explanation factor. As ODA is so meaningfully to East Timor, it is unavoidable to take a close insight on it in the period between 2012 and 2018.
In this dissertation we analyze the main bilateral and multilateral donors, i.e., Australia, Japan, Portugal and the United States of America, and the European Union, the United Nations or the Asian Bank of Development. For example, while Australia chooses to give assistance to geographically close countries, Portugal tends to give more to former colonies, while the United States of America and Japan have more geopolitical motivations.
On the other hand, oil and gas fields in East Timor’s territorial waters are explored by multinationals companies and the country receives an income according the agreements with those companies. And oil price is volatile and a non-renewable commodity. To prevent instability and financial losses, East Timor government set up a Petroleum Fund in 2005 as a Sovereign Wealth Fund. The idea is to ensure that future generations might beneficiate from this income.
This work will comparatively analyze the sources of external financing sources vis-à-vis the oil revenue and the factors that might influence East Timor’s ODA. Thus, the main research question of this dissertation is to discuss the role of those financing sources and, particularly, ODA and oil as a reliable source in assuring the economic and social future development in East Timor. The dissertation is structured in four sections. Following an Introduction, Section 1 briefly presents a review of the literature on donors’ motivations and interests. The next section makes a brief political and economic overview of the country. Section 3 deals with financing development in East Timor while Section 4 discuss the question presented as the objective of this work. The dissertation ends with a Conclusion.
1. Review of the literature: ODA’s motivations
Development assistance has been measured has ODA/GNI percentage ratio, with the target being 0,7% agreed by all OECD DAC (Development Assistance Committee) members in 1970. A few countries have reached this value and the agreement was re-endorsed in 2005 by the then members of the European Union and DAC, the target being to reach the 0,7% ODA/GNI in 2015. Most countries did not accomplish it.
Of all DAC countries, only Sweden, Luxembourg, Norway and Denmark reached the 0,7% ODA/GNI in 2017. Of the DAC countries analyzed here, only Japan has a higher percentage (0.28), followed by Australia (0.23), Portugal (0.17) and the United States of America (0.16). The United States of America are among the countries that give less development assistance in ratio terms, but nevertheless it is the country that gives more aid in total gross disbursements as a result of its high GNI. (see OECD Stat.)
Historically, most countries have given development aid through bilateral assistance, but multilateral assistance has increased over the years. Bilateral aid is usually linked to political and economic interests, while Multilateral aid is consistent with the recipient development needs.
Bilateral aid usually supports political and economic interests of the donors, and the clear goals of the donors’ governments. This is called “tied aid”, when a country donates aid, but the recipient country is obliged to contract donor’s firms to do the job.
Tying aid is usually related to less altruistic countries, such as the United Stated of America, the United Kingdom and France (see Radelet, 2006).
During the Cold War, the United States of America, and the Soviet Union, used bilateral aid as a foreign policy instrument. Taiwan and China have also done so, in order to try to gain government recognition from other countries (see Alesina and Dollar, 2000).
Former colonial links also play an important role in aid allocation (see Alesina and Dollar, 2000), and Mishra et all consider that “for bilateral donors being a former colony is important in their allocation process, for their multilateral counterpart export to recipient countries is the key donor interest indicator” (Mishra, Ouattara and Parhi, 2011).
If foreign aid is “tied” and related to political and economic interests of the donor country, it is likely that aid’s impact will not promote growth and that it will not be effective on development promotion (see Berthélemy and Tichit, 2004).
The Paris Declaration (2005) committed DAC countries to continue making progresses with non-tied aid to less developed countries, as pledged in 2001. Since many targets were not accomplished, Accra Agenda for Action (2008) occurred to encourage countries to plan aid in order to end tied aid. Later, Busan Partnership on Aid Effectiveness (2011) asked that efforts to finish with tied aid and improve quality, consistency and transparency be accelerated, while reporting aid. The Sustainable Development Goals (SDGs) that are regarded as a continuation of the Millennium Development Goals, recognize that sustainable development is a shared mission, and which achievement interest relies on all countries’ interests. (Keijzer and Lundsgaarde, 2017).
About 40% of aid is multilateral, while 60% is bilateral, of which circa 17,4% is tied. The World Bank estimated that “tied aid” reduced actual ODA value in ¼. (Ali, Banks and Parsons, 2015) (OECD, 2016)
It is also noted that smaller recipient countries tend to receive more aid per capita than larger ones. Donors usually want to influence the largest possible number of countries, which leads to a disproportionate amount of aid to larger and smaller recipient countries (see Radelet, 2006). Smaller countries are also generally preferred by donors,
since it is easier to generate political influence in less populated countries, and for this reason aid dependency tends to be higher in smaller recipient countries than in larger ones. It was also noted a “bandwagon effect” - when a country receives more aid from a specific donor, wherefore this will tend to attract more aid from other donors as well (see Harrigan and Wang, 2011; and Mishra, Ouattara and Parhi, 2011). There is also an inverse relationship between the number of donors and the amount of aid provided by an individual donor country. (Chong and Gradstein, 2006)
One other question is the political nature of donor countries: conservative governments tend to oppose more to foreign aid than liberal ones. One of the reasons is that foreign aid usually implies higher taxes, another it that it is linked on to the welfare state. Conservative governments usually believe that “in a free market, poor countries would do well, and that aid only increased bureaucracy and created big government and dependence.” (Tingley, 2009) When conservative governments tend to give foreign aid, the tendency is to be more bilateral than multilateral assistance, and “… as governments become more conservative, the share of GDP committed to foreign aid effort declines”. (Tingley, 2009) On the other hand, liberal governments believe that foreign aid will help recipient countries fill the gaps where the market fails, matching the belief in accepting the role of the state in economy. (Tingley, 2009)
Aid that is usually promoted by geopolitical preferences has an impact on development. Bilateral aid promotes certain political positions, as for example the UN Security Council behavior – the donor’s strategic interests were correlated to the United Nations General Assembly and the Security Council’s votes. When aid interests are non-strategic for the donor, it is empirically demonstrated that increases development results (Gulrajani, 2017).
Different bilateral donors prioritize different interests, such as colonial links, language and traditional links, which are taken into account when choosing a recipient country.
In the 1980s, for example, the recipient countries in Africa received ODA mostly due to economic, politic, colonial linkage, strategic and political relevance. Poverty was never a relevant index to allocate official aid, and development and humanitarian
politics were rarely prioritized. After the Cold War, aid movements diminished, but were always motivated for strategic interests.
The 1998 World Bank report showed that ODA was more effective in alliance with stable macroeconomic environments, open trade policies, efficient public bureaucracies, and yet countries continued to follow their interests.
ODA has increased for the countries with needs, as it is the case of the less developed and lower income countries. This confirms that traditional donors (DAC countries) are in a process of reallocating their expenses as ODA with the international agreements that delineate aid to countries with bigger needs.
Among non-DAC countries, only China and Indonesia are emerging donors, which means that these countries are not traditional donors and do not report to OECD, and consequently their ODA statistics are more difficult to reach. It is acknowledged that China is the largest donor to emerging economies, and one of the biggest donors amongst the developing countries (see Rowlands, 2008). Development assistance flows have highly increased over the later years, and are considered an important foreign policy tool.
There is an increase in the role of non-traditional donor states, such as Turkey, Saudi Arabia, Kuwait, Israel, Czech Republic, Thailand, among others. India and China have dramatically increased their contributions to development over the past decade. Non-traditional donors account to about 10% of total ODA. If DAC countries continue to increase their amounts of ODA, it will be hard for emerging donors to influence the agenda and build their own global system. These countries are still regarded as recipient countries, as well. (Quadir, 2013)
South-South Cooperation arises from promoting “horizontal cooperation” based on the principles of equality, partnership and mutual interest. Along with the interest of changing the conventional aid practice, the non-DAC countries have different political and philosophical visions about foreign aid. Each country follows the agenda based on its distinct development vision, which does not pay much attention to social justice, environmental sustainability, human rights and democracy.
Most governments of emerging donors have to deal with poverty and with the increase of inequalities in their own countries, which seriously hinders the justification
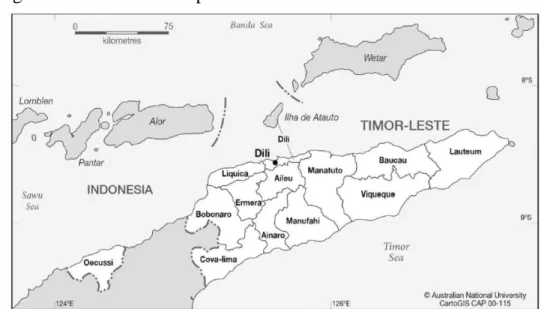
Figure 1 - East Timor Map
of public expenses in foreign development projects. Busan Document presents two innovations: the recognition of new actors besides DAC countries, and a better balance between representation and inclusion as a solution for a bigger legitimacy of problems because they were allowed to integrate the development agenda. (Esteves and Assunção, 2014)
Middle East countries oriented their ODA to countries that did not have diplomatic relations with Israel and showed similar patterns of conduct to Saudi Arabia in the United Nations. (Ali, Banks and Parsons, 2015)
In the case of China, interests in pursuing a policy on foreign aid are very political and economic, considering that China uses its foreign aid policy to create a favorable international environment for its development and increase of power status. In the 1990’s many Chinese companies benefited from China’s foreign policy as a result of its economic interests in recipient countries. (Fuchs and Rudyak, 2017)
2. A brief overview on East Timor
2.1. Towards Independence (2002)
East Timor was first occupied by Portugal in 1515 and this occupation lasted until 1974. During this period, East Timor was invaded by Japan in the Second World War and was defended by the Dutch and the Australians.
Notwithstanding the fact that under the Portuguese Constitution of 1951 East Timor was considered an ultramarine territory and a Portuguese province equal to any other, the United Nations saw East Timor as a non-autonomous territory under Portuguese administration. With the increase of the right to self-determination, the decolonization of the world and the 25th April 1974 revolution in Portugal, the Portuguese government at the time allowed the creation of political parties in East Timor. Among the parties created were the UDT, who supported the integration of Timor in a Portuguese speaking world; FRETILIN, who claimed for an independent country; and APODETI, that suggested the integration of East Timor in the Indonesian community.
The FRETILIN party won the elections and on 28th November 1975, East Timor
was declared an independent country. But nine days after the proclamation of independence East Timor was invaded and occupied by the Indonesian military forces, who later integrated the Timorese territory to Indonesia. The United States of America supported Indonesia on the grounds that FRETILIN was a Marxist organization. This support by the American government was followed by the United Kingdom, France, and Australia, which totaled 3/5 of the permanent United Nations Security Council members.
Indonesian occupation lasted for almost twenty-five years. During this period, East Timor was recognized as an Indonesian province by thirty-five of the 185 United Nations members. Despite all the past pressure for East Timor’s independence from Portugal, the United Nations never intervened to restore Timor’s independence until 1999.
After several years of serious violent acts against the Timorese people, and almost twenty-five years later, the United Nations decided to take action and intervene. The United Nations had four missions in East Timor:
• The first mission was the United Nations Mission in East Timor (UNAMET, June-October 1999). This mission’s objective was to analyze whether the Timorese wanted to be independent or not;
• The United Nations Transitional Administration in East Timor (UNTAET, October 1999-May 2002), headed by Sérgio Vieira de Mello, exercised administrative authority over East Timor during the transition to independence;
• The United Nations of Support in East Timor (UNMISET, May 2002-2005) was also a peacekeeping mission, and its priority was to give assistance to the new-born country;
• The United Nations Office in East Timor (UNOTIL, May 2005-31st December
2012) supported the development of critical institutions, including the state, as well as Human Rights issues.
The Portuguese Prime-Minister at the time, António Guterres, always showed his support to the cause of East Timor. In 2020, East Timor was one of the most recent countries in the world. It chose the Portuguese version as the official name of the country, Timor-Leste. It also opted to model its Constitution on that of Portugal.
2.2. Post-independence period
East Timor became a democracy based on a political multiparty system and a market economy. A Constituent Assembly election was held on the 30th of August 2001, the
second anniversary of the independence referendum. A new Constitution was promulgated in March 2002, and following independence on May 20th, served as its first Parliament. Since then, elections, both legislative and presidential, have been regularly held.
A national army was established for the defense of the country, and Portugal has been one of the main partners (Bernardino, 2018). Political instability has sometimes occurred as result of rivalries between the President and the parties, or among them. Another concern is corruption. Some authors stressed the attempts by the ruling elite to capture the benefits of the oil rent (Blunt, 2009).
In the political and diplomatic front, East Timor is a member of the United Nations, IMF or World Bank among other international institutions. In 2011 East Timor applied for membership of ASEAN (Association of South East Asian Nations), and continues to apply, since different regional interests have prevented the country to become a member until now. In the economic field East Timor is a member of the Asian Development Bank.
Due to its oil and gas fields, East Timor has been under a turmoil of economic and geopolitical interests that involve more directly Australia and Indonesia. Changes all
over the world have also occurred in Southeast Asia, as have China’s political and economic moves towards East Timor, which is perhaps the best example. All the same, it is noteworthy to stress Japan and Malaysia moves, among others.
2.3. The economic context
After having been a colony of Portugal until 1975, the occupation by Indonesia in that year had a similar effect on the economic and social development of East Timor. In other words, lacking political autonomy and subjected to specific interests, first of Portugal followed by Indonesia, the postponement of a development project ensued.
According to Table 1, in 2003, one year after independence, the GDP value was barely 543 million dollars. And the fact that three years later GDP was multiplied by five is not the result of some economic miracle.
Table 1: GDP in M USD
2002 2003 2004 2005 2006 2007 2008 2009 2010
_ 543 1078 1814 2658 2881 4391 3200 3999
2011 2012 2013 2014 2015 2016 2017 2108
5682 6671 5650 4045 3104 2521 2955
Source: World Bank (2018)
It is, however, the result of negotiations between the Timorese authorities and Australia in 2002, to establish the sharing of resources through the Joint Petroleum Development Area which stipulated that 90% of the benefits were to be allocated to East Timor. Coincidentally, since that moment the world witnessed the strong rise of the price of oil on the international market, which lasted until 2008 when they fell back for a short period, to rocket again. That explains how in 2012, ten years after independence, GDP was multiplied by 13!
The impact of the agreement on the Timorese economy is tremendous. Table 2 clearly highlights the characteristics of an economy dependent on oil and gas.
Table 2: Oil rents /GDP in %
2004 2005 2006 2007 2008 2009 2010
45.1 61.6 55.9 37.8 41.0
2011 2012 2013 2014 2015 2016 2017
41.8 32.6 35.5 40.8 17.3 14.0 14.5
As a consequence, the importance of this sector is reflected on the reduced weight of the non-oil activities on GDP (Table 3).
Table 3: GDP non-oil in %
2002 2003 2004 2005 2006 2007 2008 2009 2010
90.2 40.9 25.4 17.0 18.8 14.7 22.7 22.0
2011 2012 2013 2014 2015 2016 2017 2108
18.5 17.2 24.7 35.7 51.4 65.6 54.4
Source: author from World Bank (2018)
Since the sharing agreement of 2002 came into effect, the importance of the non-oil sector on GDP fell from 90.2% in 2003 to a minimum of 14.7% in 2008, when non-oil prices begun to decline. In 2013/14, when the second oil shock occurred, and only because of the falling price-effect, non-oil GDP became worth more than half the national wealth, reaching a maximum of 65.6% in 2016.
In order to guarantee the level of domestic demand, East Timor, with a poorly diversified economic structure, namely of the agricultural and industrial sector, must resort to imports, of goods but also of services. In 2018 the coverage rate was 7.8% (DGE, 2019). Its trade balance has always been strongly negative, with a high ratio to GDP. According to the IMF (2019, p.5), in 2015 the commercial deficit was 635 million dollars and 626 MUSD in 2016, corresponding to 20% of GDP. The dimension of this economy may be assessed by the value of the export of goods, which roughly amounts 20 million dollars (18 MUSD and 22 USD, in 2015 and 2018 respectively). It is essentially coffee, and the main destination markets have been the USA, Germany, Indonesia and Singapore. As regards imports, the key supplier market has been Indonesia (about 30%), followed by China and Hong Kong (each with almost 20%). In recent years the latter have surpassed Indonesia (around 15%) and Malaysia (Banco de Portugal, 2018/19 and DGE, 2019). In short, the import market is Asian and the export market is non-Asian.
This commercial deficit with the exterior is accompanied by another deficit, at times of a similar amount, the deficit of the services balance. However, the above-mentioned importance of oil revenues turns the balance of current transaction into a superavit, except when the oil price drops significantly, as it has been observed since 2016 (Table 4).
Table 4: Current Account Balance (M USD) 2002 2003 2004 2005 2006 2007 2008 2009 2010 _ -44.09 65.58 262.12 540.95 1177.2 2021.75 1284.96 1671.38 2011 2012 2013 2014 2015 2016 2017 2108 2346.05 2736.02 2390.04 1106.16 224.82 -533.08 -339.08 -89.55 Source: UNCTAD (2020)
As a result of the financial importance of the oil rent, and bearing in mind that it originates from a non-renewable source and also the structural bottlenecks of the economy, the government decided to establish in 2005 a Sovereign Wealth Fund, called the Petroleum Fund, in order to meet the requirement in Article 139 of the Constitution of the Democratic Republic of Timor-Leste (RDTL) (MF, 2019, p.3)1. The petroleum
and gas income are deposited in the PF and the government is limited to spend annually 3% of the total petroleum wealth, the so-called Estimated Sustainable Income (ESI) or “permanent income hypothesis”2. Given the importance of the PF, and aiming at being
internally and internationally transparent, East Timor became a member of the Extractive Industries Transparency Initiative (EITI). In a move to have the sovereignty of the oil revenues from the oil fields in national waters, in March 2018 East Timor and Australia signed a treaty to establish, for the first time, permanent maritime boundaries. The agreement will allow the development of the Greater Sunrise fields, which represents a source of substantial inflows to the PF” (MF, 2019, p.3).
3. Financing development in East Timor
East Timor, with a fragile and poorly diversified economy, depends in large scale on the purchase from abroad of goods and services for private and public consumption, and on investment. Its forms of external payment revolve around the oil revenues and the gains of the Petroleum Fund applications. The value of exports is low. And although the return of PF is not negligible, it is not sufficient.
1 According to MF, 2019, p.3, “the Constitution mandates a fair and equitable use of State-owned natural resources
in accordance with national interests, and that the income derived from the exploitation of these resources should lead to the establishment of a mandatory financial reserve. The Petroleum Fund was created under the provision of the Petroleum Fund Law No.9/2005 (3 August 2005) as amended by the Law No.12/2011 (28 September 2011)”
2 “The Law regulates the withdrawals in order to sustainably manage petroleum wealth and smooth spending over
time. Withdrawals in excess of the ESI can be made provided that the Parliament approves the Government’s explanation that this is in the long-term interests of the country” (MF, 2019, p.3)
In face of the exiguity of national savings to finance development, it becomes necessary to mobilize external savings. Pioneer studies, such as those by Chenery and Strout (1966), seek to show that usually in developing countries there are two gaps in the economy, the saving gap, linked to the sparse internal savings and which limits domestic investment, and the foreign exchange/trade gap that reflects a deficit of currencies that are necessary to guarantee imports and to level the balance of payments. Known as the Dual-Gap Model, the authors claim that this case represents the existence of a chronic scarcity of financial resources for the economy, which foreshadows an ‘investment limited growth’ and/or a ‘trade limited growth’. To fill these two gaps is therefore the role of external financing of development. This justifies the analysis of the characteristics of external financing of development in East Timor vis-à-vis the return of FP, and to draw the appropriate conclusions about the future of East Timor on this subject.
3.1. ODA
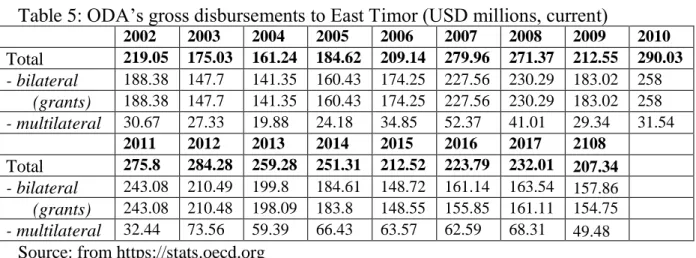
The analysis of the Official Development Assistance to East Timor between 2002 and 2017, asks that the study be divided in two parts: bilateral and multilateral aid (Table 5).
Table 5: ODA’s gross disbursements to East Timor (USD millions, current)
2002 2003 2004 2005 2006 2007 2008 2009 2010 Total 219.05 175.03 161.24 184.62 209.14 279.96 271.37 212.55 290.03 - bilateral 188.38 147.7 141.35 160.43 174.25 227.56 230.29 183.02 258 (grants) 188.38 147.7 141.35 160.43 174.25 227.56 230.29 183.02 258 - multilateral 30.67 27.33 19.88 24.18 34.85 52.37 41.01 29.34 31.54 2011 2012 2013 2014 2015 2016 2017 2108 Total 275.8 284.28 259.28 251.31 212.52 223.79 232.01 207.34 - bilateral 243.08 210.49 199.8 184.61 148.72 161.14 163.54 157.86 (grants) 243.08 210.48 198.09 183.8 148.55 155.85 161.11 154.75 - multilateral 32.44 73.56 59.39 66.43 63.57 62.59 68.31 49.48
Source: from https://stats.oecd.org
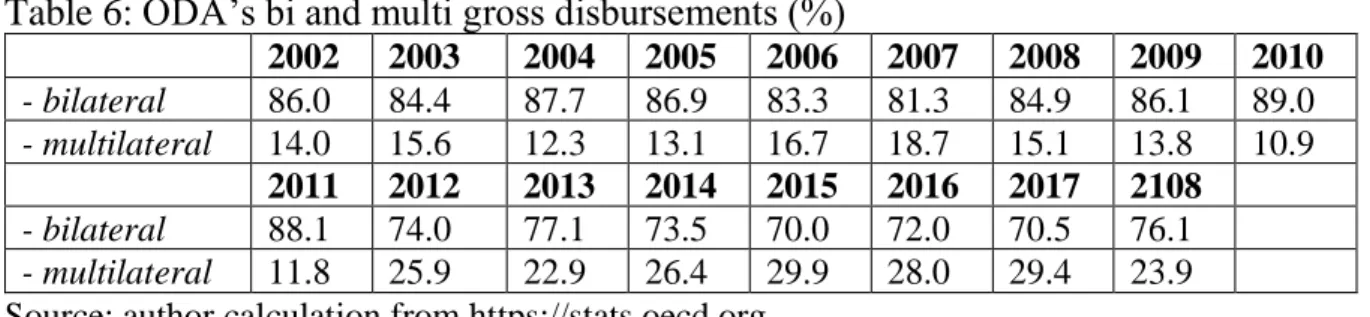
In order to better highlight the importance of bilateral ODA in relative terms, Table 6 reports the share of each component in total ODA:
Table 6: ODA’s bi and multi gross disbursements (%) 2002 2003 2004 2005 2006 2007 2008 2009 2010 - bilateral 86.0 84.4 87.7 86.9 83.3 81.3 84.9 86.1 89.0 - multilateral 14.0 15.6 12.3 13.1 16.7 18.7 15.1 13.8 10.9 2011 2012 2013 2014 2015 2016 2017 2108 - bilateral 88.1 74.0 77.1 73.5 70.0 72.0 70.5 76.1 - multilateral 11.8 25.9 22.9 26.4 29.9 28.0 29.4 23.9 Source: author calculation from https://stats.oecd.org
At least 70% of total ODA has always been bilateral and above 80% most of the time. However, bilateral ODA seems to shape a slower downsizing trend from 2010 onwards, with multilateral aid more than doubling its share (10.9% in 2010 and 23.9% in 2018). Could this be individual donor’s fatigue, as some authors describe in general this situation, or a new coordinated strategy envisaged by the two actors of donor aid? The fact is that in value, bilateral ODA decreased, and multilateral ODA increased.
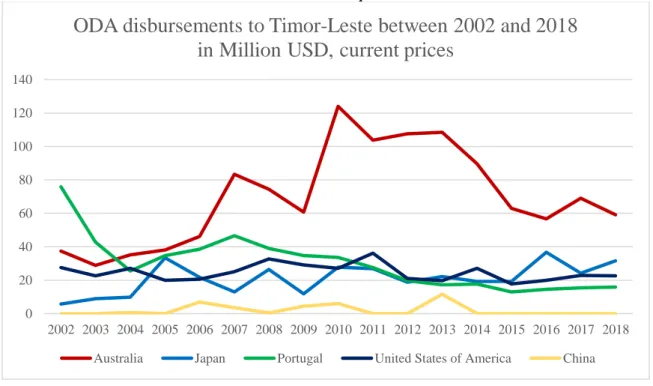
In what concerns bilateral ODA (Annex 1), four countries - Australia, Japan, Portugal and the United States of America – need to be specifically addressed, taken that in every single year they were responsible for at least 70% of the total bilateral aid (78% in 2002, 80% in 2012 and 82% in 2018) (Figure 2 with China included). South Korea, the United Kingdom and Sweden are three more donors to be considered. The absolute value of bilateral ODA had been increasing from 188 M USD in 2002 to 258 M USD in 2010, but since then it has diminished, at a regular pace, to 157 M USD in 2018. The aid motivations and the interests behind these disbursements differ in every case, from economic, geographical, historical, cultural and linguistical proximity, political, or a combination of them.
Figure 2 - ODA Disbursements to East Timor between 2002 and 2018 in Million USD, current prices
Source: author, from OECD Stat
Among these countries, Australia is by far the biggest donor country in absolute values to East Timor, except for the year 2002, when Portugal allocated more 50% than Australia. However, Portugal’s donations have been decreasing and in 2018 aid was only 1/5 compared to 2002, and one fourth of Australia’s aid. This country has been increasing ODA and eventually became the first donor to East Timor, overcoming Portugal. ODA’s value achieved the maximum in 2010 (124 M USD) but since then aid has decreased, but Australia remains the main bilateral donor. Finally, a look at Japan. In 2002 aid was 5 M USD and behind the United Kingdom. A stronger more commitment to East Timor places it in second position since 2015 (31 M USD in 2018).
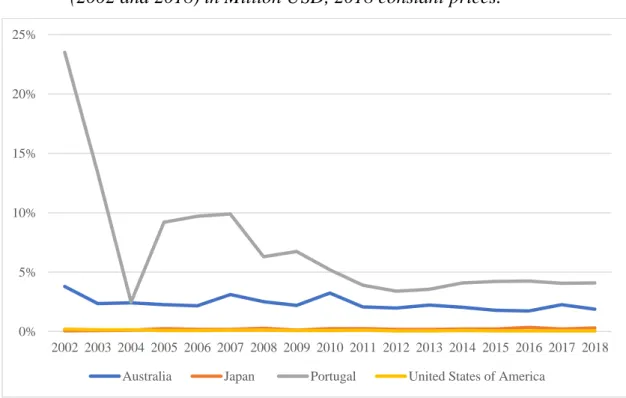
Although in absolute terms Portugal is the country that donates less among the four main donors, Portugal turns out to be the biggest donor in relative terms (Fig.3).
Soon after independence, and due to its historical and political responsibilities, Portugal’s commitment to support Timor Leste became a diplomatic and foreign policy priority to Portugal. This explains the 24% of Portugal’s total ODA channeled to East Timor , and which remained the main country target until 2007. As regards Australia, there is a smooth trend between 2%-4%, while in the perspective of both the USA and
0 20 40 60 80 100 120 140 2002 2003 2004 2005 2006 2007 2008 2009 2010 2011 2012 2013 2014 2015 2016 2017 2018
ODA disbursements to Timor-Leste between 2002 and 2018
in Million USD, current prices
Japan, East Timor is not a priority since less than 1% of their total ODA goes to this country.
Figure 3- Share of ODA to East Timor in the total ODA given by country donor (2002 and 2018) in Million USD, 2018 constant prices.
Source: from OECD Stat
It is noteworthy that all of these donors, with the exception of Portugal, prioritized Indonesia over East Timor as a recipient country. This is particularly relevant since Indonesia invaded East Timor in 1975, right after Portugal gave independence to the country. The Indonesian non-pacific invasion lasted until 1999, when the United Nations assumed the country’s government, and only in 2002 did East Timor become completely independent. Donor countries chose to give more to Indonesia probably due to political and economic relations and interests.
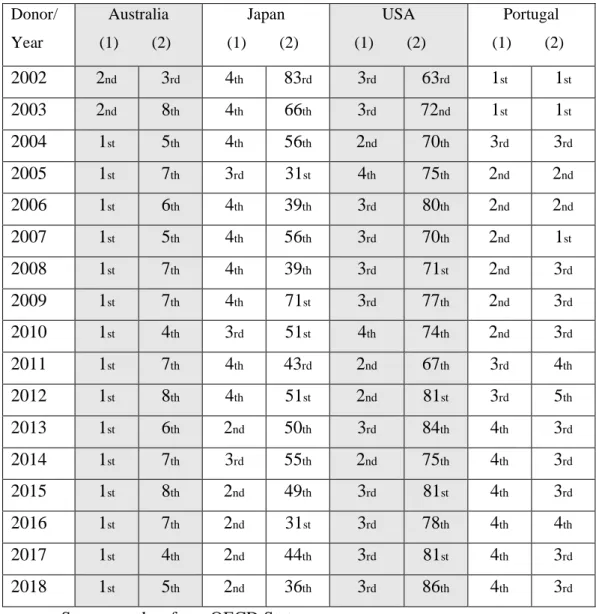
Ranking the importance of East Timor from the perspective of donors gives an idea of how differently East Timor is prioritized by each donor (Table 4). While Australia and Portugal prioritize East Timor since 2002, and that is more evident for the latter country, the same does not happen with Japan or the United States of America.
While the political transition showed to be irreversible after 2002, Portugal turned again to its former African colonies. Thus, in terms of external aid priority, East
0% 5% 10% 15% 20% 25% 2002 2003 2004 2005 2006 2007 2008 2009 2010 2011 2012 2013 2014 2015 2016 2017 2018
Timor ranked in third, fourth or even fifth position from 2008 onwards. Slightly bit different is what is happening with Australia, the main donor in absolute value. Since 2015 East Timor has become more relevant (fourth and fifth position). The negotiations towards the need of an achievement of an oil agreement in the Sunrise camp could explain it. Actually, it happened.
Table 7 - ODA ranking from East Timor’s perspective and donor’s perspective
Source: author from OECD Stat
Note: (1) ranking from East Timor’s perspective (2) ranking from donor’s perspective
Portuguese aid motivations, comparing to Australian, Japanese or American, are in fact more different and specific when it comes to choose aid allocation. Historical, cultural and linguistic bonds between countries are usually stronger than geographical,
Donor/ Year Australia (1) (2) Japan (1) (2) USA (1) (2) Portugal (1) (2) 2002 2nd 3rd 4th 83rd 3rd 63rd 1st 1st 2003 2nd 8th 4th 66th 3rd 72nd 1st 1st 2004 1st 5th 4th 56th 2nd 70th 3rd 3rd 2005 1st 7th 3rd 31st 4th 75th 2nd 2nd 2006 1st 6th 4th 39th 3rd 80th 2nd 2nd 2007 1st 5th 4th 56th 3rd 70th 2nd 1st 2008 1st 7th 4th 39th 3rd 71st 2nd 3rd 2009 1st 7th 4th 71st 3rd 77th 2nd 3rd 2010 1st 4th 3rd 51st 4th 74th 2nd 3rd 2011 1st 7th 4th 43rd 2nd 67th 3rd 4th 2012 1st 8th 4th 51st 2nd 81st 3rd 5th 2013 1st 6th 2nd 50th 3rd 84th 4th 3rd 2014 1st 7th 3rd 55th 2nd 75th 4th 3rd 2015 1st 8th 2nd 49th 3rd 81st 4th 3rd 2016 1st 7th 2nd 31st 3rd 78th 4th 4th 2017 1st 4th 2nd 44th 3rd 81st 4th 3rd 2018 1st 5th 2nd 36th 3rd 86th 4th 3rd
when compared. Political interests also have a relevant role but are more unstable, while bonds between a former colony and the colonizing country usually follow a leveled pattern.
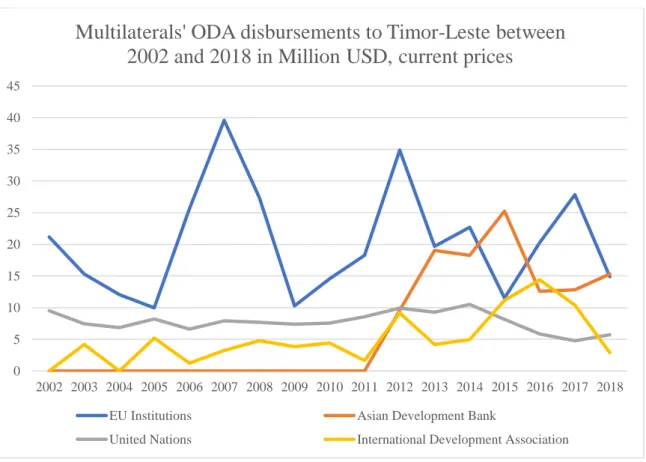
In what concerns multilateral ODA, there are four main donors to East Timor: the European Union Institutions, the United Nations, the Asian Development Bank and the International Development Association (IDA) from the World Bank. The data from the Asian Development Bank contributions to East Timor was only available from 2012 onwards (fig.6).
Figure 4 - Multilaterals' ODA disbursements to Timor-Leste between 2002 and 2018 in Million USD, current prices
Source: OECD Stat
Between 2002 and 2018, the major contributions always came from the European Union institutions, followed by the Asian Development Bank, the United Nations and IDA. The EU has been the main provider of ODA except in 2015 and 2018, when it lost the first position to the AsDB, which is notably increasing ODA to East Timor. The World Bank, through IDA, is not a relevant partner, despite a slightly increasing share over the years.
0 5 10 15 20 25 30 35 40 45 2002 2003 2004 2005 2006 2007 2008 2009 2010 2011 2012 2013 2014 2015 2016 2017 2018
Multilaterals' ODA disbursements to Timor-Leste between
2002 and 2018 in Million USD, current prices
EU Institutions Asian Development Bank
In 2002 the EU contributed to 70% of the total multilateral disbursements, decreasing to almost 40%, and currently it represents about 30%. According to data, the AsDB contribution was only 13% in 2012, behind the UN and IDA, but in 2018 it was the main donor (around 30%).
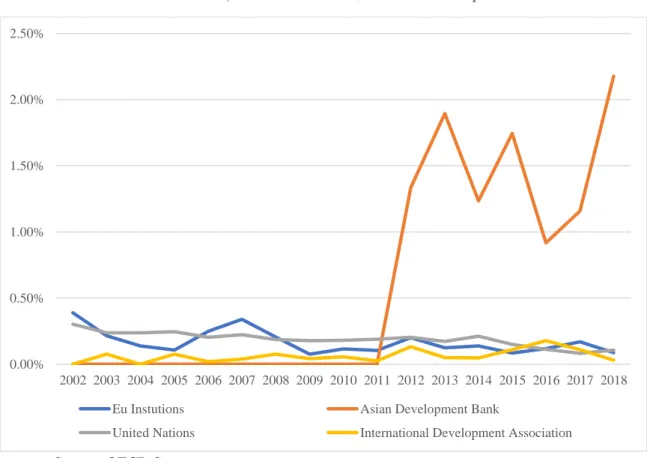
Comparing the Multilateral’s involvement in East Timor to the total channelized to all the recipient countries (Fig.5), it is noticeable that the Asian Development Bank gives a higher percentage to East Timor than the other Multilaterals, which have very similar values. In fact, in 2018 the amount of ODA from AsDB and the EU were similar, but it represented an effort of more than 2% for the former and just 0,2% for the latter. This might be due to the fact that the Asian Development Bank has a smaller group of recipient countries of its ODA, which increases its relative value when comparing to the other Multilaterals, or the result of an East Timor’s strategy looking for more involvement of Asian partners.
Figure 5 - Share of ODA to East Timor in the total ODA given by multilaterals (2002 and 2018) in Million USD, 2018 current prices
Source: OECD Stat
0.00% 0.50% 1.00% 1.50% 2.00% 2.50% 2002 2003 2004 2005 2006 2007 2008 2009 2010 2011 2012 2013 2014 2015 2016 2017 2018
Eu Instutions Asian Development Bank
Looking at the allocation of ODA to different sectors, it results from a combination of each country preferences in accordance with the recipient country. Aid is allocated in seven main different sectors established by the OECD: Social Infrastructure and Services, Economic Infrastructure and Services, Production Sectors, Multisector, Programme Assistance, Humanitarian Aid and Unallocated/Unspecified (see Annex 2). These sectors are then divided into sub-sectors. The data collected was only made for the years between 2005 and 2017, since there are no data for the years prior to these. In 2017 Unallocated/Unspecified aid allocation to East Timor had an increase of about 1700%.
Due to the scarcity of human resources in East Timor, technical cooperation is transversal to all sectors and from an aggregate point of view it absorbs a huge proportion of ODA (Table 8).
Table 8: ODA - Technical cooperation (M USD)
2002 2003 2004 2005 2006 2007 2008 2009 2010
99.87 97.92 77.41 70.73 75.66 99.18 78.64 81.71 142.86
2011 2012 2013 2014 2015 2016 2017 2108
143,12 114,1 92,93 68,73 56,16 65,92 69,68 58,99
Source: https://stats.oecd.org
In absolute values of ODA gross disbursements, most aid to East Timor was allocated to Social Infrastructure and Services, with an average of 134,5 USD millions per year, while disbursements in other sectors were between 0 and 50 USD millions. Social Infrastructure and Services are divided into “Education” and “Water Supply and Sanitation”, with Education being the category with the largest amount of donations.
The sector of Economic Infrastructure and Services is divided in two categories, “Energy” and “Transport and Communications”, the latter being a category with an enormous increase in donations since 2011. On the other hand, aid values for the sector of energy have decreased, being really close to zero.
Production sectors are divided into the categories of “Agriculture, forestry and fishing”, “Industry, mining and construction” and “Trade and Tourism”. Aid allocated to this section goes mostly to the Primary sector “Agriculture, forestry and fishing”, and the donations to Secondary and Third sector are very close to zero. This demonstrates that East Timor still has an economy very dependent of the Primary sector.
A close look of ODA allocation by each country to East Timor, shows that Australia and Portugal donate most aid to the sector of Social Infrastructure and Services. Japan, on the other hand, focuses and allocates most of its donations on the Economic Infrastructure and Services and Production Sectors’ sectors. The United States of America, in turn, chose to allocate aid almost equally to each sector, giving a bigger emphasis to sectors such as Humanitarian Aid or Programme Assistance – sectors that have usually a small percentage of the total aid received in East Timor.
In short, the meaning of total ODA either to the State Budget or to national income is impressive.
East Timor’s State Budget is divided into similar sectors and categories to the ones followed by the OECD. Official Development Assistance to the 2017 State Budget had a contribution of about 225% on average to those sectors, when compared with domestic contribution. For instances, ODA allocation to the sector of Education and
the sector of Agriculture and Fisheries was 912% and 363% higher than the State Budget allocation for the same sectors in 2017, respectively. Also, the ODA
allocation to sectors such as Water and Sanitation, Energy, Transports and Tourism was 39%, 0%, 14% and 19%, respectively. This shows that in some sectors East Timor is still very dependent on Official Development Assistance.
In terms of the national income, since the independence of East Timor, the relative importance of ODA has become lesser: 23.5% in 2002, 7.7% in 2010 and 6.6% in 2018 (Table 9). By all means it is still very significant. Bearing in mind the explanation given in point 2 about the evolution of East Timor’s GDP (even if it is different from GNI), the oil factor helps to explain it.
Table 9: ODA /GNI (%)
2002 2003 2004 2005 2006 2007 2008 2009 2010
23.55 20.69 20.66 18.92 13.37 11.53 7.01 7.24 7.73
2011 2012 2013 2014 2015 2016 2017 2108
5.3 4.83 4.79 5.49 5.32 7.11 7.22 6.69 Source: https://stats.oecd.org
3.2. Foreign direct investment (FDI)
FDI is usually the main important source of external financing. The impact in terms of employment, diversification of the economy, trade balance, know-how and human
resources are some features that every demanding country must take in account. The competition is hard and the host country should offer political stability and sound economic policies.
The case of East Timor shows how difficult it is to attract FDI. Table 10 speaks for itself; the maximum has been 49 M USD. Some Portuguese investment in coffee production (Nabeiro Group) and other investments in commerce are the bulk of FDI.
Table 10: FDI in M USD
2002 2003 2004 2005 2006 2007 2008 2009 2010 _ 4.519 .. 0.908 8.478 8.695 39.698 49.931 28.516 2011 2012 2013 2014 2015 2016 2017 2108 47.075 38.531 49.615 49.344 42.995 5.479 6.716 47.926 Source: UNCTAD (2020)
3.3. Remittances
Since the last decade remittances have become the main, or at least one of the top sources of external financing, particularly for developing countries. The same occurs in East Timor. For a very long time has a large diaspora lived abroad, a consequence of the Indonesia occupation in 1975. This diaspora has settled mainly in Europe, namely in Portugal and the UK (Wigglesworth, A. and Boxer, L., 2017), where in the latter country an estimated 20.000 Timorese live. Asia is also an important destination, agreements with South Korea and Australia were made, and Japan and New Zealand might open up in the near future (Rose, 2019). From independence to the present days, the difficulties faced by the government to boost the development of the country led to a scarcity of new jobs. Emigration seemed(s) an obviously response, a sort of way-out. The result is a rise of the inflows of remittances: from a mere 3.6 MUSD in 2005, a peak was observed in 2010 and 2011, when they reached the value of 136 MUSD and then fell. But since 2013, every year remittances have increased, up to 96 MUSD in 2018.
Table 11: Remittances in M USD
2006 2007 2008 2009 2010 2011 2012
3.642 10.444 17.655 113.347 137.135 136.896 119.859
2013 2014 2015 2016 2017 2108
33.649 43.679 61.5861 80.1746 87.0445 96.32 Source: World Bank (2018, 2020 and 2020a)
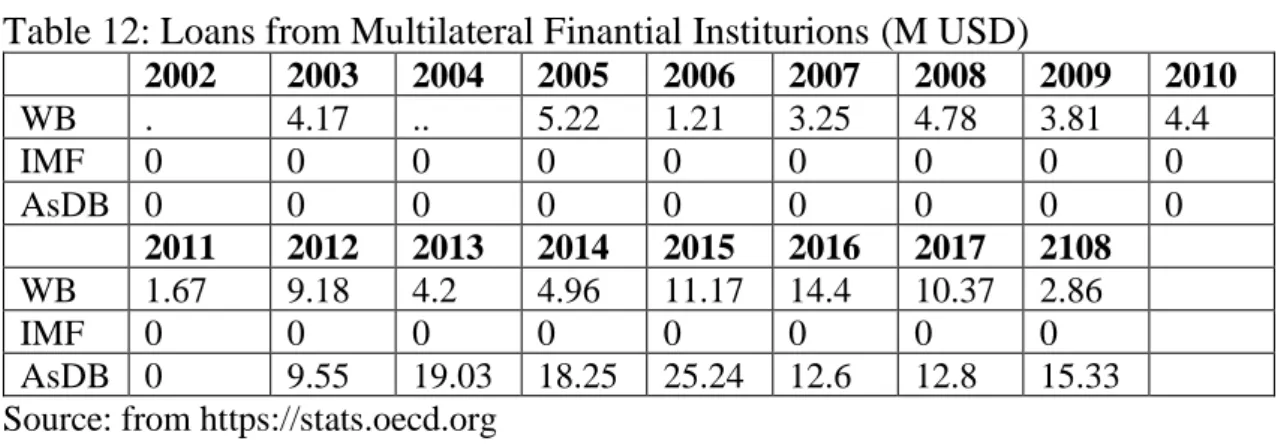
3.4. Loans
There are commercial loans and official loans. In the case of East Timor, the former are insignificant or null while the latter (concessional) assume the form of widespread grants (see Table 5).
The contribution of this source of external financing raises three remarks. First, the extremely low amount involved. Second, the substitution of the World Bank, through IDA, as the main lender from 2012 until 2018. Third, there is no loan from the IMF. It is unusual that in low income developing countries, neither the World Bank nor the IMF have an important presence.
Table 12: Loans from Multilateral Finantial Institurions (M USD)
2002 2003 2004 2005 2006 2007 2008 2009 2010 WB . 4.17 .. 5.22 1.21 3.25 4.78 3.81 4.4 IMF 0 0 0 0 0 0 0 0 0 AsDB 0 0 0 0 0 0 0 0 0 2011 2012 2013 2014 2015 2016 2017 2108 WB 1.67 9.18 4.2 4.96 11.17 14.4 10.37 2.86 IMF 0 0 0 0 0 0 0 0 AsDB 0 9.55 19.03 18.25 25.24 12.6 12.8 15.33 Source: from https://stats.oecd.org
3.5. Return on (of the) Petroleum Fund
The amount of the PF is applied in the international markets (deposits and bonds) in order to generate a return from its application. According to the PF’s initial report “the first investments started on 9 September 2005 when USD 79.6 million US dollars were transferred from the Timor Gap Account together with 125 million US dollars from the Consolidated Fund of Timor-Leste (CFET) and taxes and other petroleum revenue totaling 438.2 million US dollars were paid to the Petroleum Fund during the year ended 30 June 2006” (MPF, 2006, p.1).
The significance of the income paid by foreign extractive companies was previously well explained in terms of the GDP or the balance of payments. Consequently, if the annual revenue of the PF is volatile or even worse, negative, this compromises the economic, social and political balance in the country. Tabel 13 shows the results of the PF in terms of value (MUSD) and yield:
Table 13: Petroleum Fund –annual return (MUSD) and yield 2005 2006 2007 2008 2009 2010 2011 MUSD 7.3 48.8 92.4 223.7 31.5 221 221 Yield (%) 4.6 5.12 5.28 10.6 0.6 3.8 2.8 2012 2013 2014 2015 2016 2017 2108 MUSD 401 865 502 -21.4 648 1.612 -459.9 Yield (%) 3.9 6.6 3.3 -0.06 4.1 10.4 -2.6
Source: data from Source: author calculations from WB (2018), UNCTAD (2020), Ministry of Plan and Finance (2006) and Ministry of Finance (2007-2019)
The correlation between the price at the oil international market/instability in world economy and the return value of the PF is clear. In 2008, the first oil price shock and the financial crisis led to a sharp fall in the gain, from 223.7 MUSD to 31.5 MUSD the following year. The same applies in the day after the second oil shock, in 2014: the revenue was negative and the same occurred in a more dramatic way in 2018. The same observations could be made in relation to the yield. Near zero in 2009, and negative in 2015 and 2018.
This put pressure on the national budget and the government was obliged to obtain authorization by the national parliament to withdraw more than the 3% of the Estimated Sustainable Income (ESI). The consequence is a reduction of the total asset value of the PF and potentially less revenue for the coming years. On the other hand, and more recently, the government decided to acquire an ownership interest in the Greater Sunrise project. The transaction of executed in April 2019, as an investment in debt issued by Timor Gap E.P. The PF’ equity allocation was reduced to account for the new investment” (MF, 2019, p.3).
4. Discussing
Financing development is one, if not the main, priority that East Timor government faces since independence. As shown above, the domestic financial tool that the government can use is the return from the application of the oil wealth under the Petroleum Fund, but it is limited to 3% of PF’s total value. How important is it relatively to the total amount from external financing sources? Looking at all the components, including exports of goods and services, PT’s return value is not the main source, as Table 14 shows (in % see Annex 3):
Table 14: Financing development : sources of External Currency (M USD) 2002 2003 2004 2005 2006 2007 2008 2009 2010 ODA 219.05 175.03 161.24 184.62 209.14 279.96 271.37 212.55 290.03 FDI 4.51 0.91 8.47 8.69 39.69 49.93 28.51 Remittances 3.64 10.44 17.65 113.34 137.13 Exp (G+S) 43.34 69.15 58.14 66.14 94.88 Petro Fund 7.3 48.8 92.4 223.7 31.5 221 2011 2012 2013 2014 2015 2016 2017 2108 ODA 275.8 284.28 259.28 251.31 212.52 223.79 232.01 207.34 FDI 47.07 38.53 49.61 49.34 42.99 5.47 6.71 47.92 Remittances 136.89 119.85 33.64 43.67 61.58 80.17 87.04 96.32 Exp (G+S) 101.25 102.69 87.86 89.59 91.00 96.78 109.89 241.30 Petro Fund 221 401 865 502 -21.4 648 1.612 -459.9
Source: author calculations from WB (2018), UNCTAD (2020) and Ministry of Finance (2005-2019)
In order to better balance the two main sources of catching hard currency (externally and domestically), a look at Table 15 launches a first glimpse on this matter (in value see Annex 4)3.
Table 15: External financing versus domestic financing (Petroleum Fund, excluding Exports) (%)
2002 2003 2004 2005 2006 2007 2008 2009 2010
External financing 100 100 100 96.2 81.9 76.4 59.5 92.3 67.3
Return Petro Fund - - - 3.8 18.1 23.6 40.5 7.7 32.7
2011 2012 2013 2014 2015 2016 2017 2108
External financing 67.5 52.5 28.4 40.7 107.2 32.3 99.5 524.2
Return Petro Fund 32.5 47.5 71.6 59.3 -7.2 67.7 0.5 -424.2
Source: author calculations from WB (2018), UNCTAD (2020) and Ministry of Finance (2005-2019)
By comparing the two sources of financing, it becomes clear that only in 2013, 2014 and 2016 has the share of PF’s return been above 50%, and that in 2015 and 2018 the gain was negative. The conclusion is clear and highlights the importance of external financing. And looking at its components and accordingly to what has been exposed, ODA is by far the main source, as Table 16 elucidates ((in value see Annex 5):
3 Exports are usually not considered, and here we follow the trend. Loans are also not included because of their
Table 16: Sources of external financing (share, %) 2002 2003 2004 2005 2006 2007 2008 2009 2010 Total ODA 100 97.5 100.0 99.5 94.5 93.6 82.6 56.6 63.6 FDI - 2.5 - 0.5 3.8 2.9 12.1 13.3 6.3 Remittances - - - - 1.6 3.5 5.4 30.2 30.1 2011 2012 2013 2014 2015 2016 2017 2108 Total ODA 60.0 64.2 75.7 73.0 67.0 72.3 71.2 59.0 FDI 10.2 8.7 14.5 14.3 13.6 1.8 2.1 13.6 Remittances 29.8 27.1 9.8 12.7 19.4 25.9 26.7 27.4 Source: author calculations from WB (2018), UNCTAD (2020)
In every single year ODA contributes to more than 50% of external financing. In 11 out of 17 years, ODA achieved more than 70%. FDI is the third source, although attracting it should be a priority due to its economic and social impacts. Opposite to this, a remarkable remittances inflow since 2009 must be stressed. In the last there years, and consistently, remittances are equivalent to one quarter of external financing value (Curtain, 2018). And as Rose (2019) points out, “last year remittances became Timor-Leste’s largest non-oil source of income, before coffee but after aid” (Rose, 2019).
In relation to what has been written above, one cannot conclude that the Petroleum Fund is not such an important source of financing. Therefore, it is necessary to separate the value of the PF and the annual return obtained from the application of its assets. The value of the PT is annually cumulative and pretends to assure national wealth for the future generations. It should not be spent without rules, and that explains the existence of the 3% rule of the ESI. Another issue is the annually return obtained. This is the domestic source of hard currency to be compared to external sources (ODA, FDI and remittances loans). The PT can be used breaking the 3% rule in exceptional situations. At the same time, it is a very meaningful indicator of East Timor’s financial risk default. And this accounts in favor of the country: “the Petroleum Fund (PF)— estimated at 506 percent of GDP in 2018— is large relative to projected debt levels and debt service requirements (IMF, 2019b, p.1).
The central issue is, therefore, how long will it take for the oil fields to be depleted, since oil and gas are non-renewable commodities. The IMF calls the attention to this huge challenge: “with oil revenue from active fields expected to end in 2022,
continued drawdowns of the Petroleum Fund could pose risks to long-run fiscal sustainability. Beyond the medium-term, the development of the Greater Sunrise fields represents an upside risk” (IMF, 2019a).
In short, the core question about sources of East Timor’s development financing is the amount, but also the stability, of the value coming from each one of the different sources of financing. Having looked at the return of the PF, we must now turn the analysis to external financing and ODA in particular.
If the value of the PF depends on the international market oil price and on its yield on the behavior of the world economy, ODA, FDI or remittances depend on donors, investors and emigrants’ decisions and on the influence of domestic environment. Motivations and interests are always present in each case. If East Timor poses a high economic or political risk, investors stay away from the internal market, and the same might occur with emigrant’s decisions. In these circumstances capital and cash inflows can be unstable in value. The same applies to the allocation of ODA, but there are some differences. For multilateral ODA there are programs and projects less dependent of the domestic situation. But for bilateral ODA, it is just not like that.
Bilateral ODA is, of course, an instrument of donor’s foreign policy. The literature review in point 1 of this dissertation summarized the main findings on this theme. In bilateral aid, factors such as the economic, the humanitarian, the political, the geopolitical, the diplomatic and so on, influence how much and in what way ODA should be delivered to recipient countries. It means that annual ODA might not be so stable in value.
As more and more countries are looking to East Timor, be it for its geographical position or for its oil and gas fields, the involvement of the main partners - the traditional or the new comers (China) - through ODA, FDI, loans or remittances, relies on several motivations and interests, as summarized in Table 17. This determines the individual influx stability.
Table 17: Partner’s motivations and interests in the relationship with East Timor
Economical Historical Cultural Political / diplomatic Geopolitical (regional) Geopolitical (world) Australia X X X Japan x X x Portugal x X X X USA x X X X China X X X X Indonesia X x x X X
Note: X -strong factor; x – less strong factor
There is not a clear pattern linking the main ODA’s donors to the economic factor. The presence of Australia’s oil companies explains why this country is the first ODA donor. But that factor does not explain at all the top ranking of Japan and Portugal as ODA donors. And for a newcomer like China4, news about interests in exploring oil
as “the consideration of a US$16 billion loan to develop an offshore oil and gas field”5
, or the implementation of Digital Terrestrial Television (DTT)6 among other examples,
explain the importance of the economic factor in China’s aid, investment or loans. The historical and cultural motivation is almost unique for Portugal, even if the Portuguese oil company Galp has a 10% stake in Block E operated by the Italian ENI7 or Grupo
Nabeiro’s investment in the coffee production. The historical and cultural motivation also applies to Indonesia, but in a smaller degree. The diplomatic and geopolitical factors are common to the main East Timor’s partners, with some differences as we consider the regional or the world dispute. For geographical reasons, Asian countries are very keen on being there. As a world power, the USA share this regional influence. Having said that, we can return to the fence, i.e., look at the more or less stability of the different influx in value, by comparing the two main components, ODA and the PF return.
4 See David Hutt, “Is China's Influence in Timor-Leste Rising?”, The Diplomat, November 19, 2016
5 See Meaghan Tobin, East Timor wants to tap oil and gas near Australia, so why is it courting China?, 3 Aug,
2019, retrieved from https://www.scmp.com/week-asia/geopolitics/article/3021223/east-timor-wants-tap-oil-and-gas-near-australia-so-why-it
6 Timor-Leste to Relaunch Chinese-Led Digital Terrestrial Television (DTT) Project, retrieved from
https://www.clbrief.com/timor-leste-to-relaunch-chinese-led-digital-terrestrial-television-dtt-project/
7 Upstream em Timor-Leste, retrieved from
In order to compare the volatile degree of the different sources of financing, we calculated a dispersion measure using the coefficient of variation (CV) or the relative standard deviation (RSD) (Table 18):
Table 18: coefficient of variation (CV) of sources of financing
Petro Fund return ODA FDI Remittances 2005-07 0.859683 0.220455 0.735774 0.682911 2008-13 0.880899 0.105674 0.196849 0.572665 2014-18 3.323356 0.077154 0.734541 0.285964 2005-18 1.651295 0.143187 0.648521 0.65662 Source: author’s calculation from UNCTAD data (2020)
The period 2005-2018 has been split in three other sub-periods, the first beginning soon after independence and during the oil boom, the second coinciding with the first negative oil shock and the last sub-period corresponding to the second negative oil shock.
The results are clear: ODA is by far the less volatile, on the period 2005-18, achieving 0.143 followed by FDI and remittances, 0.648 and 0.656, respectively. The CV of Petro Fund return was 1.65, i.e., eleven times higher than that of ODA. The same conclusion might be observed in each sub-period. It is worth noting that the huge PF return’s coefficient of variation during the most volatile period of oil prices (2014-2018), with a value of 3.323, while ODA’s CV was just 0.07, or forty-three times less!
The importance of the Petroleum Fund and the income generated from it is unavoidable. It is almost the only, and very significant, hard currency national source. But it heavily depends on the international oil price and on the scale of oil and gas production. Like a resource curse, oil might paradoxically be an obstacle, and as Nygaard-Christensen (2016) points out “Timor-Leste and its new government faces the challenge of how to diversify its economy away from its current heavy dependence on the Petroleum Fund to finance its national development”. On the opposite side, ODA is based on multiannual agreements, usually a three years schedule. This allows East Timor government to have a more reliable and expectable amount of external support, and helps East Timor government to assure not only public goods such as education and health but also technical cooperation in all sectors, support to infrastructures (sanitation, water and energy supply, roads, etc. ) and the state budget. And yet, some authors are very critical about the aid: “international assistance to Timor-Leste is not about
cooperation, and not about cooptation only, but also about business… it’s a dilemma to understand international assistance in Timor-Leste… the donors use their money not to strengthen our independence, but to force us to be dependent again” (Neves, 2006, p.18).
Anyway, as the oil sector in the country faces challenges for the future, ODA will continue to play a prominent role in financing and supporting the country’s development, even if East Timor is considered an oil producing country and does not belong to OPEC.
Conclusion
East Timor’s economy is too dependent on a ‘domestic’ income source such as oil and natural gas, which will eventually come to an end, and on an external source, ODA. Other external financing sources such as FDI, remittances or loans seem to be hardly mobilized in absolute terms to become an alternative, or at least a significantly complementary source, despite the fact that remittances are on the rise. Timorese government has an urgent need to make East Timor attractive to FDI, but this will take time. Until then, ODA inflows will remain unavoidable.
Australia is by far the biggest ODA (in gross disbursements) donor to East Timor, and at the same time the country most involved in oil and gas fields production. Japan, the United States of America and Portugal are other important donors, and for Portugal, East Timor is a more relevant priority than for the other countries (Portugal gives almost 5% of its total net ODA, more than the double of the proportion given by Australia). The reasons for this are diverse and Table 17 elucidates it. While Australian, Japanese and American assistance to East Timor may vary in the future, due to political or economic interests, Portugal will always make East Timor one of its development assistance priorities as a result of the strong historic and cultural ties that connect both countries and also for diplomatic reasons.
In a different perspective, the fact that East Timor has a sovereign wealth fund – the Petroleum Fund – helps the government to address the country’s needs through a national financial tool. However, due to the instability of the international oil price and
the fall in production, the direct receipts which feed the PF may diminish and the annual return obtained in the international financial market might fall as well.
Comparing the two main financing sources, Table 18 shows the greater instability linked to the oil income compared to ODA. Due to the latter importance in absolute value, and despite the fact that East Timor may be considered an oil and gas producing country, ODA cannot be discarded, and if East Timor is an oil dependent economy, it will remain an aid dependent country as well.
References
Ali, M.; Banks, G. and Parsons, N. (2015), “Why Donors Give Aid and to Whom? Critique of the Historical and Contemporary Aid Allocation Regime”, The Dialogue, vol.X, nº2, pp. 116-131
Australian Government. (2009), Australia - Timor-Leste Country Strategy 2009-201, Sydney
Australian Government (2014), Evaluation of Australian Aid to Timor-Leste, Department of Foreign Affairs and Trade, Office of Development Effectiveness, Sydney
Banco de Portugal (2019), Evolução das Economias dos Palop e de Timor-Leste 2018/19, Lisboa, Portugal
Barreto Soares, L. D. (2011), Foreign Aid for State-Building: A Comparative Study of Australian and Chinese Aid Programs in Timor-Lest, The Center for International Studies of Ohio University, Ohio, USA
Bernardino, L. (2018), “The Portuguese contribution to the creation of the Falintil– defence forces of East Timor”, Journal of the Spanish Institute for Strategic Studies, nº12, pp. 299-323
BLUNT, P. (2009), “The political economy of accountability in Timor-Leste: implications for public policy”, Public Administration and Development, vol. 29, pp. 89–100
Chenery, H. and Strout, A. (1966), “Foreign assistance and economic development”, The American Economic Review, vol. 56, nº4, part 1, pp.679-733
Chong, A. and Gradstein, M. (2006), Who's Afraid of Foreign Aid? The Donors' Perspective, Working Paper, No. 556, Inter-American Development Bank, Research Department,
Washington, DC
Curtain, R. (2018), Remittances biggest export earner for Timor-Leste after oil, retrieved from https://devpolicy.org/remittances-biggest-export-earner-for-timor-leste-after-oil-20180322/
DGE (2019), 1st Quarterly Statistical Indicators, Direcção Geral de Estatística,
http://www.statistics.gov.tl/wp-content/uploads/2019/07/REVISAUN-QSI-Q12019.pdf
Esteves, P. and Assunção, M. (2014), “South-South Cooperation and the international development battlefield: between the OECD and the UN”, Third World Quarterly, Vol. 35, No. 10, 1775-1790
Fuchs, A. and Rudyak, M. (2019), “The Motives of China’s Foreign Policy”, in Zeng, K. (ed), Handbook on the International Political Economy of China, Handbooks of Research on International Political Economy series, Edward Elgar Publishing Ltd, UK
Global Partnership for Effective Development Co-operation. (2016). Monitoring Profile: Timor-Leste (October). New York: UNDP.
Gounder, R. (1994), “Empirical Results of Aid Motivations: Australia’s Bilateral Aid Program”, World Development, Vol.22, No.1, pp. 99-113
Government of Timor-Leste. (2017), History, retrieved from Government of Timor-Leste: http://timor-leste.gov.tl/?p=29&lang=en
Grindle, M. S. (2007), “Good Enough Governance Revisited”, Development Policy Review, 533-574.
Gulrajani, N. (2017), “Bilateral Donors and the Age of the National Interest: What Prospects for Challenge by Development Agencies”, World Development, vol. 96, pp.375-389
Harrigan, J. and Wang, C. (2011), “A New Approach to the Allocation of Aid Among Developing Countries: Is the USA Different from the Rest?”, World Development, Vol. 39, No. 8, pp. 1281-1293
IMF (2019), Democratic Republic of Timor-Leste - IMF Country Report, nº 19/124, May, Washington, USA
IMF (2019a), IMF Staff Concludes 2019 Article IV Consultation Mission to Timor-Leste, January 25, Washington, DC
IMF (2019b), East Timor: Debt Sustainability Analysis, Staff Report for the 2019 Article IV Consultation, March 8, Washington, DC
MCGREGOR, A. (2007), “Development, Foreign Aid and Post-development in Timor-Leste”, Third World Quarterly, Vol. 28, No. 1, pp 155 – 170
Ministry of Finance (2007-2019), Timor-Leste Petroleum Fund - Annual Report, Petroleum Fund Administration Unit, Dili, Democratic Republic of Timor-Leste
Ministério do Plano e das Finanças (2006), Petroleum Fund 2005-06 Annual Report, Dili, Democratic Republic of Timor-Leste
Mishra, T.; Ouattara, B. and Parhi, M. (2011), “International Development Aid Allocation Determinants”, The Journal of World Economic Review, Vol.6, No.2, pp. 201-2013
Neves, G.N. (2006), The paradox of aid in Timor–Leste, paper presented at seminar "Cooperação Internacional e a Construção do Estado no Timor-Leste", University of Brasilia, Brazil, 25-28 July 2006
Norman, J. (2017), Australia and Timor-Leste strike deal to end maritime boundary dispute, retrieved from ABC Australia: http://www.abc.net.au/news/2017-09-02/timor-leste-maritime-boundary-with australia-agreement/8866776
Nygaard-Christensen, M. (2016), Timor-Leste in 2015: Petro-Politics or Sustainable Growth?, Southeast Asian Affairs, Institute of Southeast Asian Studies, Yusof Ishak Institute, Singapore, pp. 347-359.
Observador (2017), Incêndios: maior apoio financeiro para vítimas veio de Timor, retrieved from Observador: http://observador.pt/2017/10/09/pedrogao-maior apoio-financeiro-para-vitimas-veio-de-timor/