BUSINESS PROCESS ANALYSIS OF AN
OPTOELECTRONIC SECTOR COMPANY
Constanze Charlotte Engelhardt
Process modeling and analysis in a German SME
Work Project presented as partial requirement for obtaining
the Master`s degree in Information Management
NOVA Information Management School
Instituto Superior de Estatística e Gestão de Informação
Universidade Nova de Lisboa
BUSINESS PROCESS ANALYSIS OF AN OPTOELECTRONIC SECTOR
COMPANY
PROCESS MODELING AND ANALYSIS IN A GERMAN SME
by
Constanze Charlotte Engelhardt
Project Work presented as partial requirement for obtaining the Master`s degree in Information Management, with a specialization in Information Systems and Technologies Management Advisor: Vítor Duarte dos Santos, PhDMarch 16, 2018
ACKNOWLEDGEMENTS
First of all, I would like to thank my advisor, Professor Vítor Duarte dos Santos, for the enormous experiences shared, precious help, availability, understanding, wise advice and support at all times. With his support, it was possible to carry out this work project. Many thanks to all employees of the company under study, for providing the necessary resources for the development of this work project. Especially to Leon Kurz, for his availability, help and time. Thanks to my family and friends, for always standing by and encouraging me to believe in my abilities to achieve my goals. A special thanks to my mother, who was always available for advice and action. She cared for me and above all, believed in me. Finally, I would like to sincerely thank everyone who supported me unconditionally in completing this work project, because it is yours too. To all, thank you.
ABSTRACT
Business Process Management (BPM) is applied in many enterprises and is well known for improving the competiveness and sustainability of a business. However, in Small and Medium-sized Enterprises (SMEs) BPM practices are alarmingly low, despite of the potential positive impacts BPM yields. The problem is that SMEs often have limited resources, the absences of a cross-functional mind-set and a lack of strategic clarity. BPM reduces operational inefficiencies and supports innovative practices which are essential for success, if adopted as a management paradigm across the enterprise. This work project will analyze the current state of value-added business processes in a German high-tech SME, along with its problems and inefficiencies to create standardized models for business operations. Therefore, the goal of this work is to explore the potential of BPM and current technologies, based on the analysis of a company that operates as a high-tech enterprise in the optoelectronic sector.
KEYWORDS
BPM; Optimization; BPMN; Modeling; High-tech SME
INDEX
1. Introduction ... 1
1.1. Context ... 1
1.2. Motivation ... 2
1.3. Objectives ... 3
2. Work plan ... 4
2.1. Project Phases ... 4
2.2. Tools / Resources ... 5
2.3. Chronogram ... 6
3. Literature review ... 7
3.1. Business Process Management ... 7
3.1.1. Concepts ... 7
3.1.2. BPM Life Cycle ... 9
3.1.3. Process Architecture ... 10
3.1.4. Process modeling ... 11
3.1.5. Modeling of the current state „AS-IS“ and future state “TO-BE” ... 12
3.1.6. Performance measurement ... 13
3.1.7. Transformation ... 15
3.1.8. Business Process Model and Notation (BPMN) ... 17
3.2. Optoelectronic Industry ... 19
3.2.1. History ... 19
3.2.2. Current Situation ... 20
3.3. Recent Developments and Future Trends in Manufacturing ... 21
3.3.1. Industry 4.0 and IoT (Internet of Things) ... 21
3.3.2. Enterprise Resource Planning (ERP) and Cloud Computing ... 22
3.3.3. Robotic Process Automation (RPA) ... 23
3.3.4.
Automatic Identification (Auto-ID) systems
... 23
3.3.5.
Wireless communication networks
... 24
3.3.6. Fog Computing ... 26
3.3.7. Quality management ISO9001 ... 27
4. Work project ... 28
4.1. Examination of the company ... 28
4.2. Existing processes ... 31
5. Project Development ... 33
5.1. Process Architecture ... 33
5.1.1. Identification of Processes ... 34
5.2. Specification of Entities ... 37
5.2.1. Actors ... 37
5.2.2. Systems ... 38
5.2.3. Documentation ... 40
6. Process modeling ... 42
6.1. Process “NT 940” ... 42
6.1.1.
Process “Goods receipt (general)”
... 43
6.1.2.
Process “Assembling of goods (NT 940)”
... 44
6.1.3.
Sub-Process “Tube and housing assembling”
... 45
6.1.4.
Process “Order fulfilment”
... 46
6.1.5.
Process “Goods complement”
... 47
6.1.6.
Process “Goods output (general)”
... 48
6.2. Process “AN/PVS31” ... 49
6.2.1.
Process “Goods receipt (ITAR)”
... 50
6.2.2.
Process “Loaned PVS31”
... 51
6.2.3.
Process “PVS31 complement”
... 52
6.2.4.
Process “Goods output (ITAR)”
... 53
6.3. Process “General (Services)” ... 54
6.3.1.
Process “Repair L3 devices”
... 55
6.3.2.
Sub-Process “Evaluation”
... 56
6.3.3.
Sub-Process “Quote and material procurement”
... 57
6.3.4.
Sub-Process “Goods receipt (L3 spare parts)”
... 58
6.3.5.
Sub-Process “Repair pass”
... 59
6.3.6.
Process “Repair NT devices”
... 60
6.3.7.
Process “Loaned devices”
... 61
7. Critical review of processes and improvements ... 62
7.1. Process “NT 940” ... 63
7.2. Process “AN/PVS31” ... 69
7.3. Process “General (Services)” ... 71
7.4. Discussion of improvements ... 75
8. Conclusion ... 78
8.1. Analysis of the results ... 78
8.2. Limitations ... 78
8.3. Future work ... 79
BIBLIOGRAFY ... 80
LIST OF FIGURES
Figure 2.1- Project Phases ... 4
Figure 3.1- BPM Lifecycle ... 9
Figure 4.1 - Organizational structure of the company ... 29
Figure 5.1 - Overall Processes of the company ... 33
Figure 6.1 - Process “Goods receipt (general)” ... 43
Figure 6.2 - Process „Assembling of goods (NT 940)“ ... 44
Figure 6.3 - Sup-process “Tube and housing assembling” ... 45
Figure 6.4 - Process „Order fulfilment“ ... 46
Figure 6.5 - Process “Goods complement” ... 47
Figure 6.6 - Process “Goods output (general)” ... 48
Figure 6.7 - Process “Goods receipt (ITAR)” ... 50
Figure 6.8 - Process „Loaned PVS31“ ... 51
Figure 6.9 - Process “PVS31 Complement” ... 52
Figure 6.10 - Process „Goods output (ITAR)“ ... 53
Figure 6.11 - Process „Repair L3 devices“ ... 55
Figure 6.12 - Sub-process „Evaluation“ ... 56
Figure 6.13 - Sub-process „Quote and material procurement“ ... 57
Figure 6.14 - Sub-process „Goods receipt (L3 spare parts)“ ... 58
Figure 6.15 - Sub-process „Repair pass“ ... 59
Figure 6.16 - Process „Repair NT devices“ ... 60
Figure 6.17 - Process „Loaned devices“ ... 61
LIST OF TABLES
Table 2.1- Chronogram ... 6
Table 3.1 - Work process documented, and documentation is kept up to date. ... 11
Table 3.2 - Are process improvement programs in place? ... 15
Table 3.3 - Basic Modeling Elements ... 19
Table 4.1 - Products offered by the company ... 29
Table 4.2 - Procedural instruction of the company overview ... 31
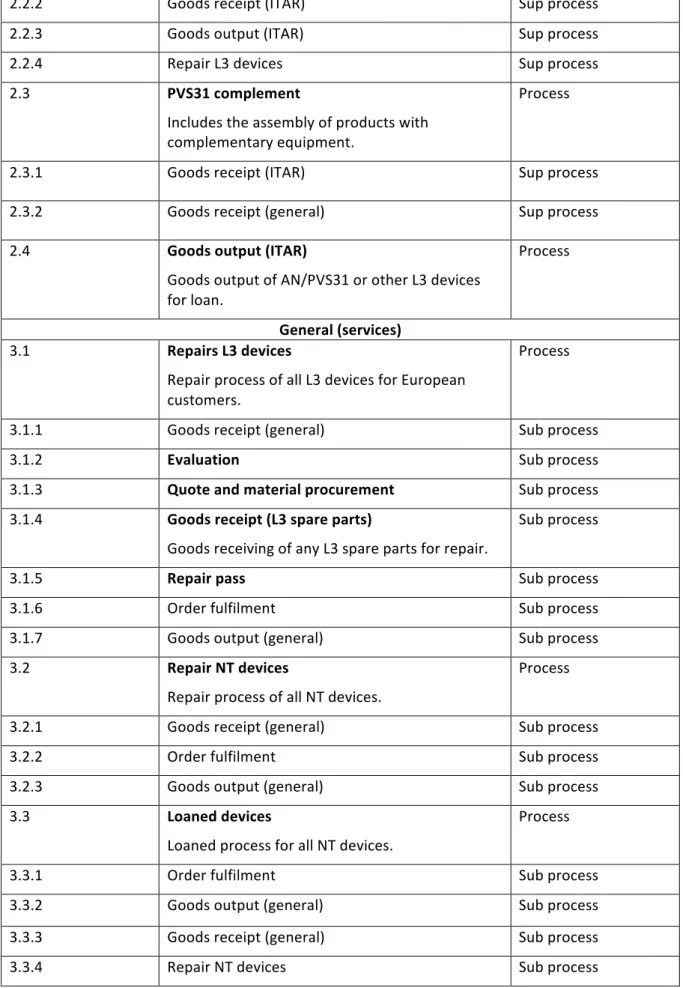
Table 4.3 - Procedural instructions of the company detailed ... 32
Table 5.1 - Case types and business function of image intensifier tubes ... 34
Table 5.2 - Identified processes of the company ... 36
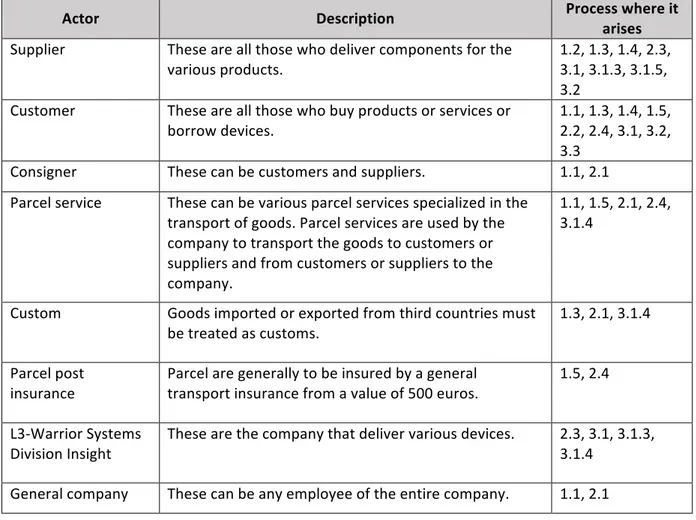
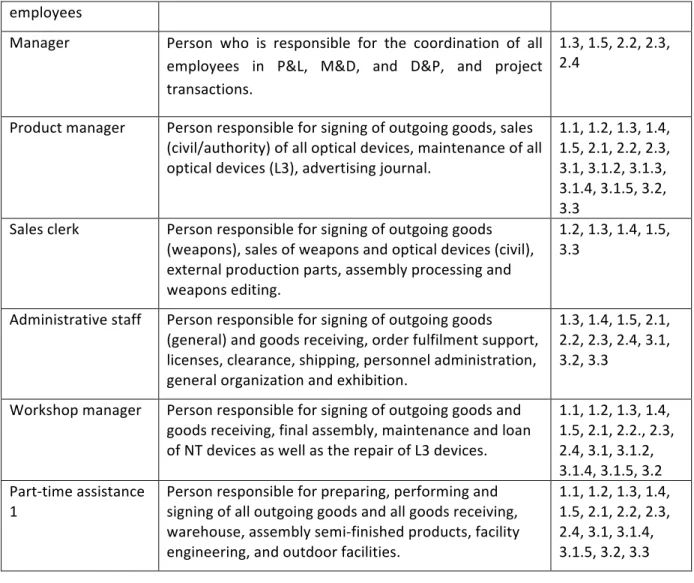
Table 5.3 - Actors of the company ... 38
Table 5.4 - Systems of the company ... 40
Table 5.5 - Documents of the company ... 41
Table 7.1 - Critical review and improvement proposals oft the company “NT 940” ... 68
Table 7.2 - Critical review and improvement proposals oft the company “AN/PVS31” ... 70
Table 7.3 - Critical review and improvement proposals oft the company “Services (general)”
... 74
Table 7.4 - Technologies for proposed improvements ... 77
LIST OF ACRONYMS AND ABBREVIATIONS
A Accounting ABC Activity Based Costing ABM Activity Based Management ABPMP Association of Business Process Management Professionals BPEL Business Process Execution Language BPM Business Process Management BPTrends Business Process Trends BPMI Business Process Initiative BPMN Business Process Management Notation BPR Business Process Reengineering C Commercial CPS Cyber-Physical Systems CPPS Cyber-Physical Production Systems D&P Development and Production ERP Enterprise Resource Planning g.A. General Accounting IaaS Infrastructure as a Service ICT Information and Communications Technology IoT Internet of Things ITAR International Traffic in Arms Regulations KPIs Key Performance Indicators M&D Marketing and Distribution NT Night Tronic OMG Object Management Group RF Radio FrequencyRFID Radio Frequency Identification PaaS Platform as a Service P&L Procurement and Logistics QMS Quality Management System RMA Return material authorization RPA Robotic Process Automation SaaS Software as a Service SME Small and Medium-sized Enterprises TQM Total Quality Management Wfm Workflow Management WLANs Wireless Local Area Network WMANs Metropolitan Area Networks WPANs Wireless Personal Area Networks WSN Wireless Sensor Network WWANs Wireless Wide Area Networks UML Unified Modeling Language
1. INTRODUCTION
Nowadays, the turbulent environment is more demanding than ever before and organizations have always had to adapt to a changing world (Lankhorst & Matthijssen, 2016). In recent years, it has been noticed that enterprises are increasingly focusing on their business processes (Ho, Jin, & Dwivedi, 2009; Ko, Lee, & Wah Lee, 2009). Business processes are an asset of corporations which have direct impact on the attractiveness of products and services, as perceived by the market. Furthermore, business processes also determine tasks, jobs and responsibilities, as well as shaping the work of each employee. As a fact, processes determine the potential of an enterprise to adapt to new cases and to comply with fast growing number of legislative requirements. They affect the revenue potential as much as they shape the cost profile of an enterprise (Dumas, Mendling, La Rosa, & Reijers, 2012).
The important role of processes has been widely recognized, but an overall discipline promoting the importance of process as well as providing integrated Business Process Management (BPM) mythologies has been lacking for a long time. A major reason of this may be why process thinking is still not as common as cost awareness, or employee focus as well as ethical considerations (Vom Brocke & Rosemann, 2010). Furthermore, with the growth of a company, they spread their geographic presence to cover more regions across the world. Therefore, business processes become more complex, inefficient and expensive. There are many reasons, such as lack of visibility about processes, poor monitoring capabilities and others, which cause inefficiency along the processes (Ramaraju & Juturu, 2007). Although many organizations are involved in process initiatives, only a small number of companies follow a holistic approach and focus on the level of organizational processes (Neubauer, 2009).
1.1. C
ONTEXTThe company under study, namely IEA Mil-Optics is focusing their operations on their day-to-day business. In the current state, BPM is not practiced yet in the company and there are only a few processes documented. IEA Mil-Optics is a high-tech company, producing night vision products and acts as a supplier for military and law-enforcement. It is one of the leading companies in the sector of optoelectronics, characterized by high quality requirements for all products. Particular attention is paid towards new technologies, which are pursued through the continuous development of their own know-how system solutions. Due to the increased requirements in the field of security and the fight against global terrorism, the market is expected to grow strongly in the future (Löffler, 2017). In this work project, the critical situation of several value-added business processes is analyzed by modeling respective existing processes. Processes are considered from purchasing through to sales of various products. After that, improvement opportunities are suggested for each business operation regarding the use of current technologies, to optimize the existing processes throughout the company. The main advantages for the company after the work project will be a better understanding of how the work is performed, as well as it is intended to convey a better understanding about the responsibilities and tasks of the individual employees. Further, value will be added to the transformation of processes to meet the objectives of the company.
1.2. M
OTIVATIONTo be a competitive organization, an enterprise needs to assure that all processes that make up a common value chain are integrated and support each other (Harmon, 2007). According to O’Neill & Sohal (1999), enterprises need to align all functional areas to be accurately integrated. This refers to the importance of cross functional teams, where the value of BPM is recognized as a crucial source for competitive advantage. In recent years, many concepts have been created regarding BPM. Thereby, concepts as workflow management (Wfm) and business process reengineering (BPR) have been established. Nowadays, BPM is a topic which is increasingly moving into focus (Ko et al., 2009). Hammer (1990a) describes the role of BPM as crucial in creating sustainable competitive advantage and as establishment as a novel approach to the management of processes, with the aim of creating radical improvements in performance. In a more recent case study, Dave (2017) investigates a construction company using semi-structured interviews to study the processes of six departments. The study aims to demonstrate a need for a structured business process improvement while organizational processes are restructured. Thus, the study suggests that also small business units and its processes can affect the overall value chain in a major way. Therefore, stressing the importance of analyzing process interdependencies between organizational units (Dave, 2017).
In every industry sector, it is necessary to be a competitive organization to counteract the competition and to meet customer requirements. With emerging technologies, new or improved products will be offered on the market. Until now, IEA exists without worrying about clients, as the company increases its sales continuously. Therefore, only small changes as well as extensions of departments in the company were made. To meet the increased demand of the existing clients, it is planned to employ more workers. To be competitive in the future, it is indispensable to improve inefficient processes with the intention to successfully implement future enhancements and structural changes. To define a new process or transform those that already exist, the first step is to understand the current state of the company and the business (Weske, 2007). For achieving a better understanding of the business processes, the explicit representation is the core concept. If activities and their relationships are identified and represented by business process models, stakeholders can communicate these processes in an efficient and effective manner, and potentials for improving them can be developed.
At the beginning of this work project, the documented processes are analyzed, followed by a survey of the value-added processes through interviews with various employees of the company. Afterwards, the process modeling of several products is done with the intention to criticize them and proposing appropriate improvements. The main advantages for the company is a better understanding of the performed operations and their relationships within the company. Another advantage is a better understanding of the responsibilities and task of each individual employee. Furthermore, cost, time and the need of resources of the performed operations can be reduced after the optimization of the existing processes. Further advantages and benefits of this work project for the company are: growth of productivity, interdepartmental communication and coordination enhancement, increased efficiency and quality, improved service, higher seed in process execution, monitoring of results and identification of inefficiencies. According the Association of Business Process Management Professionals (ABPMP, 2009), it is important to understand the maturity of the organization in process management, which will help to define the level of analysis preparation needed.
Therefore, ABPMP (2013) defines process maturity as an trait and capability that defines the current state of the enterprise’s move to understand and manage processes. Assessments can be useful for establishing a baseline of existing capabilities and to align the organization on the current state. Furthermore, they are also useful to identify and address any gaps. The framework from Forrester Research Process divides Process Maturity into five levels, as following: 0. - Nonsexist: Not understood, not formalized and need is not recognized. 1. - Ad hoc: Occasional, not consistent, not planned and disorganized. 2. - Repeatable: Intuitive, documented, understood and occurs as needed. 3. - Defined: Documented, predictable, evaluated, occasionally and understood. 4. - Measured: Well-managed, formal, often automated and evaluated frequently. 5. - Optimized: Continuous and effective, integrated, proactive and usually automated.
The company under study is still in an early stage of maturity, namely the level of repeatable. Therefore, the position of the company in this process journey, can help properly set performance measurement capability expectations and shows a clear road to improve monitoring, measurement, and reporting (ABPMP, 2013).
1.3. O
BJECTIVESConsidering the problems identified previously, the focus of this work project is placed on the modeling and analysis of several value-added business processes for the company, along with its problems and inefficiencies to create standardized models for internal business operations. Therefore, the goal of this work is to analyze the existing processes in different departments and to provide proposals for improvements. This is done with various products along the value chain from purchasing to sales, in different departments such as procurement, logistics, production and workshop. Following, an evolutionary approach as well as using an BPM approach and current technologies, improvements opportunities are suggested and if correctly implemented, costs, time and resources can be reduced, as well as improvements of operational excellence. To achieve this goal, further specific objectives are: 1. Literature review to apply the best improvements; 2. Collecting and studying of existing documented processes; 3. Identifying and definition of key processes in the company which should be analyzed; 4. Survey of the identified processes in the company; 5. Modeling of the defined processes with BPMN 2.0; 6. Critical analysis and proposals for improvements of the defined processes;
7. Further work, transformation of value-added processes based on the analysis presented in the project that best fits the business objectives.
2. WORK PLAN
The following chapter presents the project phases to reach the objectives, as well as the used tool. Furthermore, the schedule for the work project is introduced.2.1. P
ROJECTP
HASESFigure 2.1 presents the four fundamental stages of the project. The detailed description of each stage follows the figure. Figure 2.1- Project Phases Source: Own figure To achieve the main goal, the following specific objectives should be attained: • Goal settings To achieve the goal, the project begins with an analysis of the current company situation, in terms of business processes. In this first phase, value-added processes in different departments with various products are identified for the later proposed improvements. After that, key processes are defined for modeling and analysis of business processes. Existing business processes documents are studied and used as a starting point for the later modeling. • Literature review In the second phase, a literature review which introduces the most important theoretical background of BPM is conducted, to understand the relevance of the topic as well as to anticipate the main difficulties that may arise during the project. The literature review helps to find the best way to apply process improvement to suit the most appropriate BPM framework for the company. The research is necessary for the correct modeling of business processes with critical success factors. The presented improvements and recent trends in manufacturing are used to guide the proposed improvements.
• Survey and modeling of processes
Value-added processes of the company are modeled using business process modeling notation (BPMN) and the Bizagi Process Modeler. One of the main problem in the company is that they have no graphical representation of any processes. They only have several documented processes, written in several Word documents or PowerPoint slides as bullet points. However, because of some new guidelines and additional processes, it’s been decided to make a new survey of respective processes. For this work project, various methods for gathering information are used. The first method is the observation of daily business operations, which is done with responsible employees of defined processes. By this, day by day observation prompted several insights, leading to the next methods: Interviews and workshops with respective employees.
The information gathered from these interviews is used for modeling, as well as analyzing the problems and inefficiencies which are identified throughout the company.
• Analysis of processes and proposals for improvement
In this phase, the critical situation is analyzed and opportunities for improvement are proposed under the BPM approach and current technologies. Based on the analysis, inefficiencies, redundant activities, inconsistent information and processes which aren’t measured, controlled or are too time consuming, are revealed.
2.2. T
OOLS/
R
ESOURCESAccording to Davis & Brabänder (2007), BPM is described as a structured management approach that uses management practices, policies, methods, metrics and software tools. BPM aims to organize all aspects of the design, specification, implementation, operation, measurement, analyzes and optimization of business processes to effectively and efficiently reach business objectives. A number of process modeling tools were evaluated, including Bizagi Process Modeler, ARIS Express, BPMN.io., Modelio, Camunda and ADONIS:Community Edition. The chosen tool for this work project is Bizagi Modeler 3.1. Bizagi. BPM Suite contains a total of three sub-tools: Bizagi Modeler (design process maps) Bizagi Studio (build process apps), and Bizagi Engine (run Bizagi enterprise-wide). The Bizagi Modeler suits all necessary requirements for this project. It is a free business process modeling and documentation tool, enabling visual design, document and the simulation of business processes in an easy way by using BPMN (Business Process Model and Notation). It enhances productivity, efficiency and promotes sustainable growth over the long term. Furthermore, BPMN models can be extended to BPEL (Business Process Execution Language) to automate processes (Bizagi, 2014). The main benefits of Bizagi Process Modeler are (Bizagi, 2014):
• Easy to use, no programming skills required. Innovative interface due drag and drop; • Free;
• Documents can be exported into different formats, such as Word, PDF, Web pages, Share Point or Wiki;
• The tool is based on BPMN notation;
2.3. C
HRONOGRAMTable 2.1 describes the schedule of the work project.
2017 2018
Section Aug Sep Oct Nov Dec Jan Feb Mar Apr
1. Introduction Definition of objectives and motivation of the project Problem definition 2. Literature review 3. Interviews and collection of existing flowcharts 4. Survey of value-added processes to model 5. Process modeling of defined processes 6. Critical review of processes and improvements 7. Results and discussion 8. Conclusion 9. Update of literature review Supervisors Review Milestones M1 M2 M3 M4/5 Table 2.1- Chronogram Source: Own drawing Milestones: 1. Delivery of proposal for Project Work; 2. Information for modeling received; 3. Process modeling and critical review finished; 4. Preliminary report; 5. Project Work report finished.
3. LITERATURE REVIEW
This chapter presents the necessary concepts for the development of the work project. It starts with the exploring of the BPM standards and related fields, such as BPM life cycle and BPMN as well as a brief description of the optoelectronic sector. Furthermore, recent developments and future trends in manufacturing are elaborated.
3.1. B
USINESSP
ROCESSM
ANAGEMENT3.1.1. Concepts
Processes are existing everywhere and in every organization as in governmental, non-profit organization, or enterprises, where a number of processes have to be managed (Dumas et al., 2012). The actual process improvement methods affiliate their roots back to the work done by (Porter, 1985) on value chains, Hammer (1990a) work on business process reengineering (BPR) and Davenport & Short (1990) work on information technology and business process redesign. The latter two works address the integration of technological innovation within business processes and are trying to align business strategies with changing technological trends (Dave, 2017). The development of process-oriented thinking arises from the development of Total Quality Management (TQM) at Toyota and other Japanese manufacturing companies (Deming, 1982), as well as the improvement technique “Lean Thinking” (Dave, 2017). (Ohno, 1982) was the pioneer of “Lean Thinking”, he identified seven different waste categories within the production process and proposed that these should be eliminated or optimized to improve process efficiency (Dave, 2017). Recently, TQM processed into the process optimization strategies of Six-Sigma and Lean Manufacturing (Ho et al., 2009).
The business process reengineering (BPR) movement began in 1990 with the publications of two papers: Michael Hammer`s “Reengineering Work: Don`t Automate, Obliterate” and Thomas Davenport and James Short`s “The New Industrial Engineering: Information Technology and Business Process Redesign” (Davenport & Short, 1990; Hammer, 1990). Theorists like Hammer, Champy, and Davenport emphasize that companies need to think in terms of comprehensive processes, which is similar to Porter`s value chain (Harmon, 2007). Hammer & Champy (1993) defined BPR as a fundamental rethink and radical redesign of business processes to generate improvements in critical performance measures, such as cost, quality, service and speed. Moreover, managing business processes is also influenced by information technology (IT) which can be retraced to Hammer, stating that organizations should “reengineer” their business with the use of modern information technology to radically redesign their business processes in order to achieve dramatic improvements in their performance (Hammer, 1990). BPR and BPM must be distinguished. Whereas the former refers to the radical reconstruction of existing business processes, the latter is more iterative, incremental and practical related in fine-tuning business processes (Ko et al., 2009). Kohlbacher (2010) describes the difference between BPR and BPM as follows: BPR is a single project concerned with the radical redesign of business processes, whereas BPM refers to the ongoing management and optimization of an organization based on its business processes. Among the various definitions of an process, a classic definition is given by ABPMP (2009), defining a process as a set of activities or behaviors performed by humans or machines for achieving a goal, or for solving a specific problem.
Dumas et al. (2012) describes a business process as a collection of inter-related activities, events and decision points which include several actors and objects, and lead to an outcome with value at least for one customer. This definition is related to ABPMP (2009), which defines a business process as an “end-to-end” job, going beyond functional limits and crossing any functional boundaries to generate value for the client. In a further notion, BPM does not only covers the representation of business processes, but also additional activities which contain concepts, methods and techniques to support the design, administration, configuration, enactment, and analysis (Weske, 2007). Furthermore, BPM is described as structured approach that is made in an organization to continuously analyze and improve fundamental activities such as manufacturing, marketing, communications and other key elements of a company’s operations (Zairi, 1997).
The ABPMP (2013) views BPM as a management discipline that treats business processes as assets. Because of this, organizational goals can be achieved through the definition, engineering, control and commitment to the continuous improvement of business processes. BPM integrates IT and business process expertise with the aim of transforming isolated business efforts into integrated and measurable cross-functional activities, in order to deliver operational and strategic competitive advantage (Lederer Antonucci & Goeke, 2011). The principal idea in BPM is to optimize an organization’s business process by eliminating activities that do not add value and to improve process fluency within the limits of organizational functions (Kujansivu & Lönnqvist, 2008), in an efficient and effective manner (Lederer Antonucci & Goeke, 2011). According to Peppard (2000), different departments in an organization still operate as silos and as a result horizontal end-to-end customer processes are still not well understood or defined throughout the whole company. Companies should embrace change, it is one of the means for handling the challenge of improving the company’s business processes for optimizing performance and enhance competitive advantage (Trkman, 2010).
Silvestro & Westley (2002) have determined the process of two UK-based companies. One was the division of a large multi-national electronics company, and the other a major retail organization. Because of the BPR, the companies could achieve increased market responsiveness, better collaboration between functions and alignment of organizational objectives. However, there were also some disadvantages of the BPR initiatives. They identified a duplication of functional expertise and increased operational complexity, resulting in an escalation of cost, the emergence of horizontal silos. In addition, there are inconsistencies in the execution of functional decisions between processes and general erosion of the efficiency of the operations network (Silvestro & Westley, 2002). According to these limitations, the adoption of BPM alone will not bring any contribution to either their operational or strategic goals of an organization. Moreover, BPM can help in the execution of a strategic program by enabling a better match between the organizational strategy and the their business processes (Trkman, 2010). In fact, BPM inherits from the continuous improvement philosophy of Total Quality Management (TQM), as well as other principles and techniques such as operational management, Lean and Six Sigma. BPM combines the named philosophies with the capability offered by modern IT, hence to an optimal alignment with business processes and the performance objectives of an organization (Dumas et al., 2012).
3.1.2. BPM Life Cycle
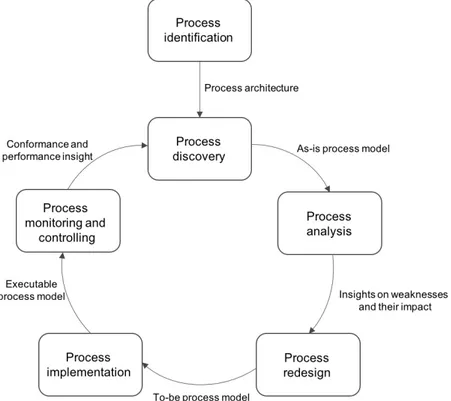
As Dumas et al. (2012) defined BPM, “as a body of methods, techniques and tools to discover, analyze, redesign, execute and monitor business processes” (Dumas et al., 2012, p. 5). They reflect this definition as the fact that business processes are the focal point of BPM, which involves different phases and activities in the lifecycle of business processes. In the literature, there are several BPM lifecycles models available which are different from the one proposed by ABPMP (2009). The BPM lifecycle by ABPMP (2009) is structured in six steps and establishes those activities that comprise managerial practice in BPM. These six steps include: planning, analysis, design and modeling, implementation, monitoring and control as well as refinement. The lifecycle model proposed by Dumas et al. (2012), views BPM as a continuous cycle comprising with the following phases (see fig. 3.1). This lifecycle is best suited to develop the work project, because of the more detailed steps. The phases of the lifecycle are described in the following section. Figure 3.1- BPM Lifecycle Source: (Dumas et al., 2012, p. 21) Process identification
In the first phase of the BPM lifecycle, a business problem arises, and other relevant processes related to the problem are identified, delimited and linked. The result of these phase is a new or updated process architecture, which provides a global understanding of processes at the organization and its relations. Depending on the case, the identification of processes can be done in parallel with performance measure identification.
Process discovery
In the second phase (“AS-IS” process modeling), documentation is done of the current state of each relevant processes. This can be done in the form of one or more “AS-IS” process models.
Process analysis
In the third phase, the identification and documentation of problems associated with the “AS-IS” processes takes place, and when possible quantified using performance measures. The result is a structured collection of issues, which are normally prioritized according to their impact, and occasionally also in terms the estimated effort required to resolve them. Process redesign In the phase of the process redesign (process improvement), process changes are identified. These can help solve the identified issues in the previous phase and enable the organization to meet the performance objectives. The basis for the next phase is given through the result of this phase with the “TO-BE” process model. Process implementation In this phase, the preparation and execution are done with the required changes to move from the “AS-IS” process to the “TO-BE” process. This phase comprises two aspects which are organizational change management and process automation. The former one is related to a set of activities required to change the way of working with all participants who are involved in the process. Process automation is the development and deployment of IT systems or enhanced versions of existing IT systems, that supports the “TO-BE” process.
Process monitoring and controlling
When the redesigned process is running, the next phase is to collect and analysis of data to determine the level of success of the process performance, to meet the performance measures and performance objectives. Once inefficiencies, discrepancies, barriers and errors have been identified, corrections are initiated. If new issues arise, it will trigger a repeated life cycle of the BPM process.
3.1.3. Process Architecture
In the phase of process identification it is necessary to define the set of business processes and to establish a clear criteria for prioritizing them (Dumas et al., 2012). The process architecture, which represents the business processes and their interrelations is the output of the process identification. There are different criteria which can be taken into consideration for determining which chain of operations is forming an independent business process and which ones are part of another process. Accordingly, there are several sights on categorizing a business processes. The value chain model from Porter is one of the most influential ones, which distinguishes two categories of processes: core processes (primary activities) and support processes (support activities). Core processes include the essential value creation of an organization such as production of goods and services for which customers pay.Furthermore, it covers inbound logistics, operations, outbound logistics, marketing and sales, and services. Support processes are necessary in order to facilitate the execution of the primary processes. This comprise infrastructure, human resources, technology development, and procurements. This set of two categories can be extended by a third one which is the management process. Therefore, from a strategic point of view, primary, support, and management processes should be distinguished. There are several approaches for defining a process architecture in literature. The approaches developed by Dijkamn leads to a process architecture on level one along two dimensions: case types and business functions. A case type classifies the types of cases that are handled in an organization such as products or services that is delivered to a customer. A function classifies the function of an organization, in other words something that on organization does. They consist of one or more sub-functions (Dumas et al., 2012). In order to be a competitive organization, it is necessary to assure that all processes that make up a common value chain are integrated and support each other (Harmon, 2007).
3.1.4. Process modeling
Various organization have realized the importance of process modeling, but there are still organization who have concerns regarding time and effort in developing and maintaining process models (Ramaraju & Juturu, 2007). In 2005 the BPTrends (Business Process Trends) conducted the first market survey “The State of the BPM Market”, whereas the sixth and latest one was published in 2015 with a response of over 100 respondents throughout the world (Harmon & Wolf, 2016). The answers to the question (see table 3.1) “Are business processes documented and kept up to date?” of 2005 and 2015 are similar. Most organization “Occasionally” keep their process documented. The level of “Most Times” were indicated with 14% in 2015, which is a lower value compared to 2005 with 23%. Are business processes documented and kept up to date? Please indicate your organization´s overall level of performance. 2005 2015 Never (0%) 4% Occasionally (1-30%) 46% 50% Frequently (31-60%) 24% 29% Most Times (61-99%) 23% 14% Always (100%) 4% 4% Total 97% 100% Table 3.1 - Work process documented, and documentation is kept up to date. Source: (Harmon & Wolf, 2016, p. 4) At various stages of the BPM lifecycle, business process models are crucial. There are many reasons why to model a process, such as a simple understanding of the process as well as the sharing of our understanding of the process with the people who are involved (Dumas et al., 2012).
In 1946, flow diagrams were one of the first approaches to visualize a business process, developed by Goldstine and Neumann (Rosemann, 2006). Historically, there is a broad variety of different diagramming notations available for describing a process. One of the first notation was introduced by Geary Rummler and Alan Brache in their popular book, “Improving Performance” in 1990. The notation was called “Rummler-Brache” notation and further formalized in the IBM notation called “LOVEM”. Some of the Rummler-Brache concepts were linked into the Object Management Group’s UML Activity Diagrams. In 2004, a new notation was created, the “Business Process Modeling Notation” (BPMN), through the Business Process Initiative (BPMI) group who brought most of the major business process modeling tools vendors together (Harmon, 2007).
According to ABPMP (2009), process modeling includes a set of skills and processes that provide insights and understanding and enable analysis, design and performance measurements. Furthermore, an end-to-end perspective of organizations primary, supporting and management processes are provided (ABPMP, 2009). The model of a process enables an organization to analyze all relationships between their products, processes, people and systems, and helps to fight complexity. Question can be answered such as how different parts are connected, who is responsible for what and what are the essential business processes, as well as what is redundant (Lankhorst & Matthijssen, 2016). Rosemann (2006) mentioned two complexity drivers of a process model, modeling complexity and process complexity. The first one refers to the way process modeling is approached and the second one to the complexity of the process itself. Thereby, a process model can be seen as a mirror, which reflects it and allows a deeper focus on the elements of interest (Rosemann, 2006). A process model contains icons that represent workflow, data flow, events, decisions, gateways and other elements of the process itself (ABPMP, 2013). Multiple perspectives, notation and diagrams are enabled through a business process model (Burlton, 2014). A brief description of the icons is given in section 3.1.8.
3.1.5. Modeling of the current state „AS-IS“ and future state “TO-BE”
When it’s time to analyze a specific business process, it usually begins with an analysis of what is currently being done. This is referred to the process diagram that documents the existing process as the “AS-IS” process diagram (Harmon, 2007). To assess the current state, this involves sessions, workshops, and interviews with the concerned subject matter experts, people who own the process as well as the ones who execute and use the process. When process documentation already exists, it is suitable to use it as a starting point for discussion, as well as organizations brochures which can also be utilized for providing insight into the organizational processes (Sharma, 2015). To capture more information for process modeling, there are several different ways as direct observation, one-on-one interviews, structured workshops, web conferencing or written feedback (ABPMP, 2009). According to ABPMP (2013), the current state “AS-IS” is mentioned in the stage of process discovery where the understanding of the current situation of the company cannot be omitted. These understanding includes the complex network of the company with customers, suppliers, collaborative partners, workers, rules, financial history, market and more. In order to guide the evolution of the company, the current state is critical in designing an implementable change or change roadmap (ABPMP, 2013).
After the understanding of what is currently being done, alternative workflows can be generated and compared with the current one. The first speculative alternative diagrams are called “COULD-BE” process diagrams and finally the new generated process is called “TO-BE” diagram (Harmon, 2007). The “TO-BE” process diagram is the main output of the process redesign phase, because it addresses the identified issues in the “AS-IS” process diagram (Dumas et al., 2012).
3.1.6. Performance measurement
When it’s time to analyze a business process there is no single way to do that. In the beginning of the analysis topics, methods and tools are all dependent on the nature of the process and the available information (ABPMP, 2013). For an successful organizational change, which do not always require an radical change, an effective formulation of process alternatives is needed including evaluations, and implementation of the selected processes (S. Lee & Ahn, 2008). According to ABPMP (2009), “if you can`t measure it, you can`t manage it” (ABPMP, 2009, p. 103), this statement expresses the importance, that an organization should not invest time and resources to improve a process if they do not know what they have to measure to improve. The manager’s awareness of the necessity to design and control a company from a process-oriented perspective increases. As a result, the company should be strictly aligned to the requirements of the customers (Leyer, Heckl, & Moormann, 2015). In the literature, several process performance dimensions can be found. Dumas et al. (2012) mention four process performance dimensions which are: time, cost and quality as well as a fourth dimension which gets involved in the equation once the issue of change has to be considered, which is called flexibility. These performance dimensions can be refined into several process performance measures called key performance indicators (KPIs). According to ABPMP (2009), they mentioned four fundamental process performance metrics which are: time, cost, capacity and quality. There are other metrics, such as efficiency and effectiveness, which are usually a function of one or more of the four fundamental metrics.Time - is a measurement of process duration, which measures the time it takes between the
beginning and end of the process; Cost – is a metric of monetary value associated with a process, which include two types, resource and opportunity cost. Resource cost is needed to complete a process, measures the monetary value which is associated with the recourse (human or otherwise). Opportunity cost is the value which is escaped form the process by not getting the resultant output of the process; Capacity – is an amount or volume of an output associated with a process;
Quality – is generally used to measure in percentage terms, it expressed the value of the real in
relation to optimal maximum in terms of process, that can be presented by satisfaction, variation, and error or rate of defect. According the effective metrics, there are usually referred to as KPIs with 12 characteristics, which are (ABPMP, 2009): 1. Alignment with corporate strategies and objectives; 2. An owner, which can be an individual or group who is responsible for the accountability of the outcome;
3. Predictive, measurement of the value of business drivers and are leading indicators of desired performance;
4. Actionable, and timely provided information on how users can intervene to improve performance; 5. Users focusing on a few high value activities, or on the overall effectiveness of the process; 6. Straight, easy to understand and not based on complex indexes that managers don’t know how to influence directly; 7. Balanced and linked to what is being measured and not compete and confuse; 8. Transformative, which encourages positive changes in the organization; 9. Standardized, which guaranties more effective measurements, including standard definitions, rules and calculations;
10. Context-driven performance by applying goals and limits so that users can measure their progress over time; 11. Reinforced, can be enhanced by including compensation or incentives; 12. Relevant, the need of a periodically review and update due the gradually loss of their impact over time. To measure a process there are two methods which can be used: manual, where data is collected manually, or through an automated method using of sophisticated software including BPM suits. If the date is collected manually it can be placed in a spreadsheet or modeling tool, or even drawn on paper. ABPMP (2009) mentioned four process performance management critical success factors which are:
1. Focusing on both people and process;
2. Ensure the understanding of the entire process;
3. Ensure the understanding of how the process is tied to operational performance metrics for the organization and align compensation to it;
4. Ensure that those who design and approve the activities are the same people who do the activities.
To sum it up, in order to improve a given business process it is necessary to analyze the process performance in-depth. Criteria to determine process performance such as indicators, measures, and figures must be defined beforehand. It is a challenge to select the “right” criteria, due the fact that there is no agreement in theory or practices on how to do this best (Leyer et al., 2015).
3.1.7. Transformation
According to ABPMP (2009), they define the process transformation as a planned evolution of business processes using a well-defined mythology and disciplined approach to ensure that a business process continues to meet business objectives. Depending on the level of maturity in an appropriate manner and timeline, the organization will adopt various methods to monitor and respond to these factors to solve individual situations. Regarding the purpose of transformation, Sharma (2015) defines several tools and techniques which can be used to gain an understanding of the current status, and to define and design new ways of working to achieve breakthrough results. Some of the tools and techniques are: process analysis, productivity analysis, customer analysis, functional analysis, business process modeling, value stream mapping, best practice analysis, competitive analysis, market trends, lesson learning log, life-cycle analysis, organization analysis, performance metrics, financial metrics, investment analysis, quality tools, data analysis, and cost analytics. In the literature, there are many tools and methodologies available.
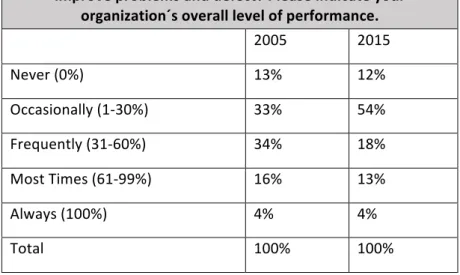
Neubauer (2009) mentioned the following as process management methods: Balanced Scorecard, benchmarking, TQM, Six Sigma, value-oriented management, and Lean Management. ABPMP (2009) mentions several familiar improvements methodologies which are Six Sigma, Lean, TQM, activity based costing and activity based management, as well as performance improvement models. In the survey of BPTrends, they also investigate a question related to process improvement programs in organizations which was “Are process improvement programs in place to identify and improve problems and defect?” (Harmon & Wolf, 2016, p. 20) (see table 3.2). They mentioned two process improvements programs, (1) process redesign which results in a project team undertaking a major effort to fix broken or deficient processes or (2) to generate new, more effective processes and continuous process improvement that incrementally improves existing processes. In 2015 most organization are “Occasionally” involved in process improvement, compared to 2005 fewer organization are doing it “Frequently” (Harmon & Wolf, 2016). Are process improvement programs in place to identify and improve problems and defect? Please indicate your organization´s overall level of performance. 2005 2015 Never (0%) 13% 12% Occasionally (1-30%) 33% 54% Frequently (31-60%) 34% 18% Most Times (61-99%) 16% 13% Always (100%) 4% 4% Total 100% 100% Table 3.2 - Are process improvement programs in place? Source: (Harmon & Wolf, 2016, p. 20)
According to APBPM (2009), the following improvement methodologies are described in more detail.
Six Sigma
The Six Sigma approach was developed by Motorola in 1996 (Neubauer, 2009) and is a specific measure of quality, used to improve quality and to reduce costs (Hammer, 2002). Furthermore, it is a disciplined, data-driven approach and methodology for eliminating defects based on statistical data from manufacturing to transactional and from product to service with the use of six standard deviations between the mean and the nearest specification limit (ABPMP, 2009). Furthermore, Six Sigma can be characterized not only as an statistical measure, but also as an goal that reaches near perfection for performance improvement and as an management system to achieve lasting business leadership and world-class performance (Pande & Holpp, 2002). From the statistical view, it describes how a process is performing and in order to achieve Six Sigma, a process must not produce more than 3.4 defects per million opportunities. A defect is defined as anything outside of customer specification and an opportunity as the total quality of chances for a defect. This can be easily calculated using a Six Sigma calculator (ABPMP, 2009).
Lean
The origin of Lean philosophy is Toyota and focuses on the reduction of seven wastes: over-production, waiting-time, transportation, processing, inventory, motion and scrap (ABPMP, 2009). Moreover, Lean involves both process redesign and improvement, as well as it concerns the enterprise (Flow Kaizen) and process level (Process Kaizen). Flow kaizen focuses on improving the flow of the high-level value stream, whereas the elimination of waste is related with process kaizen (Harmon, 2007). According to ABPMP (2009), organization should develop and review checklists to review product designs. In addition, “Lean Thinking“ has been practiced in government and commercial, manufacturing and service sectors. It is about getting the right things, to the right place, at the right time, in the right quality while minimizing waste as well as being flexible and open to change. The key Lean principles are: • Perfect first-time quality: zero defect detection, revelation and clarification problems at the source; • Waste minimization: eliminating non-value-adding activities and safety nets, maximize use of scarce resources (people, capital, and land);
• Continuous improvement: cost reduction, quality improvement, production enhancement and share of information;
• Pull processing: products and services are requested by the final consumer and not pushed from the production end;
• Flexibility: production of different mixes or greater diversity of products quickly, without sacrificing efficiency at lower volumes of production;
• Building and maintaining a long-term relationship sharing suppliers through collaborative sharing of risks, costs as well as information sharing arrangements.
TQM
TQM focuses on continuously improving and sustaining the quality of products and in its extension also of services (Dumas et al., 2012), to meet or exceed customer requirements (ABPMP, 2009). Furthermore, it focuses on process measurement and controls as a mean of continuous improvement. In TQM, statistical analysis is used to identify defect and monitor process behavior as well as opportunities for improvement. Activity Based Costing and Activity Based Management The methodology of Activity Based Costing (ABC) is used to measure costs and performance of cost objects, activities and resources (ABPMP, 2009). In this case, activities are consumed by cost objects and resources are consumed by activities. Resource cost are assigned with activities while these are based on their use of those resources. The reassignment of cost objects (outputs) are caused by activity costs. This methodology incorporates casual relationships between cost objects and activities between activities and resources. According to Dumas et al. (2012), the concept of ABC is used to assign indirect cost to products and services, and to individual customers. In other words, human resources and machinery are often shared by different product and services, and they are used to serve different customers. The discipline of Activity Based Management (ABM) is focusing on the management of activities within business processes as the route to continuously improve both the value received by customers and the profit earned in providing that value. These discipline uses ABC and performance measurements in order to influence management actions (ABPMP, 2009).
Performance improvement model
In the mid-1990s, the Rummler-Brache methodology became the most widely used, systematic business process methodology. Rummler and Brache developed a framework, that shows a single diagram, where everything is related to everything else (Harmon, 2007). Based on human performance improvement, it can be used to understand the alignment of the human resource central to the performance of one or more value chains (ABPMP, 2009). The framework is segmented in three levels of performance: (1) an organizational level, (2) a process level, and (3) a job or performer level. They also introduce a matrix that crosses their three levels with three different perspectives, which are: goals and measures, design and implementation issues, and management. The aim of the Rummler-Brache methodology is to help organizations who are involved in business process change to understand the scope of the problem and it provides the foundation on which all of today’s comprehensive process redesign methodologies are based (Harmon, 2007).
3.1.8. Business Process Model and Notation (BPMN)
A well suited way to express orderings between activities of a business process are graphical notations (Weske, 2007). In the literature, there are several process modeling approaches available. However for this work project, Business Process Model and Notation (BPMN) (Object Management Group (OMG), 2011; White, 2004) was selected because of the ease with which it can illustrate business processes and accessibility to non-experts, as well as the BPMN models can be enhanced to business process execution language to automate the process workflows (Dave, 2017).
Today, BPMN is a widely used standard for process modeling with the latest version BPMN 2.0. In 2011, BPMN was published as a standard by the Object Management Group (OMG) (Dumas et al., 2012). According to ABPMP (2013), BPMN 2.0 is useful for presenting a model to multiple audiences, to simulate a business process with a process engine and to execute a process. Weske (2007) states BPMN as, that the primary goal of BPMN is to provide a notation that is easy to understand by all business users, from the business analysts who create the initial designs of the processes, to the technical developers responsible for implementing the technology who will perform those processes, and finally, to the business people who manage and monitor those processes (Weske, 2007). In BPMN, rounded rectangles represent the activities and diamond shapes are represented as control nodes (gateways). The connections between activities and control nodes are through arcs (flows) that determine the order in which the process is executed (Dumas et al., 2012).
To develop an BPMN diagram, there are two conflicting requirements which create a simple mechanism for creating business process model, as well as being able to handle the complexity inherent to business processes. Thus, graphical aspects of the notation into specific categories are organized, which provide a small number of notation categories and the diagram reader can easily recognize the basic types of elements and understand the diagram. Furthermore, some additional variations and information can be added to meet complexity requirements, without dramatically altering the look-and-feel of the diagram. They are four basic categories of elements: flow objects, connecting objects, swimlanes, and artifacts (White, 2004). Table 3.3 presents the main graphical notations and its description.
Category Element Description Notation
Flow Objects Event A cycle represents an Event, something that “happens” during a course of a process. They affect the flow of the process and normally have a cause “trigger” or an impact “result”. Three types are available, which are based on when they affect the flow: Start, Intermediate, and End.
Activity A rounded-corner rectangle represents
an Activity and is a generic term for work that organizations perform. It can be atomic or non-atomic (compound). The types are: Sub-Process and Task
(rounded rectangles).
Gateway A diamond shape represents a Gateway and is used to control the divergence and convergence of Sequence Flow. It will determine decisions, forking, merging, and joining of paths. Internal Markers will imply the type of behavior control. Connecting Objects Sequence Flow
A solid line represents a Sequence Flow and is used to show the order (the sequence) that activities will be performed in a Process.
Message
between two separate Process Participants (Business entities or business roles) that send and receive them. Two separate Pools will represent the two Participants.
Association A dotted line represents an Associations and is used to associate data, text and other Artifacts with flow objects. They are used to show the inputs and outputs of activities.
Swimlanes Pool A Pool represents a Participant in a Collaboration and acts as a “swimlane” as well as a graphical container for partitioning a set of Activities form other Pools (usually B2B situations).
Lane A sup-partition within a Pool is
represented by a Lane, and will extend the entire length of the Poll, either
vertically or horizontally.
Artifacts Data Object To show how data is required or produced by activities is represented by Data Objects. They can represent a singular object or a collection of objects and are connected to activities through Associations.
Group A rounded corner rectangle drawn with a dashed line represents a Group. It does not affect the Sequence flow and can be used for documentation or analysis
purposes.
Annotation A mechanism for a modeler are Annotations that provide additional text information for the reader of a BPMN
Diagram.
Table 3.3 - Basic Modeling Elements
Source:(Object Management Group (OMG), 2011; White, 2004)
3.2. O
PTOELECTRONICI
NDUSTRY3.2.1. History
Light has always been fundamental for life and humans. In the optoelectronic field, research has made a huge bound forward in the last few decades, and light is no longer used to lighten our surroundings only. Light consists of photons, proven to have excellent attribute for carrying information. The optoelectronic sector is a technical field that makes use of the attributes of light, based on the science of geometric and physical optics. Nowadays, light is combined with modern electronics, mechanics and software, which has been widely used within application in the field of industry and as customer areas. There is a rapid growth in the optoelectronic industry and there is no signs of waring off (Optronic, 2013).
The first functional model of the image converter tube was demonstrated in 1934 by Walter Schaffernicht. Initially, research focused on television and immediately thereafter for military application such as night vision and signals, light telephony, optical distances detonators, and homing devices (Maier, 2002). The use of night vison devices began in the World War II, and came into wide use during the Vietnam War (MarketsandMarkets, 2015). Night vision devices gather the existing ambient light, including moonlight, starlight, or infrared light, through the front lens. The lens is made of photos which are converted to electrons by passing through a photocathode tube. The result of this chemical and electrical process is a visible light, which the users sees through the eyepiece, a clear, green-hued image, amplified recreation of the scene (Technavio, 2015).
3.2.2. Current Situation
At the beginning was the light. Light has made life on our earth possible. Light is energy, is inexhaustible and protects the environment. More than 70 percent of information we take over light, light connects, is the internet. Light is a universal tool, offers solutions, often the only solution, often revolutionary. Light is today a 250 billon-euro world market. (Goetzeler & Leibinger, 2009, p. 4).
Light provides decisive stimuli and solutions in numerous branches of industry and areas of application for the current and future challenges of the economy, science and society (Löffler, 2017). Photonics has developed into a globally courted growth sector. In many areas of photonics such as laser technology, lighting or microscopy and imaging, German organizations are among the world market leaders. Furthermore, for Europe is the photonic sector among the five most important key technologies with the greatest growth potential (Bundesminesterium für Bildung und Forschung, 2011). The demand in the night vision device market has remained robust due to the modernization of military and law enforcement agencies across the globe. In the market of night vision device, the current trend is characterized by the transition towards lightweight, low-cost, and efficient and effective night vision devices (MarketsandMarkets, 2015).
The night vision devices are segmented by products which are night vision googles, night vision cameras, night vision scopes and other. The customer segments are divided into military and civil. Key market drivers are continuous investment in military segment, lower cost of night vision devices compared to thermal imaging devices and a growing number of wildlife photographers. Key trends are the use of graphene for night vision devices, adoption of snooperscope in smartphones (a night vision scope that makes smartphones function like a night vision devices) and growing popularity of night vision systems in automotive sector. Key market challenges are the adoption of thermal imaging devices and government regulations on use of night vision devices. In 2015, the global market for night vision devices accounted $5.63 billion and a market growth rate of 4.62%. America is the leader of the global night vision devices market with a market share of 56%. Europe, the Middle East and Africa accounted 29% of the market share with $1.63 billion in 2015. The investment in the military sector in Germany was $36.6 billion in 2015. The global market size is expected to reach $7.26 billion by 2020 (Technavio, 2015).