Empirical Articles
Construct Validation of the Portuguese Version of the Restraint Scale
João Carvalho*
a, Marta M. Marques
b, Mário Boto Ferreira
c, Maria Luísa Lima
a[a] Instituto Universitário de Lisboa (ISCTE-IUL), CIS-IUL, Lisbon, Portugal. [b] Interdisciplinary Centre for the Study of Human Performance (CIPER), Faculty of Human Kinetics, University of Lisbon, Lisbon, Portugal. [c] Research Center for Psychological Science, Faculty of Psychology, University of Lisbon, Lisbon, Portugal.
Abstract
Aim: The main purpose of this study was to adapt the Restraint Scale (RS) to Portuguese and examine its psychometric properties, specifically its construct validity.
Method: In this study, 238 normal-weight adults (82% women; Mean age = 36.6, SD = 15.0) participated in an online survey containing measures of Restraint Scale, Three Factor Eating Questionnaire, Dutch Eating Behaviour Questionnaire, and Body Dissatisfaction and Drive for Thinness scales.
Results: Exploratory factor analyses corroborated the two-factors structure found in previous studies, in particular when three items without clear factorial assignment and low correlation were excluded. A final two-factors version of the RS containing seven items presented a very good fit to the measurement model and good internal consistency. Confirmatory factor analysis of the 7-items RS in relation to a three-factor model of overeating, dieting and body dissatisfaction measures revealed that the RS was the only restraint measure loading in all three factors. Conclusion: This suggests that the 7-items Portuguese version of the RS has good psychometric properties and unique features that lend it appropriate to identify and study unsuccessful chronic dieters.
Keywords: restraint scale, construct validity, dieting, overeating, body dissatisfaction
Psychology, Community & Health, 2016, Vol. 5(2), 134–151, doi:10.5964/pch.v5i2.170 Received: 2015-10-02. Accepted: 2016-07-01. Published (VoR): 2016-08-08.
Handling Editors: Cristina Godinho, ISCTE - Instituto Universitário de Lisboa, Lisbon, Portugal; Marta Marques, CIPER, Faculty of Human Kinetics, University of Lisbon, Lisbon, Portugal; ISPA – Instituto Universitário, Lisbon, Portugal
*Corresponding author at: CIS-IUL, Instituto Universitário de Lisboa, Av. das Forças Armadas, 1649-026 Lisbon, Portugal. E-mail: [email protected]
This is an open access article distributed under the terms of the Creative Commons Attribution License
(http://creativecommons.org/licenses/by/3.0), which permits unrestricted use, distribution, and reproduction in any medium, provided the original work is properly cited.
Introduction
Given the increased prevalence of overweight and obesity, which have been associated with health risks (World Health Organization, 2006) and negative social repercussions (Puhl & Brownell, 2001), it is not surprising that many people try to achieve a healthy weight. As a consequence, dieting (i.e., restriction of food intake) has become increasingly popular in Western societies as one of the main strategies to regulate body weight (Andreyeva, Long, Henderson, & Grode, 2010;Serdula et al., 1999). However, although some individuals can be successful in losing and maintaining weight loss by dieting, most regain their lost weight in the long run (Dombrowski, Avenell, & Sniehott, 2010;Jeffery et al., 2000;Mann et al., 2007). Moreover, the persistent use of dieting as a strategy to regulate body weight can lead one to develop a “false hope syndrome” in which the individual persists in their
trapped in a cycle of dieting and overeating (e.g.,Stice, Presnell, Shaw, & Rohde, 2005) that has been associated with weight gain (Van Strien, Herman, & Verheijden, 2014).
Confronted with such conundrum, researchers have been studying the factors that explain the successes and failures in dieters’ eating self-regulation (Herman & Polivy, 2004;Stroebe, Van Koningsbruggen, Papies, & Aarts, 2013). Within this area of research, the construct of eating restraint and its most used measure – the Restraint Scale (RS;Herman & Mack, 1975) – have been very influential. In large part because of its usefulness in predicting eating behaviour and disorders, but also due to the conceptual and psychometric issues that it has raised.
Construct Validity
In its original conceptualization, eating restraint refers to the intentional effort to restrict food intake in order to control body weight. The construct was proposed to explain why the eating behaviour of obese individuals was triggered by external food cues instead of homeostatic cues (Herman & Mack, 1975;Herman & Polivy, 1980). According to this proposal, restrained eaters’ chronic state of food deprivation was responsible for their increased responsiveness to external food cues and, consequently, for their propensity to overeat under certain conditions. Although the initial assumption that overweight and obese individuals would be more restrained than normal weight individuals has not been clearly supported (Ruderman, 1986), there is abundant evidence supporting the role of eating restraint on overeating behaviour irrespectively of body weight (seeHerman & Polivy, 2004for a review).
The RS is a self-report questionnaire specifically developed to measure eating restraint by assessing dimensions related with the degree of self-imposed restriction of food intake, the tendency to splurge and the degree of weight fluctuation (Herman & Mack, 1975). Most studies examining the factorial structure of the RS have found a two-factors model: 1) Concern for Dieting (CD); and 2) Weight Fluctuation (WF) (Blanchard & Frost, 1983;Lowe, 1984;
Overduin & Jansen, 1996;Van Strien, Breteler, & Ouwens, 2002). The CD subscale includes six items assessing preoccupations with food intake, while the WF subscale includes four items assessing typical fluctuations in body weight (seeTable 1).
Despite the extensive use of the RS, some conceptual and psychometric issues have been raised (seeHeatherton, Herman, Polivy, King, & McGree, 1988for a review). Across different studies some items are inconsistently assigned to the expected factors. Specifically, items CD3 (“Do you eat sensibly in front of others and splurge alone?”) and CD4 (“Do you give too much time and thought to food?”) loaded on a third factor in some studies (Johnson, Lake, & Mahan, 1983;Lowe, 1984) while loading on either the CD subscale (CD3:Blanchard & Frost, 1983), the WF subscale (CD3:Drewnowski, Riskey, & Desor, 1982) or both (CD3:Overduin & Jansen, 1996;Van Strien et al., 2002; CD4:Blanchard & Frost, 1983;Drewnowski et al., 1982) in other studies. Item WF4 has also loaded on either the CD subscale (Blanchard & Frost, 1983) or the WF subscale (Drewnowski et al., 1982) or both (Lowe, 1984;
Overduin & Jansen, 1996;Van Strien et al., 2002).
Moreover, these items have been criticized on conceptual grounds. The item CD3 has been criticized for possible criterion confounding (e.g.,Stice, Ozer, & Kees, 1997;Wardle & Beales, 1987; but seeHeatherton et al., 1988), and item WF4 for referring to a history of overweight that does not necessarily equate with weight fluctuations (Lowe, 1984). Given these conceptual and psychometric issues, the inclusion of these items on their respective subscales can be problematic and should be warranted when assessing the RS validity.
Predictive Validity
The predictive validity of the RS in determining overeating was initially investigated through a ‘preloading paradigm’ whereby individuals with varying scores consume a high caloric and palatable food (the preload) before a bogus taste test (Herman & Mack, 1975). Many such studies have found that while individuals scoring low on the RS (unrestrained eaters) tend to reduce their intake in the taste test as a result of the preload, those individuals scoring high (restrained eaters) usually consume more calories after the preload (e.g.,Rotenberg & Flood, 2000;
Westenhoefer, Broeckmann, Münch, & Pudel, 1994).
Other studies have also found that overeating in restrained eaters can be induced through other conditions, such as the perceived caloric content of the preload (Polivy, 1976), mere exposure to palatable food without consumption (Fedoroff, Polivy, & Herman, 2003;Shimizu & Wansink, 2011), emotional distress (e.g.,Polivy & Herman, 1999;
Wallis & Hetherington, 2004). Furthermore, restrained eaters (as measured by the RS) have shown motivational and cognitive tendencies associated with impulsive consumption, such as strong implicit preferences (e.g.,Houben, Roefs, & Jansen, 2010, 2012), attentional biases (e.g., Papies, Stroebe, & Aarts, 2008), automatic approach tendencies (e.g.,Veenstra & de Jong, 2010) and salivary responses (e.g.,Brunstrom, Yates, & Witcomb, 2004) towards high calorie palatable foods.
Notwithstanding the usefulness of the RS to assess the factors influencing overeating, some researchers have criticised the RS for ‘criterion confounding’ due to the inclusion of items (e.g., CD3) that refer to overeating behaviour (Stice, Ozer, & Kees, 1997;Stunkard & Messick, 1985;Wardle & Beales, 1987). According to this perspective, the often found relationship between high scores on the RS and disinhibited eating might not be the result of eating restraint only, but instead a confound due to the measurement of overeating and disinhibition in the RS. This led to a conceptual clarification byHeatherton et al. (1988)about the type of eating restraint that the RS is supposed to measure. According to the authors, what the critics call a confounding can be justified as ‘construct validity’ if one acknowledges that the RS intends to measure both restraint and overeating behaviours that char-acterize chronic unsuccessful restrained eaters.
(Un)Successful Restraint Eating
The notion that the RS is suited to assess chronic unsuccessful eaters has received strong support when comparing it with other measures of eating restraint. The Cognitive Restraint Scale of the Three Factor Eating Questionnaire (TFEQ-R;Stunkard & Messick, 1985) and the Restraint subscale of the Dutch Eating Behaviour Questionnaire (DEBQ-R;Van Strien, Frijters, Bergers, & Defares, 1986) are both one-dimensional measures of restraint eating that have been construed to be independent from any tendency to overeat. Both subscales were developed in large part to avoid the ambiguities surrounding the RS two-factors structure and its supposed ‘criterion confounding’. However, accumulating evidence suggests that by excluding this confounding, these measures assess a different type of restrained eaters.
For instance, studies testing the influence of restraint on overeating have often failed to find evidence of disinhib-ited eating when using either the DEBQ-R (Van Strien, Frijters, Bergers, et al., 1986; Van Strien, Frijters, Van Staveren, Defares, & Deurenberg, 1986;Wardle & Beales, 1987) or the TFEQ (Lowe & Kleifield, 1988;Stunkard & Messick, 1985). Moreover, while the RS seems to be positively associated with disinhibited eating (Laessle et al., 1989;Van Strien et al., 2002;Van Strien, Herman, Engels, Larsen, & van Leeuwe, 2007) and with binge eating (Laessle, Tuschl, Kotthaus, & Prike, 1989; Stice et al., 1997), both the TFEQ-R and the DEBQ-R seem to be
negatively associated with food intake (e.g.,Brogan & Hevey, 2013; Laessle et al., 1989;Van Strien, Frijters, Bergers, et al., 1986;Wardle & Beales, 1987).
This pattern of results suggests that these different measures could be identifying distinct restrained eaters. The RS seems more suitable to identify unsuccessful chronic restrained eaters (i.e., individuals prone to alternate between restraint and overeating) while the DEBQ-R and the TFEQ-R seem more suitable to identify successful restrained eaters (i.e., restrained eaters more successful in restricting their food intake without overeating) (Allison, Kalinsky, & Gorman, 1992;Laessle et al., 1989;Lowe, 1993;Van Strien, 1999;Van Strien et al., 2002). The RS may thus have unique predictive value to study unsuccessful dieters compared to other restraint measures.
Construct Validity of the Portuguese Version of the Restraint Scale
Given the crucial role of the RS in understanding dieters’ eating behaviours, the main purpose of the study was to adapt and validate the RS to the Portuguese population. Although the RS has been previously adapted to Brazilian Portuguese byScagliusi et al. (2005), this study focused on test-retest reliability and discriminant validity in a sample of women with eating disorders. In the present study we examined key conceptual and psychometric issues associated with the RS based on reliability and construct validity investigation in a normal-weight sample of an adapted Portuguese version of this scale. We focused on validating the Portuguese RS factorial structure using exploratory factor analysis.
Furthermore, we examined the multidimensional construct validity of the Portuguese RS in comparison with other measures of restraint to test to what extent the RS is especially suited to identify unsuccessful chronic dieters. We used confirmatory factor analysis to test the hypothesis that the Portuguese RS shows a unique multidimen-sional relationship with dieting, overeating, and body dissatisfaction.
Method
Participants
Faculty and students of several Portuguese universities and academic institutes were requested by e-mail to participate in this online study as well as to divulge it through their mailing lists. As an incentive to participate, those who accessed the study were informed that two 25 Euro vouchers would be raffled among participants who completed the entire survey. The study followed the ethics guidelines of the hosting institution - Centro de Inves-tigação e Intervenção Social, Lisbon, Portugal (CIS-IUL, 2013). A total of 451 subjects accessed the online study. Among these, 120 participants (26,6%) did not finish the survey and were excluded from the analysis. One more participant was excluded for not providing us with explicit consent to use the data.
To allow for comparability with previous validity studies which have mostly focused on normal-weight samples (e.g.,Van Strien et al., 2002,2007), we used a Body Mass Index (BMI) interval of 18 ≤ BMI ≤ 25 as inclusion cri-terion. The BMI was calculated (weight/height2) based on self-reported weight and height. Following this criterion, eight participants with a BMI under 18 and 79 participants with a BMI above 25 were excluded from data analysis. Five other participants were also excluded because they did not report the necessary values to calculate their BMI.
The final sample used for data analysis included a total of 238 participants (196 women and 42 men), with a mean age of 36.58 years (SD = 15.00) and BMI of 21.77 (SD = 1.82).
Measures
Portuguese Version of the Restraint Scale
The RS is a self-report questionnaire developed to measure eating restraint (Herman & Mack, 1975). Originally, the RS was a 5-item questionnaire (Herman & Mack, 1975), later expanded to 11-items (Herman & Polivy, 1975). In a revised version, the RS scoring system was simplified and the questionnaire reduced to ten items (seeTable 1), which can be aggregated into a single score of eating restraint (Heatherton et al., 1988; Polivy, Herman, & Warsh, 1978). However, most studies examining the factorial structure of the RS have found a two-factors model: 1) Concern for Dieting (CD); and 2) Weight Fluctuation (WF) (Blanchard & Frost, 1983;Lowe, 1984;Overduin & Jansen, 1996;Van Strien et al., 2002). The CD subscale includes six items assessing preoccupations with food intake, while the WF subscale includes four items assessing typical fluctuations in body weight (seeTable 1for the original English version). CD items are answered in a 4-point scale, except for item CD1 (5-point scale). All WF items are answered in a 5-point scale.
Table 1
Items and Scale of the Original and the Adapted Portuguese Versions of the Restraint Scale
Adapted Portuguese Version Original English Version
Items
Com que frequência faz dieta?
Nunca; Raramente; Às vezes; Frequentemente; Sempre (Scored 0-4) How often are you dieting?
Never; Rarely; Sometimes; Often; Always (Scored 0-4) CD1
Qual é a quantidade máxima de peso (em quilos) que alguma vez perdeu em 1 mês?
0-2.5; 2.5-5; 5-7.5; 7.5-10; 10+ (Scored 0-4) What is the maximum amount of weight (in kilos) you have ever lost within
1 month?
0-2.5; 2.5-5; 5-7.5; 7.5-10; 10+ (Scored 0-4) WF1
Qual é a quantidade máxima de peso ganho (em quilos) numa semana? 0-0.5; 0.5-1; 1-1.5; 1.5-2.5; 2.5+ (Scored 0-4)
What is the maximum amount of weight gain (in kilos) within a week? 0-0.5; 0.5-1; 1-1.5; 1.5-2.5; 2.5+ (Scored 0-4)
WF2
Numa semana típica, quanto é que varia o seu peso? 0-0.5; 0.5-1; 1-1.5; 1.5-2.5; 2.5+ (Scored 0-4) In a typical week, how much does your weight fluctuate?
0-0.5; 0.5-1; 1-1.5; 1.5-2.5; 2.5+ (Scored 0-4) WF3
Uma variação de peso de 2.5 quilos afetaria a forma como vive a sua vida? Nada; Um pouco; Moderadamente; Muito (Scored 0-3)
Would a weight fluctuation of 2.5 kilos affect the way you live your life? Not at all; Slightly; Moderately; Very much (Scored 0-3)
CD2
Come de forma sensata quando está com outras pessoas e de forma descontrolada quando está sozinho/a?
Nunca; Raramente; Frequentemente; Sempre (Scored 0-3) Do you eat sensibly in front of others and splurge alone?
Never; Rarely; Often; Always (Scored 0-3) CD3
Dedica demasiado tempo e pensamentos à comida? Nunca; Raramente; Frequentemente; Sempre (Scored 0-3) Do you give too much time and thought to food?
Never; Rarely; Often; Always (Scored 0-3) CD4
Tem sentimentos de culpa depois de comer em excesso? Nunca; Raramente; Frequentemente; Sempre (Scored 0-3) Do you have feelings of guilt after overeating?
Never; Rarely; Often; Always (Scored 0-3) CD5
Quão consciente está do que está a comer?
Nada; Um pouco; Moderadamente; Extremamente (Scored 0-3) How conscious are you of what you are eating?
Not at all; Slightly; Moderately; Extremely (Scored 0-3) CD6
Considerando o peso máximo que já teve, quantos quilos acima do seu peso desejado é que tinha?
0-0.5; 0.5-3; 3-5; 5-10; 10+ (Scored 0-4) How many kilos over your desired weight were you at your maximum weight?
0-0.5; 0.5-3; 3-5; 5-10; 10+ (Scored 0-4) WF4
The RS was translated to Portuguese from the English version by the authors. The Brazilian Portuguese version (Scagliusi et al., 2005) was used for semantic comparison. A bilingual translator unacquainted with the original version retroverted all items to English. Discrepancies between the original and the retroverted versions were re-solved by consensus. When necessary, the Portuguese items were revised in order to accomplish semantic and lexical equivalency between the original and Portuguese versions. The final RS Portuguese version is presented inTable 1.
Portuguese Version of the Dutch Eating Behaviour Questionnaire
The Portuguese version of the DEBQ (Viana & Sinde, 2003; original version developed byVan Strien, Frijters, Bergers, et al., 1986;Van Strien, Frijters, Van Staveren, Defares, & Deurenberg 1986) has 33 items divided into three separate scales: 1) Emotional eating (13 items); 2) External eating (10 items); and 3) Restraint eating (10 items). All DEBQ scales from the Portuguese version showed good internal consistency and factorial validity in a previous validation study (Viana & Sinde, 2003). In the current study these scales presented excellent internal consistency: Cronbach’s alpha was .954 for emotional eating, .863 for external eating and .910 for restraint eating.
Portuguese Version of the Three Factor Eating Questionnaire
The Portuguese version of the TFEQ (Moreira, Almeida, Sampaio, & Almeida, 1998original version developed byStunkard & Messick, 1985) has 26 items divided into three separate scales: 1) Cognitive restraint (thirteen items); 2) Disinhibition (seven items); and 3) Hunger (six items). In the present study we only included the disinhi-bition and hunger scales and replaced the cognitive restraint scale with the rigid control and flexible control subscales proposed byWestenhoefer, Stunkard, and Pudel (1999). These subscales incorporate many items from the TFEQ cognitive restraint scale, but are assumed to represent distinct components of eating restraint. Previous studies suggest that these subscales have different relations with unhealthy eating behaviors and successful weight control (e.g.,Westenhoefer et al., 1999; Karhunen et al., 2012). Hence, by including these subscales we can better understand if distinct components of cognitive restraint show distinct relationships with overeating and body dissatisfaction.
A recent validation study of a Portuguese version of the rigid and flexible control subscales showed that both have good internal consistency and factorial validity (Poínhos et al., 2013). In the present study, we found good internal consistency in all scales: Cronbach’s alpha was .826 for the disinhibition scale; .778 for the hunger scale; and .742 and .804 for the rigid and flexible control subscales, respectively.
Portuguese Version of the Body Dissatisfaction and Drive for Thinness Subscales
Following similar studies assessing the RS multidimensional structure, we included measures of motivational constructs that can lead one to adopt a restraint eating style (Laessle et al., 1989;Van Strien et al., 2002,2007). Given that body image seems to be an important motive for dieting, we included the body dissatisfaction (nine items) and drive for thinness (eight items) subscales from the Eating Disorder Inventory (EDI-I;Garner, Olmstead, & Polivy, 1983) due to their relation with issues of body weight control and regulation, such as one’s discontent with body shape and one’s desire of being thin. The Portuguese version of the EDI-I, including both subscales, showed good internal consistency and factorial validity (Machado, Gonçalves, Martins, & Soares, 2001). In the present study, we found good internal consistency in both subscales. Cronbach’s alpha was .888 for the body dissatisfaction subscale and.874 for the drive for thinness subscale.
Procedure
Participants were invited by email to participate in an online study about eating behaviours that would take 15 minutes to completion. Those who accessed the study received more information about its aim and were assured that their data would remain anonymous and confidential. After providing informed consent, participants responded to the different scales. The order of presentation of the scales was randomized. Participants also answered to some socio-demographic questions (e.g., age, gender, height and weight).
Data Analysis
The Portuguese RS factorial structure was examined through exploratory factor analysis to validate the latent structure and to assess possible inconsistencies in the factorial assignment of items to the expected factors. Given the categorical nature of its response scales, we used the recommended weighted least squares means and variance adjusted (WLSMV) estimator (Muthén, du Toit, & Spisic, 1997). For exploratory factor analysis we used an oblique rotation to estimate factor loadings, assuming that the factors are conceptually correlated (Heatherton et al., 1988;Van Strien et al., 2002).
For the RS multidimensional construct validation, we first analyzed bivariate Pearson correlations between all measures. In addition, we assessed the RS convergent validity through confirmatory factor analyses using a Maximum Likelihood (ML) estimator. We assumed that the RS would be related with a three-factors structure in-cluding overeating, dieting and body dissatisfaction. For convergent validity, results of the confirmatory factor analysis with the RS loading on all three factors were compared to the results of the RS loading only on the dieting factor. This procedure was repeated for the two subscales CD and WF. We followed the same procedure for the other three measures of restraint eating to assess the unique multifactorial structure of the RS compared to these measures. We expected the other restraint measures to yield loadings only on the dieting factor and not on the overeating factor. Model fit indices, the significance of the chi-square difference test between models, and the scale’s loadings in the three factors were used to assess the multifactorial hypothesis.
The adequacy of all the exploratory and confirmatory factorial models was determined based on the Chi-square statistic (χ2/df), Root-Mean Square Error of Approximation (RMSEA), Comparative Fit Index (CFI) and Tucker-Lewis Fit Index (TLI). A RMSEA ≤ .050, CFI > .900 and TLI > .900 and a non-significant Chi-square (p ≥ .050), were considered acceptable indices of fit for the model (Byrne, 2012). Multivariate normality of distributions was examined by observed values of skewness and kurtosis. All distributions were within the range of values (± 2.0) expected in normal distributions (Muthén & Kaplan, 1985).
Chronbach’s alphas were computed to assess internal consistency.
All analyses were conducted using SPSS 22 and Mplus 7. Given that Mplus does not provide parallel analyses for exploratory factor analyses with categorical data, this analysis was conducted on sample polychoric correlations as implemented in R package psych (Revelle, 2016).
Results
Restraint Scale’s Reliability and Factorial Validity
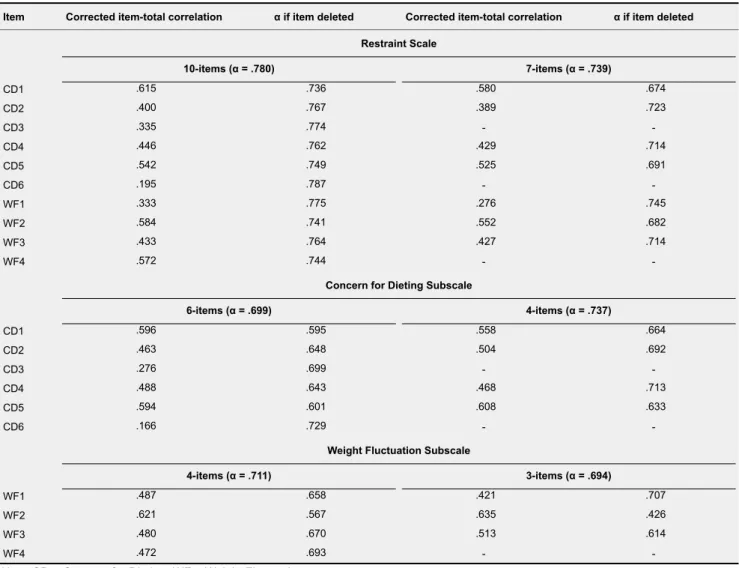
Table 2shows the Cronbach’s alpha of the RS (α = .780), CD (α = .699) and WF (α = .711) subscales. It also shows the correlations between each item and its respective subscale as well as the Cronbach’s alpha if the item is deleted. Only item CD6 deletion would increase the Cronbach’s alpha in both the RS (α = .787) and CD subscale (α = .729).
Table 2
Internal Consistency of the Restraint Scale (10-items & 7-items), the Concern for Dieting Subscale (6-items & 4-items), and the Weight Fluctuation Subscale (4-items & 3-items)
α if item deleted Corrected item-total correlation
α if item deleted Corrected item-total correlation
Item Restraint Scale 7-items (α = .739) 10-items (α = .780) CD1 .615 .736 .580 .674 CD2 .400 .767 .389 .723 -CD3 .335 .774 CD4 .446 .762 .429 .714 CD5 .542 .749 .525 .691 -CD6 .195 .787 WF1 .333 .775 .276 .745 WF2 .584 .741 .552 .682 WF3 .433 .764 .427 .714 -WF4 .572 .744
Concern for Dieting Subscale
4-items (α = .737) 6-items (α = .699) CD1 .596 .595 .558 .664 CD2 .463 .648 .504 .692 -CD3 .276 .699 CD4 .488 .643 .468 .713 CD5 .594 .601 .608 .633 -CD6 .166 .729
Weight Fluctuation Subscale
3-items (α = .694) 4-items (α = .711) WF1 .487 .658 .421 .707 WF2 .621 .567 .635 .426 WF3 .480 .670 .513 .614 -WF4 .472 .693
Note. CD = Concern for Dieting; WF = Weight Fluctuation.
Given the inconsistent factorial assignment of some items on previous studies, we decided to conduct an exploratory factor analysis to assess possible psychometric issues with the Portuguese version in this regard.
Following both the eigenvalue > 1 criterion and a parallel analysis, a three-factors solution was selected. The eigenvalues for the three-factors were 3.977, 1.437 and 1.113, respectively. This three-factors solution presented
good fit (seeTable 3). A forced one-factor solution presented poor fit, χ2(35) = 183.74, p < .001, RMSEA = .134, 90% CI [.115, .153], CFI = .855, TLI = .813, but a forced two-factors solution obtained adequate goodness of fit (seeTable 3).
Table 3shows each item’s factors loading on both the two- and three-factors solutions after oblique rotation. For the two-factors solution (explaining 54.5% of total variance), four items from the CD subscale (items CD1, CD2, CD4, CD5) had the highest loadings on the first factor (≥ .596). Three items from the WF subscale (items WF1, WF2, WF3) had the highest loadings on the second factor (≥ .679). Three items – two from the CD subscale (CD3, CD6) and one from the WF subscale (WF4) – presented similar small loadings in both factors (≤ .389).
For the three-factors solution (explaining 65.6% of total variance), the same four items from the CD subscale (items CD1, CD2, CD4, CD5) had also the highest loadings on the first factor (≥ .583). However, on the second factor only two items from the WF subscale (WF2, WF3) had the highest loadings (≥ .696). Compared with the two-factors solution, item WF1 had a lower loading on the second factor of the three-factors solution (.409) and item CD3 had the third highest loading (.499). However, both items had significant loadings on other factors (see
Table 3). Similar to the two-factors solution, item CD6 had very small and not significant loadings on all three factors (≤ .162).
These results suggest that, although a three-factors solution presents a better goodness of fit, a two-factors model also has satisfactory fit. It seems also clear that some items do not present a consistent factor loading. Item CD6 appears to be inadequately represented in both factorial solutions and had the lowest correlation with other items from the CD subscale (seeTable 2). Thus, item CD6 was excluded from further analysis using the RS.
Items CD3 and WF4 also did not present a consistent factorial representation, showing statistically significant, medium to small loads, on more than one factor. This inconsistency has been found in previous studies (e.g.,
Blanchard & Frost, 1983;Overduin & Jansen, 1996;Van Strien et al., 2002). Moreover, these items have been criticized on conceptual grounds: item CD3 for possible criterion confounding (e.g.,Stice et al., 1997;Wardle & Beales, 1987; but seeHeatherton et al., 1988); and item WF4 for referring to history of overweight that does not necessarily equate with weight fluctuations (Lowe, 1984). Given these conceptual and psychometric issues, we decided to exclude these two items from further analysis.
To examine the validity of the new proposed 7-item RS, we repeated the exploratory factor analysis. This new RS version resulted in a two-factors solution (explaining 66.3% of total variance) based on the eigenvalue > 1 criterion and the parallel analysis. The eigenvalues were 3.178 for the first factor and 1.461 for the second factor. This two-factors solution presented a better goodness of fit (seeTable 3) than the two- and three-factors solutions of the 10-items RS version. It also presented a much better fit than a one-factorial model of the 7-item RS version, χ2(14) = 146.51, p < .001, RMSEA = .199, 90% CI [.171, .229], CFI = .819, TLI = .728.
Table 3shows each of the 7-items’ factor loading for the two-factors solution after oblique rotation. All four CD items had higher loads on the first factor (≥ .589) and all three WF items had higher loads on the second factor (≥ .614). Moreover, the Cronbach’s alpha was .739 for the 7-item RS, .737 for the 4-item CD, and .694 for the 3-item WF (seeTable 2).
Table 3
Factor Loadings of the Three- and Two-Factors WLSMV Solution of the 10-items Restraint Scale, and the Two-Factors WLSMV Solution of the 7-item Restraint Scale
7-items Restraint Scalec 10-items Restraint Scale
Item Two-factors solutionb Three-factors solutiona Factor 2 Factor 1 Factor 2 Factor 1 Factor 3 Factor 2 Factor 1 CD1 .621 .144 .153 .640 .209 .634 .201 CD2 .689 -.143 .089 .707 -.121 .699 -.104 -CD3 .248 .499 -.254 .259 .297 CD4 .583 .143 -.077 .596 .059 .589 .065 CD5 .820 .038 -.052 .833 -.041 .828 -.029 -CD6 .141 .043 .162 .137 .151 WF1 -.140 .409 .520 -.100 .679 -.097 .614 WF2 .006 .921 .054 .017 .917 .010 .984 WF3 .046 .696 .008 .033 .709 .073 .662 -WF4 .388 .066 .582 .386 .389
Note. CD = Concern for Dieting; WF = Weight Fluctuation.
aModel fit: χ2(18) = 31.40, p = .026; RMSEA = .056, 90% CI [.019, .088]; CFI = .987; TLI = .967.bModel fit: χ2(26) = 57.41, p < .001; RMSEA
= .071, 90% CI [.046, .096]; CFI = .969; TLI = .947.cModel fit: χ2(8) = 8.86, p = .354; RMSEA = .021, 90% CI [.000, .081]; CFI = 0.999; TLI =
.997.
Construct Validity of the RS
Table 4shows the zero order Pearson correlation coefficients between all measures. The highest correlation of the 7-items RS was obtained with one measure of body dissatisfaction (EDI drive for thinness: r = .721). The next two highest correlations were with other dieting measures (TFEQ rigid control and DEBQ restrained eating: r ≥ .620). Albeit smaller, the 7-items RS also showed significant correlations with measures of overeating (r > .230), the highest being with the TFEQ disinhibited (r = .443) and DEBQ emotional eating (r = .483). The 4-items CD subscale showed very similar results, with only slight variations on correlation values. However, the 3-items WF subscale obtained smaller correlations with most measures, particularly with other dieting measures (.219 ≤ r ≥ .360) and body dissatisfaction (r = .342). Overall, these results lend some support to the RS and its subscales multidimensionality.
We conducted confirmatory factor analyses to further test the multidimensional construct of the RS and its subscales compared with other restrained eating measures. Following the three-factor structure proposed byLaessle et al. (1989)andVan Strien et al. (2007), we tested a model of three latent variables corresponding to: 1) overeating and disinhibited eating, 2) dieting and restrained eating, and 3) body dissatisfaction. Four measures were assumed to load on the overeating factor (TFEQ disinhibition, TFEQ Hunger, DEBQ emotional eating, DEBQ external eating), three on the dieting factor (TFEQ rigid control, TFEQ flexible control, DEBQ restrained eating), and two on the body dissatisfaction factor (EDI drive for thinness and body dissatisfaction).
To test the 7-item RS convergent validity with a three-factor model, we first conducted a confirmatory factor analysis with the measure loading only on the dieting factor. This factorial model showed poor goodness of fit, χ2(32) = 200.52, p < .001, RMSEA = .149, 90% CI [.129, .169], CFI = .882, TLI = .834. However, the 7-item RS had a strong significant load on the dieting factor (.754). We compared this model with a three-factor model of
Table 4
Intercorrelations Between (Sub)Scales
12 11 10 9 8 7 6 5 4 3 2 1 Scale -1. RS7 .865*** .747*** .443*** .231*** .620*** .555*** .483*** .279*** .672*** .721*** .493*** -2. RS-CD4 .317*** .362*** .202** .674*** .626*** .467*** .218** .690*** .770*** .502*** -3. RS-WF3 .366*** .176** .283*** .220** .303*** .247*** .360*** .342*** .271*** -4. TFEQ-DIS .591** .152* .058 .575*** .649*** .131* .347*** .355*** -5. TFEQ-HUN .063 .023 .346*** .546*** .007 .041 .131* -6. TFEQ-RIG .753*** .319*** .016 .708** .621** .375** -7. TFEQ-FLE .293*** -.062 .767** .575*** .291*** -8. DEBQ-EMO .398*** .336*** .468*** .344*** -9. DEBQ-EXT .029 .178** .233*** -10. DEBQ-RES .721*** .463*** -11. EDI-DT .653*** -12. EDI-BD
Note. RS7 = 7-items Restraint Scale; RS-CD4 = 4-items Concern for Dieting Subscale; RS-WF3 = 3-items Weight Fluctuation Subscale;
TFEQ-DIS = Disinhibition; TFEQ-HUN = Hunger; TFEQ-RIG = Rigid Control; TFEQ-FLE = Flexible Control; DEBQ-EMO = Emotional Eating; DEBQ-EXT = External Eating; DEBQ = Restraint Eating; EDI-DT = Drive for Thinness; EDI-BD = Body Dissatisfaction.
*p < .05. **p < .01. ***p < 0.001.
the 7-item RS by loading it also on the overeating and body dissatisfaction factors. This model produced a much better goodness of fit, although not optimal, χ2(30) = 121.97, p < .001, RMSEA = .113, 90% CI [.093, .135], CFI = .935, TLI = .903, and a significant chi-square difference test, χ2(2) = 78.55, p < .001. Moreover, the measure obtained significant positive loadings in all three factors (overeating: .321; dieting: .496; body dissatisfaction: .232).
Table 5presents loadings of each measure on the assigned factor for this model.
We repeated the same procedure for both the 7-items RS subscales. The one-dimensional model with each subscale loading only on the dieting factor produced a poor fit, χ2(41) = 227.70, p < .001, RMSEA = .138, 90% CI [.121, .156], CFI = .877, TLI = .835, and both subscales yielded significant loadings on the dieting factor, although the 4-items CD obtained a much higher load (.814 compared to .366). The three-factor model obtained a much improved goodness of fit, though not optimal, χ2(37) = 136.44, p < .001, RMSEA = .106, 90% CI [.088, .126], CFI = .934, TLI = .902, and a significant chi-square difference test, χ2(4) = 91.26, p < .001. Moreover, the 4-items CD subscale presented significant loadings on all three factors, while the 3-items WF subscale presented significant loadings only on the overeating and dieting factors (seeTable 5).
FollowingVan Strien et al. (2007)procedure, we conducted a series of additional confirmatory factor analysis to compare the RS multidimensionality with other restraint measures (i.e., TFEQ rigid and flexible control, DEBQ restrained eating) by loading each of the three restraint measures also on the overeating and body dissatisfaction factors. Both the TFEQ flexible control and the DEBQ restraint three-factors models showed slight improvements in goodness of fit, χ2(24) = 118.28, p < .001 versus χ2(22) = 93.64, p < .001 and χ2(22) = 98.61, p < .001, respec-tively. The chi-square difference test was also significant for both models, χ2(2) = 24.64, p < .001 and χ2(2) = 19.67, p < .001, respectively. Both measures yielded significant loadings on body dissatisfaction (TFEQ flexible control: -.503; DEBQ restraint: .317), but very small not significant loadings on the overeating factor (TFEQ flexible control: .024; DEBQ restraint: -.051). The TFEQ rigid control three-factors model barely changed the goodness
Table 5
Factor Loadings for Confirmatory Factor Models With the 7-items Restraint Scale and Subscales (4-items CD and 3-items WF) 4-items CD/3-items WF 7-items RS Body Dis. Dieting Overeating Body Dis. Dieting Overeating Measure/Factor TFEQ-DIS .927*** .927*** TFEQ-HUN .636*** .636*** DEBQ-EMO .617*** .617*** DEBQ-EXT .708*** .708*** DEBQ-RES .902*** .892*** TFEQ-RIG .824*** .833*** TFEQ-FLE .849*** .856*** EDI-BD .658*** .654*** EDI-DT .992*** .999*** 7-items RS .321*** .496*** .232*** 4-items CD .207*** .492*** .326*** 3-items WF .337*** .274** .014
Note. Body Dis. = Body Dissatisfaction.
**p < .01. ***p < .001.
.379. Estimates of loadings on the overeating and body dissatisfaction factors were both very small and not sig-nificant (.070 and -.042, respectively).
Overall, these results suggest that the three-factor multidimensionality found in previous studies (Van Strien et al., 2007) is also reproducible in the Portuguese version of the 7-items RS and its 4-items CD subscale. Compared with other restraint measures, this three-factor multidimensionality appears to be unique to the RS and CD sub-scales, particularly for constructs of overeating and disinhibited eating. We also replicated the two-factors model found byVan Strien et al. (2007)using the original WF subscale in a sample of normal weight women for the Portuguese 3-item WF subscale.
Discussion
The present study aimed to adapt the revised RS to Portuguese and assess its reliability, factorial and construct validity. The results from the factorial analyses confirm the adequacy of the RS two-factors structure and its mul-tidimensionality. However, in line with previous studies, the psychometric properties of some items are questionable and unclear.
Item CD6 (“How conscious are you of what you are eating?”) appears to be uncorrelated with the RS and it is poorly represented in the scale’s factorial structure. This is inconsistent with previous validation studies that have found consistent significant loadings on the CD factor. A possible reason for this inconsistency could be the am-biguous meaning of its content in Portuguese language as it relates with restraint. The item can be interpreted as one being aware of food intake without implying an increased concern with dieting. While ‘being conscious’ in English can be interpreted as ‘being apprehensive’ about what one is eating, in Portuguese to be conscious is usually interpreted as ‘being aware’ of what is happening. Given its problematic psychometric properties and ambiguous nature, we recommend its exclusion from the Portuguese version of the RS. However, if researchers
decide to include it they should assess how this impacts the reliability of the scale and how the item relates with the RS subscales.
Items CD3 and WF4 also showed inconsistencies in their factorial assignment, in line with previous studies (e.g.,
Blanchard & Frost, 1983;Overduin & Jansen, 1996;Van Strien et al., 2002), suggesting that they could be mea-suring other dimensions. Moreover, these items have also been criticised by possible ‘criterion confounding’ (Lowe, 1984;Stice et al., 1997;Wardle & Beales, 1987; but seeHeatherton et al., 1988). Hence, their inclusion in future studies should be justified by a rigorous psychometric assessment and validation.
It is important to note that although item CD3 may be an important factor in the relationship between the RS and overeating (Stice et al., 1997), in this study, after excluding it, the RS still obtained a positive significant correlation with different overeating constructs (e.g., Disinhibition, Emotional Eating and External Eating) and showed a sig-nificant load on the overeating factor.Van Strien et al. (2007)found a similar result, suggesting that other RS items might contribute to its relationship with overeating despite no explicit references to disinhibited eating. Re-search has helped to determine that the RS seems to assess restraint of food intake and overeating and, thus, the construct of restraint identified by the RS should incorporate both dieting and overeating behaviours expected to cause greater weight fluctuations as a result of a chronic cycle of restraint and overindulgence (Heatherton et al., 1988).
Notwithstanding the psychometric and conceptual issues of the three items, the Portuguese RS corroborates the adequacy of the two-factors structure, particularly when these items are excluded. In fact, the exploratory factor analysis including only the remaining 7-items presented a much better fit when two factors were extracted. In this two-factors solution the remaining items presented high loadings on the expected subscales and good internal consistency.
The Portuguese RS also supports the multidimensional structure found in previous construct validation studies (Laessle et al., 1989;Van Strien et al., 2007). The RS and its CD subscale were the only restraint measures that had significant associations with dieting, overeating and body dissatisfaction. The WF subscale was only ated with dieting and overeating. In contrast, the restraint subscales of the TFEQ and the DEBQ were not associ-ated with the overeating factor, although the TFEQ Flexible Control subscale and the DEBQ restraint scale were associated with both dieting and body dissatisfaction. Overall, these results corroborate the findings ofVan Strien et al. (2007)who found a similar pattern except for the association between the DEBQ restraint scale and body dissatisfaction.
We expected the TFEQ Rigid Control subscale to show a stronger relation with overeating and/or body dissatis-faction compared with the Flexible Control subscale based on previous studies that suggest that rigid cognitive control is associated with unhealthy eating behaviours and unsuccessful weight regulation (Karhunen et al., 2012;
Westenhoefer et al., 1999). However, that was not the case, which suggests that the RS could be more adequate than the Rigid Control subscale to identify dieters that tend to overeat.
In sum, the present study appears to validate the RS multidimensional relationship with dieting, overeating and body dissatisfaction. More relevant to future studies on eating restraint, the results from the comparison between the different restraint scales lend support to the hypothesis that the RS is especially suited to identify unsuccessful chronic dieters, whose eating behaviour is characterized by periods of restraint and overeating. Hence, when
disinhibition (Van Strien, 1999). This makes the RS inappropriate to disentangle disinhibition from restraint eating and, consequently, inadequate to differentiate between successful and unsuccessful dietary restraint (Van Strien, 1999). In contrast, uni-dimensional restraint scales from the TFEQ and DEBQ, as “pure” measures of eating restraint, can play an important role in the study of (un)successful dietary restraint by allowing us to separate restraint eating from other eating behaviours. Although high scores on these measures can be ambiguous in terms of how (un)successful an individual is in dietary restraint (Ogden, 1993), by complementing scores on pure measures of restraint with scores on overeating and disinhibition subscales it is possible to unconfound successful and unsuc-cessful dieters with high restraint scores (Van Strien, 1997,1999);Westenhoefer et al., 1994
These differences between restraint measures should be taken into account when designing and interpreting future studies. For instance, researchers interested in understanding self-regulation failures that lead to overconsumption should benefit from using the RS as it identifies individuals prone to be unsuccessful in eating restraint, with ten-dency to overeat. In contrast, uni-dimensional restraint measures, when complemented with other eating behaviour measures, should be considered if the goal is to differentiate dieters with low versus high susceptibility towards failure of dietary restraint (Van Strien, 1999). Such distinction is crucial to understand when, how and to whom dietary restraint can be a successful strategy to achieve and maintain a healthy weight.
Future validation studies should test the invariance of the multifactorial structure of the Portuguese RS across different weight status groups –normal-weight vs. overweight/obese populations. Likewise, analyzing its discrimi-native validity by comparing RS scores between these two population groups is warranted, as in previous validation studies the RS was considered to be more appropriate for assessing restraint in normal-weight than in overweight samples (e.g.Van Strien et al., 2007).
The adaptation and validation of the RS is an important first step to investigate its predictive validity among the Portuguese population. The RS can be quite valuable in identifying motivational and cognitive factors of chronic dieters that may contribute to impulsive food consumption (e.g.,Houben et al., 2012;Papies et al., 2008;Veenstra & de Jong, 2010), as well as in identifying vulnerable individuals in the population. We hope the Portuguese RS can contribute to increase our knowledge about eating behaviours and disorders, particularly among chronic dieters.
Funding
This research was supported by a PhD grant from the Portuguese Foundation for Science and Technology (PD/BD/111222/2015) awarded to the first author.
Competing Interests
The second author (MM) is a member of Psychology, Community and Health’s Editorial Team and one of the Guest Editors of this Special Issue.
Acknowledgments
The authors would like to acknowledge Prof. Rachel Evans and Prof. Elizabeth Collins for their work in the translation and adaptation to Portuguese of the Restraint Scale.
References
Allison, D. B., Kalinsky, L. B., & Gorman, B. S. (1992). A comparison of the psychometric properties of three measures of dietary restraint. Psychological Assessment, 4, 391-398. doi:10.1037/1040-3590.4.3.391
Andreyeva, T., Long, M. W., Henderson, K. E., & Grode, G. M. (2010). Trying to lose weight: Diet strategies among Americans with overweight or obesity in 1996 and 2003. Journal of the American Dietetic Association, 110, 535-542.
doi:10.1016/j.jada.2009.12.029
Blanchard, F. A., & Frost, R. O. (1983). Two factors of restraint: Concern for dieting and weight fluctuation. Behaviour Research and Therapy, 21, 259-267. doi:10.1016/0005-7967(83)90208-5
Brogan, A., & Hevey, D. (2013). Eating styles in the morbidly obese: Restraint eating, but not emotional and external eating, predicts dietary behaviour. Psychology & Health, 28, 714-725. doi:10.1080/08870446.2012.760033
Brunstrom, J. M., Yates, H. M., & Witcomb, G. L. (2004). Dietary restraint and heightened reactivity to food. Physiology & Behavior, 81, 85-90. doi:10.1016/j.physbeh.2004.01.001
Byrne, B. M. (2012). Structural equation modeling with Mplus: Basic concepts, applications, and programming. New York, NY, USA: Routledge.
CIS-IUL. (2013). Ethical guidelines. Retrieved fromhttp://www.cis.iscte-iul.pt/Research.aspx?id=9
Dombrowski, S. U., Avenell, A., & Sniehott, F. F. (2010). Behavioural interventions for obese adults with additional risk factors for morbidity: Systematic review of effects on behaviour, weight and disease risk factors. Obesity Facts, 3, 377-396. doi:10.1159/000323076
Drewnowski, A., Riskey, D., & Desor, J. A. (1982). Feeling fat yet unconcerned: Self-reported overweight and the restraint scale. Appetite, 3, 273-279. doi:10.1016/S0195-6663(82)80023-8
Fedoroff, I., Polivy, J., & Herman, C. P. (2003). The specificity of restrained versus unrestrained eaters’ responses to food cues: General desire to eat, or craving for the cued food? Appetite, 41, 7-13. doi:10.1016/S0195-6663(03)00026-6
Garner, D. M., Olmstead, M. P., & Polivy, J. (1983). Development and validation of a multidimensional eating disorder inventory for anorexia nervosa and bulimia. International Journal of Eating Disorders, 2, 15-34.
doi:10.1002/1098-108X(198321)2:2<15::AID-EAT2260020203>3.0.CO;2-6
Heatherton, T. F., Herman, C. P., Polivy, J., King, G. A., & McGree, S. T. (1988). The (mis)measurement of restraint: An analysis of conceptual and psychometric issues. Journal of Abnormal Psychology, 97, 19-28. doi:10.1037/0021-843X.97.1.19
Herman, C. P., & Mack, D. (1975). Restrained and unrestrained eating. Journal of Personality, 43, 647-660. doi:10.1111/j.1467-6494.1975.tb00727.x
Herman, C. P., & Polivy, J. (1975). Anxiety, restraint, and eating behavior. Journal of Abnormal Psychology, 84, 666-672. doi:10.1037/0021-843X.84.6.666
Herman, C. P., & Polivy, J. (1980). Restrained eating. In A. J. Stunkard (Ed.), Obesity (pp. 208-225). Philadelphia, PA, USA: Saunders.
Herman, C. P., & Polivy, J. (2004). The self-regulation of eating: Theoretical and practical problems. In R. F. Baumeister & K. D. Vohs (Eds.), Handbook of self-regulation: Research, theory and applications (pp. 492-156). New York, NY, USA: Guilford Press.
Houben, K., Roefs, A., & Jansen, A. (2010). Guilty pleasures: Implicit preferences for low and high calorie food in restrained eating. Appetite, 55, 18-24. doi:10.1016/j.appet.2010.03.003
Houben, K., Roefs, A., & Jansen, A. (2012). Guilty pleasures II: Restrained eaters’ implicit preferences for high, moderate and low-caloric food. Eating Behaviors, 13, 275-277. doi:10.1016/j.eatbeh.2012.03.007
Jeffery, R. W., Epstein, L. H., Wilson, G. T., Drewnowski, A., Stunkard, A. J., & Wing, R. R. (2000). Long-term maintenance of weight loss: Current status. Health Psychology, 19, 5-16. doi:10.1037/0278-6133.19.Suppl1.5
Johnson, W. G., Lake, L., & Mahan, J. M. (1983). Restrained eating: Measuring an elusive construct. Addictive Behaviors, 8, 413-418. doi:10.1016/0306-4603(83)90042-4
Karhunen, L., Lyly, M., Lapveteläinen, A., Kolehmainen, M., Laaksonen, D. E., Lähteenmäki, L., & Poutanen, K. (2012). Psychobehavioural factors are more strongly associated with successful weight management than predetermined satiety effect or other characteristics of diet. Journal of Obesity, 2012, Article 274068. doi:.doi:10.1155/2012/274068
Laessle, R. G., Tuschl, R. J., Kotthaus, B. C., & Prike, K. M. (1989). A comparison of the validity of three scales for the assessment of dietary restraint. Journal of Abnormal Psychology, 98, 504-507. doi:10.1037/0021-843X.98.4.504
Lowe, M. R. (1984). Dietary concern, weight fluctuation and weight status: Further explorations of the Restraint Scale. Behaviour Research and Therapy, 22, 243-248. doi:10.1016/0005-7967(84)90004-4
Lowe, M. R. (1993). The effects of dieting on eating behavior: A three-factor model. Psychological Bulletin, 114, 100-121. doi:10.1037/0033-2909.114.1.100
Lowe, M. R., & Kleifield, E. I. (1988). Cognitive restraint, weight suppression, and the regulation of eating. Appetite, 10, 159-168. doi:10.1016/0195-6663(88)90009-8
Machado, P. P. P., Gonçalves, S., Martins, C., & Soares, I. C. (2001). The Portuguese version of the eating disorders inventory: Evaluation of its psychometric properties. European Eating Disorders Review, 9, 43-52. doi:10.1002/erv.359
Mann, T., Tomiyama, A. J., Westling, E., Lew, A.-M., Samuels, B., & Chatman, J. (2007). Medicare’s search for effective obesity treatments: Diets are not the answer. The American Psychologist, 62, 220-233. doi:10.1037/0003-066X.62.3.220
Moreira, P., Almeida, L., Sampaio, D., & Almeida, M. D. V. (1998). Validação de uma escala para avaliação do comportamento alimentar de jovens universitários saudáveis. Revista Ibero-Americana de Diagnóstico e Avaliação Psicológica, 6, 125-136. Muthén, B., du Toit, S. H. C., & Spisic, D. (1997). Robust inference using weighted least squares and quadratic estimating
equations in latent variable modeling with categorical and continuous outcomes. Retrieved from
http://www.statmodel.com/bmuthen/articles/Article_075.pdf
Muthén, B., & Kaplan, D. (1985). A comparison of some methodologies for the factor analysis of non-normal Likert variables. British Journal of Mathematical and Statistical Psychology, 38, 171-189. doi:10.1111/j.2044-8317.1985.tb00832.x
Ogden, J. (1993). The measurement of restraint: Confounding success and failure? International Journal of Eating Disorders, 13, 69-76. doi:10.1002/1098-108X(199301)13:1<69::AID-EAT2260130109>3.0.CO;2-Z
Overduin, J., & Jansen, A. (1996). A new scale for use in non-clinical research into disinhibitive eating. Personality and Individual Differences, 20, 669-677. doi:10.1016/0191-8869(96)00010-4
Papies, E. K., Stroebe, W., & Aarts, H. (2008). The allure of forbidden food: On the role of attention in self-regulation. Journal of Experimental Social Psychology, 44, 1283-1292. doi:10.1016/j.jesp.2008.04.008
Poínhos, R., Rowcliffe, P., Marques, A. R., Viana, V., Oliveira, B., & Correia, F. (2013). Adaptação e validação das sub-escalas de controlo flexível e rígido do comportamento alimentar. Alimentação Humana, 3, 82-92.
Polivy, J. (1976). Perception of calories and regulation of intake in restrained and unrestrained subjects. Addictive Behaviors, 1, 237-243. doi:10.1016/0306-4603(76)90016-2
Polivy, J., & Herman, C. P. (1999). Distress and eating: Why do dieters overeat? International Journal of Eating Disorders, 26, 153-164. doi:10.1002/(SICI)1098-108X(199909)26:2<153::AID-EAT4>3.0.CO;2-R
Polivy, J., & Herman, C. P. (2002). If at first you don't succeed: False hopes of self-change. The American Psychologist, 57, 677-689. doi:10.1037/0003-066X.57.9.677
Polivy, J., Herman, C. P., & Warsh, S. (1978). Internal and external components of emotionality in restrained and unrestrained eaters. Journal of Abnormal Psychology, 87, 497-504. doi:10.1037/0021-843X.87.5.497
Puhl, R., & Brownell, K. D. (2001). Bias, discrimination, and obesity. Obesity Research, 9, 788-805. doi:10.1038/oby.2001.108
Revelle, W. (2016). Psych: Procedures for personality and psychological research, Northwestern University, Evanston, Illinois, USA. Retrieved fromhttp://CRAN.R-project.org/package=psych[Version = 1.6.4]
Rotenberg, K. J., & Flood, D. (2000). Dietary restraint, attributional styles for eating, and preloading effects. Eating Behaviors, 1, 63-78. doi:10.1016/S1471-0153(00)00005-2
Ruderman, A. J. (1986). Dietary restraint: A theoretical and empirical review. Psychological Bulletin, 99, 247-262. doi:10.1037/0033-2909.99.2.247
Scagliusi, F. B., Polacow, V. O., Cordás, T. A., Coelho, D., Alvarenga, M., Philippi, S. T., & Lancha, A. H. (2005). Test–retest reliability and discriminant validity of the Restraint Scale translated into Portuguese. Eating Behaviors, 6, 85-93. doi:10.1016/j.eatbeh.2004.06.001
Serdula, M. K., Mokdad, A. H., Williamson, D. F., Galuska, D. A., Mendlein, J. M., & Heath, G. W. (1999). Prevalence of attempting weight loss and strategies for controlling weight. Journal of the American Medical Association, 282, 1353-1358. doi:10.1001/jama.282.14.1353
Shimizu, M., & Wansink, B. (2011). Watching food-related television increases caloric intake in restrained eaters. Appetite, 57, 661-664. doi:10.1016/j.appet.2011.08.006
Stice, E., Ozer, S., & Kees, M. (1997). Relation of dietary restraint to bulimic symptomatology: The effects of the criterion confounding of the Restraint Scale. Behaviour Research and Therapy, 35, 145-152. doi:10.1016/S0005-7967(96)00077-0
Stice, E., Presnell, K., Shaw, H., & Rohde, P. (2005). Psychological and behavioral risk factors for onset of obesity in adolescent girls: A prospective study. Journal of Consulting and Clinical Psychology, 73, 195-202. doi:10.1037/0022-006X.73.2.195
Stroebe, W., Van Koningsbruggen, G. M., Papies, E. K., & Aarts, H. (2013). Why most dieters fail but some succeed: A goal conflict model of eating behavior. Psychological Review, 120, 110-138. doi:10.1037/a0030849
Stunkard, A. J., & Messick, S. (1985). The Three-Factor Eating Questionnaire to measure dietary restraint, disinhibition, and hunger. Journal of Psychosomatic Research, 29, 71-83. doi:10.1016/0022-3999(85)90010-8
Van Strien, T. (1997). The concurrent validity of a classification of dieters with low or high susceptibility toward failure of restraint. Addictive Behaviors, 22, 587-597. doi:10.1016/S0306-4603(96)00069-X
Van Strien, T. (1999). Success and failure in the measurement of restraint: Notes and data. International Journal of Eating Disorders, 25, 441-449. doi:10.1002/(SICI)1098-108X(199905)25:4<441::AID-EAT9>3.0.CO;2-B
Van Strien, T., Breteler, M. H. M., & Ouwens, M. A. (2002). Restraint Scale, its sub-scales concern for dieting and weight fluctuation. Personality and Individual Differences, 33, 791-802. doi:10.1016/S0191-8869(01)00192-1
Van Strien, T., Frijters, J. E., Bergers, G. P. A., & Defares, P. B. (1986). The Dutch Eating Behavior Questionnaire (DEBQ) for assessment of restrained, emotional, and external eating behavior. International Journal of Eating Disorders, 5, 295-315. doi:10.1002/1098-108X(198602)5:2<295::AID-EAT2260050209>3.0.CO;2-T
Van Strien, T., Frijters, J. E. R., Van Staveren, W. A., Defares, P. B., & Deurenberg, P. (1986). The predictive validity of the Dutch restrained eating scale. International Journal of Eating Disorders, 5, 747-755.
doi:10.1002/1098-108X(198605)5:4<747::AID-EAT2260050413>3.0.CO;2-6
Van Strien, T., Herman, C. P., Engels, R. C. M. E., Larsen, J. K., & van Leeuwe, J. F. J. (2007). Construct validation of the Restraint Scale in normal-weight and overweight females. Appetite, 49, 109-121. doi:10.1016/j.appet.2007.01.003
Van Strien, T., Herman, C. P., & Verheijden, M. W. (2014). Dietary restraint and body mass change: A 3-year follow up study in a representative Dutch sample. Appetite, 76, 44-49. doi:10.1016/j.appet.2014.01.015
Veenstra, E. M., & de Jong, P. J. (2010). Restrained eaters show enhanced automatic approach tendencies towards food. Appetite, 55, 30-36. doi:10.1016/j.appet.2010.03.007
Viana, V., & Sinde, S. (2003). Estilo alimentar: Adaptação e validação do questionário holandês do comportamento alimentar. Psicologia: Teoria, Investigação e Prática, 8, 59-71.
Wallis, D. J., & Hetherington, M. M. (2004). Stress and eating: The effects of ego-threat and cognitive demand on food intake in restrained and emotional eaters. Appetite, 43, 39-46. doi:10.1016/j.appet.2004.02.001
Wardle, J., & Beales, S. (1987). Restraint and food intake: An experimental study of eating patterns in the laboratory and in normal life. Behaviour Research and Therapy, 25, 179-185. doi:10.1016/0005-7967(87)90044-1
Westenhoefer, J., Broeckmann, P., Münch, A.-K., & Pudel, V. (1994). Cognitive control of eating behaviour and the disinhibition effect. Appetite, 23, 27-41. doi:10.1006/appe.1994.1032
Westenhoefer, J., Stunkard, A. J., & Pudel, V. (1999). Validation of the flexible and rigid control dimensions of dietary restraint. International Journal of Eating Disorders, 26, 53-64. doi:10.1002/(SICI)1098-108X(199907)26:1<53::AID-EAT7>3.0.CO;2-N
World Health Organization. (2006). Fact Sheet No. 311 - Obesity and Overweight. Retrieved from