UNIVERSIDADE DO ALGARVE
GENETIC CONECTIVITY PATTERNS IN HOLOTHURIA
MAMMATA CONSIDERING DIFFERENT SPATIAL SCALES
Filipe Freitas Henriques
Dissertação para obtenção do grau de:
Mestrado em Biologia Marinha
Trabalho efetuado sob a orientação de
:
Mercedes González- Wangüemert, PhDEster A. Serrão, PhD
2
UNIVERSIDADE DO ALGARVE
GENETIC CONECTIVITY PATTERNS IN HOLOTHURIA
MAMMATA CONSIDERING DIFFERENT SPATIAL SCALES
Filipe Freitas Henriques
Dissertação para obtenção do grau de:
Mestrado em Biologia Marinha
Trabalho efetuado sob a orientação de: Mercedes González-Wangüemert, PhD
Ester A. Serrão, PhD
3
GENETIC CONECTIVITY PATTERNS IN HOLOTHURIA
MAMMATA CONSIDERING DIFFERENT SPATIAL SCALES
Declaração de autoria de trabalho
Declaro ser a autor deste trabalho, que é original e inédito. Autores e
trabalhos consultados estão devidamente citados no texto e constam da
listagem de referências incluída.
©Copyright Filipe Freitas Henriques
A Universidade do Algarve tem o direito, perpétuo e sem limites geográficos, de arquivar e publicitar este trabalho através de exemplares impressos reproduzidos em papel ou de forma digital, ou por qualquer outro meio conhecido ou que venha a ser inventado, de o divulgar através de repositórios científicos e de admitir a sua cópia e distribuição com objetivos educacionais ou de investigação, não comerciais, desde que seja dado crédito ao autor e editor.
4
I. ACKNOWLEDGEMENTS
First of all, a very big thanks to Mercedes González-Wangüemert for helping me during all parts of the process, by providing comments, information, papers, and software necessary to finish the thesis.
Special thanks to Ester A. Serrão, who promptly received me with arms wide open into her research group and guided me to a thesis project with Mercedes.
These two super Women were always there when I needed, always motivating me, and I really admire their Excellency as scientists and as persons. It was an honour for me to work with them.
Thanks for all the precious help of several people that participate in the CUMFISH project and retrieved the samples. I hope this work may fulfil your efforts.
I would like to thank also to Professor Karim Erzini, Aschwin Engelen, Onno Diekmann, Sara Valente, Francisco Fernandes, Diogo Paulo and all people working in the CCMAR facilities who helped me during my initial thesis and more.
Thanks to my family. My Mom, who always believed in me, especially in some hard moments of ours lifes. My Father, who was the first to introduce me to the marine realm, and indirectly influenced my career. My Brothers, just for being true brothers, and always there when I needed. My girlfriend, Raquel Marques, who turned on the lights, during the darker periods of this thesis.
At last but not least, thanks to my master course colleagues, especially Ana Costa, Joana Pimentel, Daniela Nobre, Magda Frade, Cátia Freitas, André Silva, Inga Silva and Pedro Shaw, for being such good teammates. Our great friendship and dedication to this course, was fundamental to keep us highly motivated. I think that all those dinners and weekends studying together created bonds that will endure eternally.
5
II. ABSTRACT
As a consequence of the world population growth, the demand for sea food resources is increasing. Consequently, worldwide fisheries transition from depleted finfish resources to alternative invertebrates species created a massive industry. Sea cucumber stocks have been overfished in Indo-Pacific Oceans as result of lack of effective management, non-regulated fisheries and an increasing demand from Oriental countries. The “beche de mer” demands have induced expansion of their fisheries worldwide and have resulted in catches of new target species from the Mediterranean Sea and NE Atlantic Ocean. With high commercial value and fragile life-history traits, sea cucumbers are particularly vulnerable to commercial fisheries, especially when there are no scientific knowledge to support their effective management.
This study aims to fill in some of the gap in scientific data about sea cucumber populations, namely Holothuria mammata. It was assessed the genetic diversity and structure, connectivity and effective population size with novel polymorphic molecular markers (microsatellites). This analysis was done in several spatial scales and considering oceanographic patterns. Some morphometric traits were also analysed, such as the distribution of length and weight classes.
The results showed that Holothuria mammata has globally high genetic diversity, higher genetic connectivity between Atlantic populations and genetic differentiation between Atlantic/Mediterranean and eastern/western Mediterranean basins. Effective population sizes were smaller in the Atlantic, showing some mutation-drift disequilibrium. Oceanographic patterns were strongly correlated with the genetic differentiation patterns. Atlantic populations presented bigger individuals (i.e. length and weight) than Mediterranean ones, clearly associated with environmental conditions, and ecology features. Biometric data and genetic analysis allowed us to establish the three potential stocks inhabiting the geographic area and improve the biological knowledge of this new target species. This information will be useful to suggest the first recommendations to its effective fishery management, and future comparisons in order to assess the fishery effects either at genetic and/or morphometric level.
Key Words: Holothuria mammata, genetic structure, oceanographic patterns,
6
III. RESUMO
Com a população Mundial na ordem dos 7,2 biliões e projeções a apontar para um aumento populacional na ordem dos 9.6 biliões para 2050, é previsto um aumento a nível Mundial pela procura dos recursos alimentares marinhos. Apesar de uma recente estabilização da quantidade de capturas de pescado, estima-se que pelo menos, 28.8% dos stocks pesqueiros globais estejam sobreexplorados. A situação poderá ser potencialmente preocupante, se tivermos em conta que o atual nível de capturas apenas se tem mantido relativamente constante devido a uma persistente procura por novos recursos pesqueiros e pela expansão das áreas de pesca. Como consequência do aumento da procura internacional por recursos pesqueiros, existe evidências muito claras que o nível trófico médio das espécies alvo está a diminuir, significando uma transição nas descargas de pescado, de espécies de nível trófico alto (e.g. grandes predadores), para níveis tróficos baixos (e.g. invertebrados e peixes planctívoros). Esta situação resulta de um declínio Mundial dos predadores de topo e consequentemente, um aumento da pressão pesqueira em outros recursos pesqueiros, como os invertebrados, na qual os moluscos, crustáceos e equinodermes representam os mais afetados com o aumento da demanda global. Além dos impactes ambientais negativos originados pela pesca (e.g. arrasto de fundo, by-catch, rejeições, sobrepesca, entre outros) também são registadas alterações na biologia e ecologia dos organismos marinhos, desde variações na diversidade genética e estrutura das populações, a modificações na estrutura e função dos ecossistemas marinhos. A sobre-exploração promove a perda de diversidade genética, através da redução do tamanho efetivo da população (NE), e consequentemente uma diminuição da variação genética e fenotípica,
tal como o tamanho corporal, fecundidade, fitness e taxa de crescimento. Estes efeitos têm-se mostrado não reversíveis mesmo após a libertação da pressão pesqueira. A implementação de uma gestão pesqueira sustentável permite manter a diversidade genética das populações e o seu potencial a nível evolutivo, mas também a resiliência dos ecossistemas.
A falta de gestão efetiva das pescas e/ou políticas de conservação, são das principais causas para a sobrepesca. Na maioria dos casos tal deve-se à falta de conhecimento ecológico e/ou biológico das espécies comerciais. Este tipo de situações acontece repetidamente quando se inicia a exploração de novos recursos pesqueiros.
Os stocks de pepinos de mar nos Oceanos Indo-Pacifico têm sido um exemplo em que a sobre-exploração ocorreu não só pela falta de conhecimento
7
ecológico/biológico, mas também devido a pescas não regulamentadas. Com os stocks asiáticos praticamente esgotados, e sendo a procura por este recurso pesqueiro cada vez maior, a forma mais fácil de responder a esta procura, foi expandir a pesca de pepinos do mar a um nível global, na qual inclui o Mar Mediterrâneo e Oceano Atlântico. Com alto valor comercial e histórias de vida frágeis, os pepinos do mar estão particularmente vulneráveis á pesca comercial, principalmente quando não existe estudos biológicos, ecológico ou genéticos que possam aconselhar e suportar a sua gestão sustentável.
Estudos recentes têm demonstrado o potencial farmacológico das holotúrias, com descobertas de compostos com propriedades antimicrobianas, antioxidantes e anticancerígenas.
Os pepinos do mar são espécies igualmente importantes para o funcionamento saudável dos ecossistemas, pois para além de decomporem a matéria orgânica contida nos sedimentos, reciclam os nutrientes, estimulando o crescimento de microalgas e prevenindo eutrofização dos fundos marinhos.
Consideramos urgente iniciar estes estudos de modo a averiguar os parâmetros biológicos e ecológicos fundamentais para dar início a uma gestão de pescas regulamentada e efetiva. Informações como taxas de crescimento e mortalidade, longevidade, biologia reprodutiva, duração larvar, diversidade genética, padrões de conectividade e estrutura genética, permitiram implementar uma gestão pesqueira sustentável a médio e longo prazo. No âmbito desta necessidade de fornecimento de informação sobre os pepinos do mar, este estudo analisou e avaliou a diversidade genética e respetiva estrutura genética populacional, a sua conectividade e o tamanho efetivo das populações. Para tal foi feita uma recolha de amostras de 8 populações ao longo do Mar Mediterrâneo e do Oceano Atlântico, cobrindo grande parte da distribuição geográfica da espécie alvo de estudo, a Holothuria mammata. Desenvolveu-se também marcadores moleculares específicos para esta espécie (i.e. Microssatélites). A análise genética foi feita em varias escalas espaciais e tendo em conta os padrões oceanográficos das correntes de superfície, de forma a compreender como se processa a dispersão larvar de acordo com a conectividade genética.
Para além das análises genéticas, também foi analisado algumas características morfométricascomo a distribuição de classes de comprimento e peso.
Os resultados deste estudo mostraram que a Holothuria mammata apresenta a nível geral, grande diversidade genética, uma maior conectividade genética entre as populações do Atlântico e diferenciação genética entre Atlântico/Mediterrâneo como
8
também entre as bacias este e oeste do Mediterrâneo. As populações do Oceano Atlântico apresentaram evidências de um desequilíbrio entre a mutação e a deriva genética. Também verificou-se que o tamanho efetivo das populações do oceano Atlântico são menores do que as populações do Mar Mediterrâneo.
Os padrões oceanográficos das correntes de superfície demonstraram estar fortemente correlacionados com os padrões de diferenciação genética encontrados.
A nível das análises morfométricas efetuadas, verificou-se que a Holothuria
mammata apresenta uma morfometria alométrica, evidenciando uma alteração na forma
corporal á medida que o animal cresce. As populações do oceano Atlântico apresentaram indivíduos maiores, quer a nível do cumprimento como a nível do peso, do que as populações do mar Mediterrâneo. Estas diferenças corporais estão associadas às diferentes condições ambientais, tal como a disponibilidade de habitat e alimento, e também às características ecológicas, como a competição por alimento.
As análises biométricas e genéticas, permitiram-nos identificar os stocks existentes na área geográfica do estudo e contribuir para o conhecimento da biologia desta nova espécie com interesse comercial. Pelo menos três stocks devem ser considerados; um stock para as populações do Atlântico, e dois stocks para o Mar Mediterrano (Bacias Este e Oeste).
A informação contida nesta Tese, terá grande utilidade na sugestão das primeiras recomendações para uma gestão efetiva das pescas. Adicionalmente, estes dados irão servir para futuras comparações quer a nível genético, como a nível morfométrico, de modo a avaliar os efeitos da pescaria.
Palavras-chave: Holothuria mammata, estrutura genética, padrões
9
IV. INDEX
I. ACNOWLEDGEMENTS………. 4 II.
ABSTRACT……….………. 5 III. RESUMO………... 6 IV. INDEX……….. 9 V. LIST OF FIGURES………... 11VI. LIST OF TABLES……… 13
1.Introduction ...14
1.1.State of the World Fisheries... 14
1.2.Genetics and Fisheries Management….. ….………. 15
1.2.1.Genetic Diversity and Effective Population Size…………... 16
1.2.2.Population Genetic Structure... ………... 16
1.2.3.Connectivity ……... ... 17
1.2.4.Selection………. 17
1.3.Oceanographic Currents.……… 18
1.3.1.Northern Atlantic Ocean Surface Currents... 19
1.3.2.Mediterranean Sea-Overall Functioning……… 21
1.3.2.1.Western Mediterranean Sea Surface Currents……. 21
1.3.2.2.Eastern Mediterranean Surface Currents…………. 24
1.4.Study Case: Sea Cucumbers.………. 25
1.4.1.Ecological Role ... 25
1.4.2.Food Potential and Sea Cucumber Fisheries……….. 26
1.4.3.Pharmacological Potential... 29
1.4.4.Integrated Multi-Trophic Aquaculture Potential……… 29
1.5.Biological Model:Holothuria mammata (Grube, 1840)………. 30
2.Objectives... 33
3.Methodology……… 34
3.1.Sampling………... 34
3.2.DNA Extraction, PCR Amplification and Screening…………... 35
3.3.Genetic Analysis………... 36
10 3.3.2.Genetic Structure………... 37 3.3.3.Gene Flow... 38 3.3.4.Bottlenecks………. 39 3.3.5.Selection………. 39 3.4.Morphometry Analysis………. 39 4.Results... 41
4.1.Genetic Diversity and Linkage Disequilibrium……… 41
4.2.Genetic Structure……….. 44
4.3.Genetic Connectivity and Effective Population Size……… 49
4.4.Bottlenecks……… 52
4.5.Morphometry Analyses………. 53
5.Discussion……… 58
5.1.Genetic Diversity………... 58
5.2.Genetic Differentiation……….. 61
5.2.1.Great Spatial Scale: Atlantic and Mediterranean Regions…. 61 5.2.2.Small Spatial Scale: Sampled Locations……… 62
5.3.Bottlenecks……… 65
5.4.Morphometry………. 66
6.Conclusion………... 69
6.1.Populations Genetics………. 69
6.2.Morphometry………. 69
7.Recommendations for Fisheries and Conservation Management………… 70
8.References……… 71
11
V. LIST OF FIGURES
Figure 1: World capture fisheries and aquaculture production (Million tonnes) between 1950 and 2012. ... 14 Figure 2- Surface circulation of the northern North Atlantic as derived from drift experiments (adapted from Krauss, 1986 in Pérez et al. (2001)). LC, Labrador Current; NAC, North Atlantic Current; GS, Gulf Stream; and PC, Portugal Current Meridionally-ruled area, flow associated with the NAC toward the north. Zonally-ruled area, flow associated with the northern limb of the Subtropical Front. Numbers are transports in Sverdrups (1 Sv"106m3 s~1). ... 19 Figure 3 – Scheme of the surface circulations in the Southern Iberian Coast and the Portuguese-Canary eastern boundary current that veers eastward into the Gulf of Cadiz, and eventually feeding the Mediterranean Sea. N2 is a branch of the larger-scale Portuguese–Canary eastern boundary current; SVE is the Cyclonic eddy off Cape San Vicente; N1 is cyclonic circulation bounded by a shelf break front; CCC is a warmer coastal counter current. ... 20 Figure 4- The red line represents Almeria-Orán front. The red arrows represent the boundary of the Atlantic Jet. And the orange circles display the Western Anticyclonic Gyre (WAG) and the Eastern Anticyclonic Gyre (EAG) positions, the numbers 1, 2, 3 in parentheses refer to the Western Alborán basin, the Alborán ridge, and the Eastern Alborán basin, respectively. Adapted from Renault et al. (2012). ... 22 Figure 5- The Balearic Sea with main currents Northern Current (NC), Balearic Current (BC) and AW inflows through the Ibiza and Mallorca Channels. A ‘blocking’ eddy (yellow circle dashed line) and the re-circulation of the NC above the eddy (yellow dashed line) are also indicated. Adapted from: Heslop et al. (2012). ... 23 Figure 6 - Schematic representation of the main currents characterizing water circulation in the Western Mediterranean. Adapted from: Patarnello et al. (2007). ... 24 Figure 7 - Surface circulation scheme in the eastern Mediterranean basin, the Western Levatine feature (∑LW), and the Eastern Levantine feature (∑LE). Adapted from: Hamad et al. (2005) 25 Figure 8 - Map of global sea cucumber catch as exported to Hong Kong. Lines indicate great circle arc between the cities with the largest population in each country or region and Hong Kong. Colour reflects the starting year of the recent fishery. Source : Adapted from Anderson et
al. (2011). ... 27
Figure 9 - Current status of sea cucumber fisheries in global fisheries (nº of fisheries= 69). Source: adapted from Purcell et al. (2013). ... 28 Figure 10 - Adult sea cucumber Holothuria mammata. ... 31 Figure 11 - Geographical distribution of Holothuria mammata. Source: adapted from
CUMFISH Webpage. ... 31 Figure 12 - Location of the sampling sites in the Atlantic Ocean and Mediterranean Sea. (GC: Gran Canaria; PE: Peniche; OA: Olhos de Água; PF: Faro; MU: Murcia; MA: Mallorca Island; GI: Girona; KU: Kusadasi. ... 34 Figure 13 - Comparison of FST and He in polymorphic loci of Holothuria mammata to identify
outliers and potential candidates for selection using LOSITAN software under the IAM. Graphical output shows the simulated confidence area for neutral loci (pale grey shading),
12 positive selection (red area) and balancing selection (yellow bottom area). Loci outliers are tagged with labels. Locus Holmam_05474 is candidate for positive selection. ... 43 Figure 14 - Comparison of FST and He in polymorphic loci of Holothuria mammata to identify
outliers and potential candidates for selection using LOSITAN software under the SMM. Graphical output shows the simulated confidence area for neutral loci (pale grey shading), positive selection (red area) and balancing selection (yellow bottom area). Loci outliers are tagged with labels. Locus Holmam_05474 is candidate for positive selection ... 44 Figure 15 - Summary plot of estimates of Q at K=2. Each individual is represented by a single vertical line broken into K coloured segments, with lengths proportional to each of the K
inferred clusters. The abbreviations correspond to the predefined populations. ... 46 Figure 16- Relationship between pairwise FST and Geographic /Oceanographic distances for the
8 populations of H. mammata... 47 Figure 17 - Correspondence analysis plot based on the allele frequencies for the 8 populations of
H. mammata. ... 49
Figure 18 - Assignment tests of H. mammata individuals based on 10 microsatellite loci. The circular charts indicate the adjusted mean probability of the assigned individual actually
belonging to a given population, based on the exclusion-simulation test. ... 50 Figure 19- Column chart for each sampling location, showing the mutation scaled estimate of the effective populations size (Ne) for each sampling locality. ... 51 Figure 20- Weight - Frequency distribution of Holothuria mammata along all sampling
locations ... 53 Figure 21 – Length - Frequency distribution of Holothuria mammata along all sampling
locations ... 54 Figure 22 - Length-Frequency distribution of Holothuria mammata in Atlantic Ocean sampling localities ... 54 Figure 23 - Length-Frequency distribution of Holothuria mammata in Mediterranean Sea sampling localities ... 54 Figure 24 - Mean length in all sampled populations ... 55 Figure 25 - Mean weight in all sampled populations ... 55 Figure 26 - Mean length and weight considering Atlantic Ocean and Mediterranean Sea
populations ... 56 Figure 27 - Length-weight relationships and R-squared. ... 57 Figure 28-Magnitude of ∆K as a function of K (mean ± SD over 10 replicates) for 9
13
VI. LIST OF TABLES
Table I- Primers sequences, type of repeats, size, nº number of alleles found in 15 samples and annealing temperature for PCR amplification. ... 35 Table II-PCR conditions, with reagents concentration, number of cycles and temperatures, respectively ... 36 Table III: Primers sequences, type of repeats, size, nº number of alleles and annealing
temperature for PCR amplification. ... 41 Table IV-Estimates of FST values (Weir, 1996) for each pair of Holothuria mammata
populations considering (above diagonal) and not using (below diagonal) the ENA correction described in Chapuis and Estoup (2007). ... 42 Table V-Estimates of genetic diversity of the 8 sampling sites of Holothuria mammata from the Mediterranean Sea and Northeastern Atlantic Ocean. ... 42 Table VI-Estimates of genetic diversity of Holothuria mammata between the Mediterranean Sea and Northeastern Atlantic Ocean regions ... 43 Table VII: Pairwise fixation indices (FST) between 8 sampling localities of Holothuria mammata
(below diagonal) and respective p-values (above diagonal)... 44 Table VIII- Pairwise fixation indices (FST), (below diagonal) and respective p-values (above
diagonal). ... 45 Table IX-Total genic and genotypic differentiation between populations. ... 45 Table X : Mantel test coefficient of correlation (r) and respective p-values between genetic (i.e. FST) and geographic/oceanographic distances of Holothuria mammata ... 47
Table XI Analysis of molecular variance (AMOVA) among different groups setup. ... 48 Table XII-Migration rates (M = m/μ) based on 9 microsatellites loci of Holothuria mammata from sources (columns) to sink populations (rows). ... 52 Table XIII-: Heterozygosity excess/deficiency under different mutation models in all
populations and respective Sign and Wilcoxon tests. ... 52 Table XIV: Summary of the data used in Length-Weight relationship for Holothuria mammata. (N: number of individuals sampled; STD: standard deviation; Min: minimum value; Max: maximum value. ... 53 Table XV- ANOVA considering the “Locality” and “Regions” as factors. ... 55 Table XVI-Pairwise comparisons using t test. Bonferroni p-value adjustment method was applied. Below diagonal Weight, above diagonal Length. Significant p-values are in bold. ... 56 Table XVII: Coefficients of the linear model (EW vs. FW) for Holothuria mammata. ... 57 Table XVIII-Table output of the Evanno method results. Bold values shows the largest value in the Delta K column. ... 84
14
1. Introduction
1.1. State of the World Fisheries
Oceans, covering nearly 71% of Earth surface, are the oldest reservoir of biodiversity, being our main life support system. The goods and services provided from marine biodiversity are harboured on a huge and still increasing list, being the human the main beneficent (Roff & Zacharias, 2011). Earth’s population suffered an important growth during the last centuries, from about 600 million people in 1700 to 6.3 billion in 2003 (Cohen, 2003). According recent predictions, the current 7.2 billion is projected to increase by almost one billion people in the next eleven years, reaching 9.6 billion in 2050 (United Nations, Department of Economic and Social Affairs, 2013). As consequence of this population growth, the demand for food is also increasing specially from marine resources.
Despite apparent stabilization of overall global capture fisheries (at 90 million tonnes; Figure-1), the percentage of overexploited stocks has exhibited a general increasing trend in the last decades (32,5 % of global stocks in 2008 were overexploited), although more recent data shows a decreasing of overexploitation to 28,8% in 2011 (FAO, 2014) . In this thesis I will use the “stock” definition provided by Begg et al. (1999): ‘a “stock” describes characteristics of semi-discrete groups of fish/invertebrates with some definable attributes which are of interest to fishery managers’.
Figure 1: World capture fisheries and aquaculture production (Million tonnes) between 1950 and 2012. Source: adapted from (FAO, 2014)
15
Overfishing not only causes negative ecological consequences, it also reduces fish/invertebrate production, leading to adverse social and economic consequences. It is estimated that rebuilding overfished stocks could increase fishery production by 16.5 million tonnes and annual rent by $32 billion, which would increase the food security, economies and well-being of the coastal communities (FAO, 2014), especially in under-development countries, where marine food resources are a vital source of protein and essential nutrients.
From a global perspective, there is strong evidence that the trophic level of target species are decreasing, meaning a transition in landings from high (big predators) to low trophic levels (invertebrates and planktivorous pelagic fish). This situation is causing global decline of top predators and consequently, an increasing pressure shifted to non-finfish resources (Pauly, 1998). In fact since 1950 until present, invertebrates total global catch has been increasing from 2 to 12 million tonnes; nevertheless, this expansion has only been maintained due to new target species as cephalopods and echinoderms and a higher number of countries fishing invertebrates (Anderson et al., 2011a; Eriksson et al., 2012).
1.2. Genetics and Fisheries Management
Extensive evidence exists indicating the direct impacts of fishing on marine biodiversity, but also the collateral ones such as bottom trawling (e.g. Jones, 1992), by-catch (e.g. Hall et al., 2000) and discards (e.g. Harrington et al., 2005). However, only recently its being recognized that fishing has also effects on the biology and ecology of marine organisms, from changes on genetic diversity and structure of populations, to modifications on the structure and function of marine ecosystems (Pope et al., 2000; Stokes & Law, 2000; Scheffer & Carpenter, 2003; Stockwell et al., 2003; Kuparinen & Merila, 2007; Roff & Zacharias, 2011; Allendorf et al., 2014).
With the development of biochemical and molecular techniques, the discipline of population genetics has evolved from a theoretic field to a powerful empirical approach (Charlesworth & Charlesworth, 2009; Allendorf et al., 2013) . There are some subjects which can be address through the application of population genetics to fisheries management and to conservation (Ryman & Utter, 1987; Ward, 2000; Abaunza et al., 2008; Kochzius et al., 2010; Abdul-Muneer, 2014).
16
1.2.1. Genetic Diversity and Effective Population Size
Genetic diversity, is a useful parameter to assess the “health” or fitness of target species. In fact, the genetic diversity is recognized by the International Union for the Conservation of Nature (IUCN) like one of the three forms of biodiversity, that needs to be conserved (Roff & Zacharias, 2011) in order to maintain the evolutionary potential of species and populations (Allendorf et al., 2013). Overexploitation promotes the loss of genetic diversity (Allendorf et al., 2014; Pinsky & Palumbi, 2014), either by reducing population size directly and/or decreasing the number of migrants between local populations (Hindar et al., 2004; Allendorf et al., 2013). Nevertheless, the number of reproductively successful individuals, defined in population genetics as the effective population size or “Ne” (Watts et al., 2007), determines the level of inbreeding and the rate of loss of genetic diversity. When a species suffers strong reductions of its effective population size (e.g. by overfishing), the stochastic effect of genetic drift increases, unbalancing the drift-mutation equilibrium, in which the rate of mutation (i.e. source of diversity) is not enough to balance the loss of diversity determined by the genetic drift (Hare et al., 2011; Allendorf et al., 2014; Pinsky & Palumbi, 2014). Moreover, as Ne declines, the balance between natural selection and genetic drift is also altered, favouring changes in gene frequency (Hare et al., 2011). A reduced Ne could also erode the genetic variation by increasing the probability of fixation of deleterious alleles, instead of fixation of adaptive alleles chosen by selection, reducing overall fitness and limiting adaptive responses to environmental change (Allendorf et al., 2013). On the other hand, the use of historical Ne could be very useful to the fisheries management because the pre-exploitation estimates of abundance can be corrected, considering that demographic data from fisheries resources are normally collected after the onset of exploitation (Ovenden et al., 2013).
1.2.2. Population Genetic Structure
Most marine species are subdivided (or structured) in time and space by several local random mating units, or subpopulations (Roff & Zacharias, 2011; Allendorf et al., 2013). In fisheries management, these demographically cohesive groups of individuals are considered as stocks, although many other definitions have been provided until now (Çiftci, 2002; Ovenden et al., 2013 and references therein). Knowledge of populations
17
structure is critical for the understanding the biology of the species (Gharbi & Said, 2011) and especially important to their fishery management because of the delimitation of stocks could optimize the overall productivity and protect the most vulnerable populations (ICES, 2014). Moreover, preserving the population structure and the evolutionary processes that lead to structuring among populations (i.e. drift, selection, migration and mutation), will guarantee the range of diversity within a species over a variety of environmental conditions, and therefore enhance the natural resilience to perturbations (Eldridge et al., 2009).
1.2.3. Connectivity
Genetic connectivity or gene flow is the number of migrants interchanged between populations that successfully contribute to gene pool (Hedgecock et al., 2007a). Gene flow is an evolutionary force that reduces genetic differences between populations and increases variation within populations. Understanding population connectivity is an essential pre-requisite for implementing effective fishery management, either in delineation of appropriate scales for management as well in the development of networks of marine protected areas (MPAs) (Fogarty et al., 2007). A right design of MPAs network will maximize larval export and spillover of adults to adjacent fishing areas, allowing higher yields and profits, while maintaining self-persistence (i.e. inter-reserve connectivity) of their subpopulations (Halpern, 2003; White et al., 2008; Gaines et al., 2010).
1.2.4. Selection
Overharvesting promotes unnatural selection (i.e. fisheries), through removal of phenotypes most chosen by natural and sexual selection, and leaving survivors with relatively high fitness to the fishing selection, but less optimal with respect to natural selection, jeopardizing the evolutionary potential of species (Thériault et al., 2008;
Allendorf et al., 2013). In fish for example, about 20–30% of the variation in life-history traits, such as age and size at maturation, is heritable (Stokes & Law, 2000; Law, 2007), therefore the effects of harvesting on individual life histories should receive more attention.
18
Several examples have been published showing the fishery effects on the exploited stocks: reduced body size (Grift et al., 2003; Olsen et al., 2004; Consuegra et
al., 2005; Swain et al., 2007), earlier age at maturation (Grift et al., 2003; Olsen et al., 2004; Swain et al., 2007), slower growth rate (Swain et al., 2007), earlier time of
spawning (Consuegra et al., 2005), and low fecundity (Hutchings & Baum, 2005; Jørgensen et al., 2007; Biro & Post, 2008). Therefore, fisheries are an important source of selective pressures favouring particular life histories, morphologies and behaviours. Morphometric data such as length and weight, although being considered basic, can be useful for morphological and life historical comparisons between stocks at several spatial scales (Froese, 2006). These baseline data could help on the implementation of effective management and conservation policies, mainly when ecological and biological information from the new target species is lost, such as on European sea cucumbers (González-Wangüemert et al., 2014a).
Recent studies have also demonstrated that fisheries reduce the genetic diversity of the populations (Pérez-Ruzafa et al., 2006; Pinsky & Palumbi, 2014; González-Wangüemert et al., 2015). Genetic changes due to fisheries cannot be avoided in most cases, but they should be detected and measured their magnitude (Allendorf et al., 2014). Therefore, the genetic monitoring can reveal a comprehensive picture of the target population status, by assessing both ecological and evolutionary time frames, being this methodology more reliable and cheaper than traditional monitoring approaches (Schwartz et al., 2007).
1.3. Oceanographic Currents.
The marine realm allows many marine species to be widely distributed, through the dispersal of larvae, migration and aggregation (Roff & Zacharias, 2011). As referred previously, genetic studies can provide valuable information about connectivity patterns between populations; ocean currents could help to spatially predict how the connectivity occurs (Roff & Zacharias, 2011). Therefore, the general pattern of oceanographic surface circulation in our sampling distribution area is described below.
19
1.3.1. Northern Atlantic Ocean Surface Currents
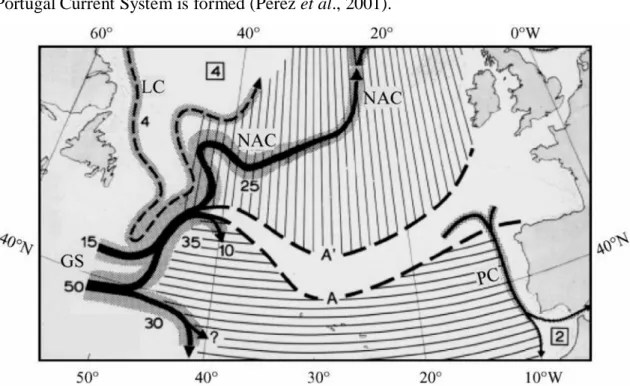
North Atlantic Current (NAC) reaches the meridian zone of the North Atlantic (Figure 2) divided in two main branches, one as a Northeast Drift Current called Eastern North Atlantic Central Water Subpolar mode (ENACWsp), and the other one as a Southeast Drift Current called Eastern North Atlantic Central Water subtropical (ENACWst) mode. Between the NAC modes there is a transition zone, where the Portugal Current System is formed (Pérez et al., 2001).
Figure 2- Surface circulation of the northern North Atlantic as derived from drift experiments (adapted from Krauss, 1986 in Pérez et al. (2001)). LC, Labrador Current; NAC, North Atlantic Current; GS, Gulf Stream; and PC, Portugal Current Meridionally-ruled area, flow associated with the NAC toward the north. Zonally-ruled area, flow associated with the northern limb of the Subtropical Front. Numbers are transports in Sverdrups (1 Sv"106m3 s~1).
This system is composed by a slow, offshore, basin scale equator-ward flow (Portugal Current, PC) and a fast, Iberian slope scale, seasonally reversing coastal flow, the Portugal Coastal Current. During Autumn/Winter, predominance of strong south-southwest winds, favours coastal convergence of surface circulation northwards, transporting warmer subtropical waters (ENACWst) over the upper slope and shelf break (aprox. 200 m deep) and preventing the off-shelf export of coastal water masses (Álvarez-Salgado et al., 2003). This surface poleward current is called the Portugal Coastal Counter-current (PCCC) and it is driven by the large scale atmospheric pressure distribution in the North Atlantic(Coelho et al., 2002) .
In late spring/summer, the increase in the pressure gradient between the Azores and Portugal induces the formation of north/northwestern winds, shutting down the
20
PCCC, and originating instead, a coastal upwelling and a southward surface current in the vicinity of the shelf break, the Portugal Coastal current (PCC). The PCC transports recently up-welled cold and nutrient rich ENACWsp in the north (>45º N), and warmer and nutrient poor ENACWst (<40º N) in the south.
However, recent studies ((Relvas et al., 2007; Nolasco et al., 2013) point out evidences that PCCC ( in these studies designated as the Iberian poleward current, IPC) is active during summer, suggesting interannual variability of the oceanographic regimes in the Iberian Coast.
Also on the Portuguese coast an undercurrent mixed with ENACWst and mediterranean outflow waters, extends vertically from 1500m to the bottom of surface mixed layer (Ambar (1986) in Coelho et al., 2002) and moves poleward permanently (Coelho et al., 2002). This subsurface occasionally reaches surface along the west and southwest coast, particularly in winter (Álvarez-Salgado et al., 2003).
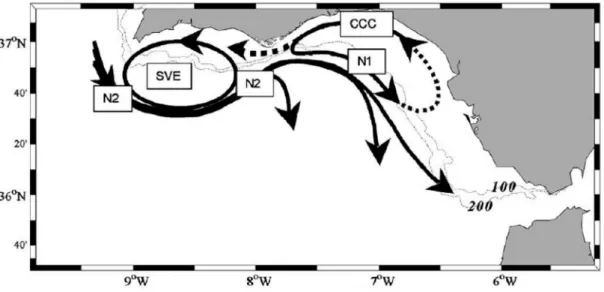
At the southeastern coast of Iberia (Figure 3), the Portuguese-Canary eastern boundary currents moves eastward into the Gulf of Cadiz, performing a quasi-permanent cyclonic eddy near the Cape of São Vicente, and moving further east towards the Strait of Gibraltar, feeding the Atlantic inflow into the Mediterranean Sea (Criado-Aldeanueva et al., 2006; García-Lafuente et al., 2006), and part, moves southward re-joining the Canary current.
Figure 3 – Scheme of the surface circulations in the Southern Iberian Coast and the Portuguese-Canary eastern boundary current that veers eastward into the Gulf of Cadiz, and eventually feeding the Mediterranean Sea. N2 is a branch of the larger-scale Portuguese–Canary eastern boundary current; SVE is the Cyclonic eddy off Cape San Vicente; N1 is cyclonic circulation bounded by a shelf break front; CCC is a warmer coastal counter current.
21
On northeastern Africa, the Portugal current (PC) and the Azores current, will feed the Canary Current (CC). This equator-ward, broad, yearlong surface flow, is influenced by summer upwelling events, in response to the trade winds. Further south, in the vicinity of the Cape Verde Islands, this current is divided curving toward the west helping to create the North Equatorial Current (Batteen et al., 2000; Barton, 2001).
1.3.2. Mediterranean Sea-Overall Functioning
This semi-enclosed sea is strongly affected by evaporation, precipitation, and river runoff (Millot & Taupier-letage, 2005). The Mediterranean Sea evaporation is the core engine that promotes the entrance of Atlantic Waters (AW) through the Strait of Gibraltar, in order to balance the difference in sea water levels between Northeastern Atlantic Ocean and Mediterranean Sea.
When AW passes through Gibraltar strait is modified increasing density due to evaporation, and suffering temperature changes due to climate seasonality. In winter, Northwestern and Northeastern Mediterranean basins, suffer marked cooling and evaporation, induced by cold dry air masses and strong northerly winds (Millot & Taupier-Letage, 2005). AW sink and mix with denser waters underneath creating the Levantine intermediate waters (LIW) and the Deep Mediterranean Waters (MWs).
Considering the volume of AW entering trough Gibraltar Strait, it is estimated that 90% of this water mass forms the LIW and MWs (10% evaporates), showing an average residence time of 50 to 100 years (Millot & Taupier-Letage, 2005). Finally, these colder, saltier and denser MWs outflow and diverge deeper in the northern Atlantic Ocean, where it can be recognised at 1000-1200 meters.
1.3.2.1.Western Mediterranean Sea Surface Currents
Western Mediterranean Sea (WMS) surface circulation is mainly driven by the inflow of AW (i.e. Atlantic jet, AJ) through the Strait of Gibraltar, wind patterns (André, G., P. Garreau, V. Vernier, 2005) orographic features and evaporation, producing different circulation regimes, seasonally and inter-annually. Therefore, we will consider in detail only the most prevailing circulation systems during summer and early autumn, covering the main reproduction season and larvae dispersal phase of
22
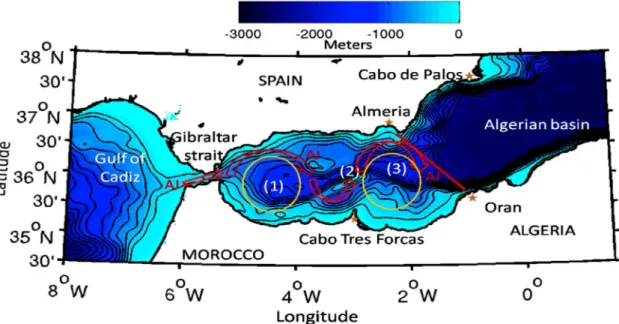
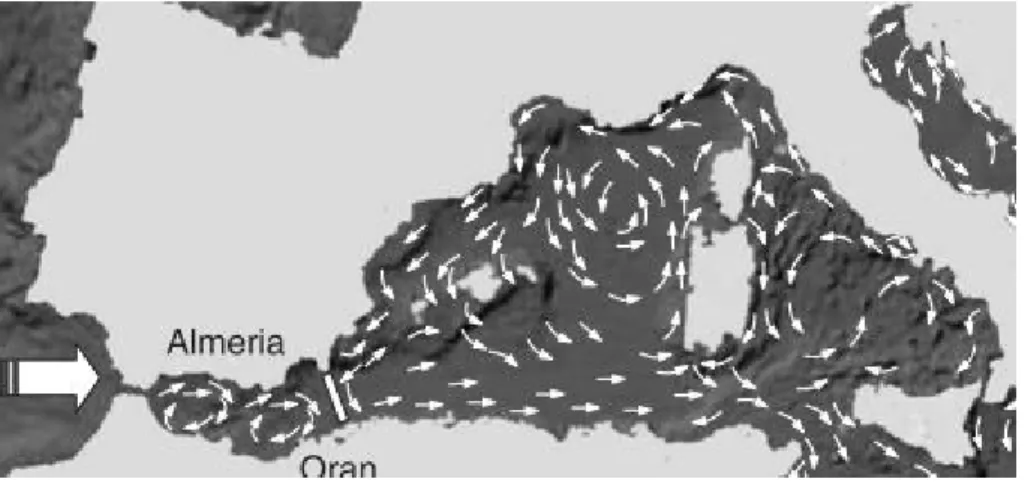
The influx of AW moves firstly northeastwards due to the orientation of the strait, and usually starts describing a year around persistent clockwise gyre in the west of the Alborán Sea, designated by Western Anticyclonic Gyre (WAG) and a second, less intense and recurrent clockwise gyre at east of Alborán Sea, called Eastern Anticyclone Gyre (EAG). Both Gyres are separated by the Alborán Ridge, and confined between the strait of Gibraltar at western limit and the Almeria-Orán front forming the eastern limit of the Alborán circulation system (Renault et al., 2012).
Figure 4- The red line represents Almeria-Orán front. The red arrows represent the boundary of the Atlantic Jet. And the orange circles display the Western Anticyclonic Gyre (WAG) and the Eastern Anticyclonic Gyre (EAG) positions, the numbers 1, 2, 3 in parentheses refer to the Western Alborán basin, the Alborán ridge, and the Eastern Alborán basin, respectively. Adapted from Renault et al. (2012).
The WAG and EAG circulation regime prevails in summers months (Figure 4), when AW kinetic energy (KE) is stronger, the single anticyclonic gyre (WAG) regime is more recurrent in winter months, when KE decreases (Millot & Taupier-Letage, 2005; Renault et al., 2012). The Almeria-Orán frontal zone separates this relatively fresh surface water mass with Atlantic origin, from the denser and modified Mediterranean water mass of the Algerian basin (Renault et al., 2012).
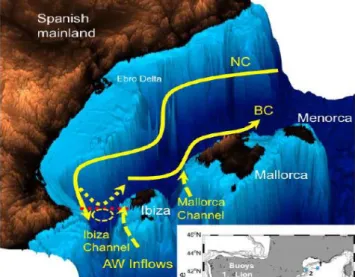
After restructuring itself due to the Coriolis effect, (Millot & Taupier-Letage, 2005), the AJ forms two main branches, the first one which is predominant when the EAG is well defined (i.e. in late Summer-early Autumn), flows into the Algerian sub-basin forming the Algerian current (AC), and the second branch (Figure 5) that inflows to the Northwestern sub-basin, through the Ibiza and Mallorca Channel, forming the Balearic Current (BC). The AC flows from Alborán Sea to the east along continental
23
slope of northern coast of Africa (Sayol et al., 2013) and the BC flows along the northwest coast of the Balearic Islands (Heslop et al., 2012).
Figure 5- The Balearic Sea with main currents Northern Current (NC), Balearic Current (BC) and AW inflows through the Ibiza and Mallorca Channels. A ‘blocking’ eddy (yellow circle dashed line) and the re-circulation of the NC above the eddy (yellow dashed line) are also indicated. Adapted from: Heslop et al. (2012).
The intensity of the EAG and Northern Current (NC) modulates the circulation to the eastern (to form the AC) as well as the inflow of AW to the Northwestern sub-basin (to form the BC), being only in summer when the NC decreases, that southern waters progressively invade the Balearic sub-basin (Pinot et al., 2002; Sayol et al., 2013).
The AC will generate wide cyclonic open sea eddies, some of them reaching the Balearic Islands (Millot & Taupier-Letage, 2005), but will continue to transport AW along slope, part through the western coast of Corsica forming the Corsica Vein, and the other part through the Channel of Sardinia to form the Tyrrhenian vein and Eastern Mediterranean vein (Figure 6). Both (Corsica, Tyrrhenian Vein) water masses will join at the Lingurian sea, reorganizing itself again as the Western Basin Gyre. This gyre will continue north-westerly along slope, forming the Northern Current near the Gulf of Lions. This modified cold saline water mass, will proceed southward, closing its cycle when exiting to the North Western sub-basin through the Ibiza channel, or/and being retroflected cyclonically to form, along with the inflow of AW, the Balearic Current (Sayol et al., 2013).
24
Figure 6 - Schematic representation of the main currents characterizing water circulation in the Western Mediterranean. Adapted from: Patarnello et al. (2007).
1.3.2.2. Eastern Mediterranean Surface Currents
After entering the Channel of Sicily, AW circulates southward, branching into Tunisia coast and shelf veins, and a third inter-annual meandering vein that flows northerly into the Ionian Sea, forming mesoscales eddies (Figure 7) (Hamad et al., 2005; Millot & Taupier-Letage, 2005). At Libia, both parts of Tunisian vein merge hence becoming a Libyan vein, moving along slope in eastward direction. Instability dominates the Libyan basin, promoting eddies that moves away from the Coast to southern Ionian (Hamad et al., 2005). The “Libyo-Egyptian Current” develop anticyclonic eddies, that moves and accumulate in the Western Levatine feature (∑LW).
Instability of the AW circulation in the Middle East slope, also promotes small scale eddies that accumulate and decay in the Eastern Levantine feature (∑LE). From the
Turkish slope until the Rhode Island, the Asia Minor current generates meanders, some of them evolving to small eddies (Millot & Taupier-Letage, 2005). The Eastern basin gyre at the Rhode Island enters the Aegean Sea and divides into a Northwestern and a Southwestern veins. The Northwestern vein flows along the Turkish slope most of the year, except in summer, where a sub-vein flows southward due to Melten winds and join the black sea outflow. The Southwestern vein moves along southern slope of Crete until Ierapetra, but then it flows toward ∑LW and again around the eastern Levantine.
Therefore most of AW exits via the Aegean west of Crete. AW continues northwards trough Ionian Sea, where it re-constitutes the eastern gyre before bifurcating into a northern vein that penetrates into the Adriatic and mixes with river run-off and eventually joins the westward vein that bypassed the Adriatic. Both ones continue along
25
the southern tip of the Italian peninsula and Sicily closing the Eastern Basin gyre circuit (Hamad et al., 2005).
Figure 7 - Surface circulation scheme in the eastern Mediterranean basin, the Western Levatine feature (∑LW), and the Eastern Levantine feature (∑LE). Adapted from: Hamad et al. (2005)
1.4. Study Case: Sea Cucumbers.
1.4.1. Ecological Role
Sea cucumbers comprise more than 1400 species worldwide belonging to 160 genus (Navarro, 2012). Ecologically, holothurians are important deposit and filter feeders having significant roles in recycling nutrients, stimulating microalgae growth, and mixing the upper sediment layers (MacTavish et al., 2012).
In benthic communities, they act as recyclers of nutrients and are agents of bioturbation (Uthicke, 1999), allowing the oxygenation and preventing the stratification and hardening of sediments (Bruckner et al., 2003). Moreover, they actively feed on benthic microalgae, fungi and bacteria, avoiding excessive development of
26
microorganisms, increasing the aerobic layer of sediments and avoiding eutrophication (Uthicke, 1999; Hamel & Mercier, 2008).
Some sea cucumbers consume large quantities of suspension or sediment organic matter, converging organic detritus and releasing nitrogenous compounds which can be used by algae (Uthicke & Klumpp, 1998; Uthicke, 2001) and seagrasses (Wolkenhauer et al., 2010), increasing their productivity, thus producing more available food for herbivores (Uthicke, 2001). Removal of sea cucumbers in some habitats may therefore reduce primary production for the whole food chain and negatively affect sediment infauna by reducing the aerobic layer of sediments (Uthicke, 1999; Purcell, 2013). Some sea cucumbers showing suspensivorous feeding are also helping to regulate water quality, carbonate content and pH of the water (Massin, 1982). Holothurians are also important preys for fish, seastars and crustaceans (Francour, 1997).
1.4.2. Food Potential and Sea Cucumber Fisheries
The decline of several traditional fin-fisheries (Hutchings & Baum, 2005; Pauly
et al., 2005; Eldridge et al., 2009), brings our concern to one heavily exploited
invertebrate: sea cucumbers. They are also known as “beche-de-mer,” “trepang,” or “haisom” and are mainly an Asiatic feeding custom, (Chen, 2003). They have been a popular luxury food item in the Asian dried seafood markets for centuries (Purcell, 2013), but also considered as medicine (Chen, 2003) and aphrodisiac (Ramón et al., 2010a). Holothurian nutritional profiles have demonstrated the presence of high protein content, antioxidant and bioactive compounds (Bordbar et al., 2011; Roggatz, 2012) .
Records from their utilization can be traced back to 1368–1644 BC in China (Chen, 2003) but during this last millennium the Indo-Pacific regions have started to harvest and trade sea cucumbers driven primarily by the Chinese demand (Anderson et
al., 2011b). During the last 6 decades sea cucumber fisheries have grown exponentially
with an increase in global captures of 2300 tonnes of wet weight in 1950 to 30 500 tonnes of wet weight in 2006 (Conand & Bryne, 1993; Anderson et al., 2011b) and 100 000 tonnes in 2010 (FAO, 2010). In 2000, about 6 000 tonnes of processed (i.e. mostly dried) animals were exported to Asian markets, having a value over 130 million US dollars (FAO, 2010).
27
Nowadays, at least 3 million fishers from 70 countries worldwide capture sea cucumber (Purcell, 2013), in which most of landings are exported to Hong Kong and then re-exported mainly to China (Anderson et al., 2011b), with some target species like
Apostichopus japonicus reaching almost US$ 3000/kg (Purcell et al., 2012) (Figure 8).
Figure 8 -Map of global sea cucumber catch as exported to Hong Kong. Lines indicate great circle arc between the cities with the largest population in each country or region and Hong Kong. Colour reflects the starting year of the recent fishery. Source : Adapted from Anderson et al. (2011).
Although 66 species of sea cucumbers represent global captures of about 100 000 tonnes annually (FAO, 2010) there is a lack of biological information for some of these target species (Ramón et al., 2010). In general, sea cucumbers have some biological traits that makes them quite vulnerable to fisheries such as slow growth rate, late age at maturity, high larval mortality, low rate of recruitment, slow rate of movement and easy access by fisherman (Uthicke et al., 2004; FAO, 2010; Anderson et
al., 2011b; Purcell et al., 2013). Moreover, due to their synchronized gonochoric
broadcast spawning behaviour, their fertilization success is population density-dependent, meaning that if densities are reduced by 50 % , it can result in a reduction of more than 50% in recruitment (Uthicke & Conand, 2005), a process called Allee effect (Allee, 1938).
Purcell et al. (2013) carried out a global analysis assessment, finding that 58% of sea cucumber fisheries were overexploited (contrasting with the 30% overexploitation of global stocks of fish (FAO, 2012)), 14% fully exploited, and 27 % non-fully exploited (Figure 9)
28
Figure 9 - Current status of sea cucumber fisheries in global fisheries (nº of fisheries= 69). Source: adapted from Purcell et al. (2013).
Considering the ever increased demand by Asian consumers and that most Indo-Pacific fisheries of sea cucumber are overexploited, depleted or in a moratorium state, countries already started to explore new target sea cucumber species, with increasing popularity in Asian market (Sicuro & Levine, 2011). Fisheries of sea cucumber are being developed in Northeastern Atlantic Ocean and Mediterranean Sea (Sicuro & Levine, 2011; González-Wangüemert et al., 2013b, 2015) being their main target species H. sanctori, H. mammata, H. tubulosa, H. polii, H. arenicola and Paratichopus
regalis (Abdel Razek et al., 2007; Aydin, 2008).
In Turkey, harvest and exportation to Asian market rapidly increased from 20 tonnes of sea cucumber in 2002 (Aydin, 2008) to 555 tons in 2012 (González-Wangüemert et al., 2014a), provoking the reduction of genetic diversity, size and weight of individuals from the main fishery areas (González-Wangüemert et al., 2014; 2015). Italy has initiated small-scale harvesting and processing sea cucumbers for exportation and local consumption mainly in southern regions (Sicuro & Levine, 2011; Sicuro et al., 2012). Spain has been traditionally harvesting P. regalis which is considered a delicacy, and the most valued seafood in the Catalan market, reaching up to €130/kg (Sicuro & Levine, 2011; González-Wangüemert et al., 2014b; Maggi & González-Wanguermert, 2015). In Spain, more than 10 companies are exporting sea cucumbers (H. tubulosa, H. forskali, H. mammata) to China (http://www.alibaba.com/countrysearch/ES/sea-cucumber-supplier.html), some of them with 1-2 millions $ US of total revenue. In Portugal, several companies (e.g. Omegauasia Lda) are selling sea cucumbers, mainly Holothuria arguinensis, H. sanctori, H. forskali and H. mammata, offering supply ability among 2.000-50.000 Kg/month and prices
29
oscillating among 70-350 euro/kg ( http://www.alibaba.com/countrysearch/PT/sea-cucumber.html) depending on quality of product.
All these data show that sea cucumber fisheries in the Mediterranean Sea and Northeastern Atlantic Ocean are starting to become an active industry. Given that most sea cucumber fisheries worldwide have not had an effective management due to the lack of biological, genetic and ecological data (among another reasons), it is mandatory to initiate studies focused on these new target species of sea cucumbers from the Mediterranean Sea and Northeastern Atlantic Ocean in order to assess their growth, mortality rates, longevity, reproductive biology, larval duration, genetic diversity, connectivity and genetic structure. All this information will allow a better understanding of the sea cucumber population dynamics, fishery effects and the delimitation of their stocks as management units.
1.4.3. Pharmacological Potential
Although the Chinese people have been using sea cucumber for medicinal purposes since more than 3000 years (Chen, 2003), only recently it has been demonstrated the antimicrobial, antioxidant, and anticancer potential of sea cucumbers (Sicuro & Levine, 2011; Roggatz, 2012). New compounds are being discovered, such as anti-malaria and anti-HIV therapy drugs (Sicuro & Levine, 2011) and also new biochemical compounds for fighting cancer with less toxicity than traditional ones (Attoub et al., 2013).
1.4.4. Integrated Multi-Trophic Aquaculture Potential
Aquaculture is one of the fastest-growing food producing sectors in the World, providing almost half of all fish for human consumption, and it is projected to rise to 62 % in 2030 (FAO, 2014), a near future in which the human population is expected to reach around 8.3 billion people (United Nations, 2013).
With increasing fishing pressure on wild stocks worldwide, responsible and regulated aquaculture development seems a sustainable way of supplying part of the demand from worldwide markets, releasing the pressure from wild populations and supporting efforts to preserve natural populations. However, standard aquaculture systems produce a large amount of particulate organic matter derived from unconsumed
30
feed, faeces and inorganic nutrient excretions (Troell et al., 2003; Slater & Carton, 2007; Yokoyama, 2013). This could result in excessive release of dissolved nutrients into the water column, promoting harmful algal blooms and poisoning the farmed fish and surroundings (Neori et al., 2004; Imai et al., 2006). Moreover the increased bio-deposition below the fish cages is known to change the chemistry of the bottom (Richardson, 2008; Yokoyama, 2013), shifting in most cases the composition of benthic communities from oxygen sensitive species to opportunistic species (Troell et al., 2003).
Integrated Multi-Trophic Aquaculture (IMTA) is a promising alternative that reassures greater environmental stewardship while increasing economic benefits for farmers and communities. The underlying principle is based on an ecosystem approach and involves growing several commercial species, with different trophic levels but with direct trophic linkage in the same system (Hughes & Kelly, 2006; Barrington et al., 2009) . On this way uneaten feed, wastes, nutrients and by-products of fed species (e.g. finfish, shrimp) could be recaptured and converted into fertilizer, feed and energy for the growth of organic extractive species as filter feeders (e.g. mussels) and deposit feeders (e.g. sea urchins, sea cucumbers) and inorganic extractive species (e.g. sea weeds). IMTA has the advantage of providing diverse and safe food products (Neori et
al., 2004), extra income to farmers (Troell et al., 2003; Yokoyama, 2013) and
mitigation of the environmental impacts caused by aquaculture facilities, increasing the carrying capacity of farming areas and consequentially improving the overall health of the site with minimum potential risks to wild and cultured species (Rawson et al., 2002;
Barrington et al., 2009). Due to their ecological characteristics (i.e. filter and/or deposit
feeders), high global demand and alarming levels of overfishing, sea cucumbers are a suitable candidate for co-culture in the recently developing IMTA systems (Slater & Carton, 2007; Nelson et al., 2012; Yokoyama, 2013; Domínguez-Godino et al., 2015), mainly because they can fill one of the main ecological niche of IMTA by filtering the larger organic matter particles (Nelson et al., 2012).
1.5. Biological Model: Holothuria mammata (Grube, 1840)
Sea cucumbers are invertebrates from the phylum Echinodermata, having a limbless soft bodied, with a cucumber form. The genus Holothuria belongs to family
31
Holothuriidae and is one of the most diverse genus in the Holothuroidea class (Borrero-Pérez et al., 2010).
Figure 10 - Adult sea cucumber Holothuria mammata.
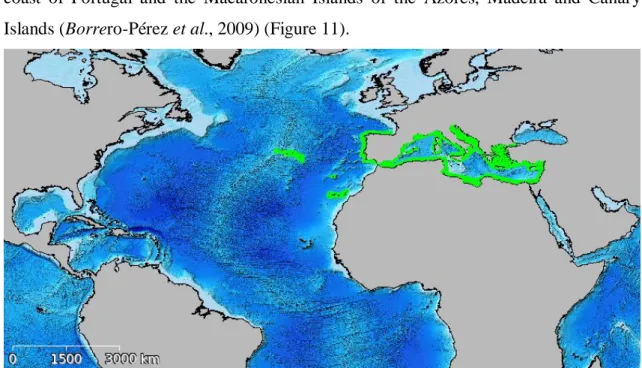
Holothuria mammata is a temperate species occurring throughout the
Mediterranean Sea and Northeast Atlantic Ocean, including the continental Atlantic coast of Portugal and the Macaronesian Islands of the Azores, Madeira and Canary Islands (Borrero-Pérez et al., 2009) (Figure 11).
Figure 11 -Geographical distribution of Holothuria mammata. Source: adapted from CUMFISH Webpage.
H. mammata coloration has scarce variation, with uniform dark purplish brown
32
side is densely covered by pedicles which are organized in 5 rows. The species has small Cuvierian tubules but few in number and never expelled (Borrero-Pérez et al., 2011; Navarro, 2012). Its lenght average is 23 cm, and may reach 35 cm in Canary islands (Navarro et al., 2013), and ranged between 13 to 25cm in Ria Formosa (Siegenthaler, 2013).
They can be normally found within rocks crevices showing mainly nocturnal activity (Navarro, 2012; Navarro et al., 2013). Despite its rocky habitat preference, H.
mammata was also found on sandy/muddy bottoms with seagrass from Ria Formosa
coastal lagoon (Portugal), although showing low densities (González-Wangüemert et
al., 2013a; Siegenthaler, 2013).
Scarce information is available about the reproduction or larval duration on this species. Santos (2013) established that the maximum sexual maturation state (Gonadosomatic Index, GSI) of H.mammata from Peniche (W Portugal) is reached only in April, suggesting a single annual spawning season in this region.
Recent breeding and rearing trials, showed that they have a broadcast spawning behaviour in mid-summer with a planktotrophic larval cycle duration of 19 days until the pentactula settlement stage (Dominguez-Godino, personal communication).
33
2. Objectives
The main purpose of this study is to characterize genetically populations of
Holothuria mammata from 8 localities, four of them belonging geographically to
Northeastern Atlantic, and the other ones to Mediterranean Sea. Its genetic diversity and structure will be analysed considering several spatial scales.
Moreover, morphometric data (weight vs. length) will be studied through their frequency distributions, in order to implement baseline data for future morphological comparisons between stocks with different fishery pressure. This assessment will be fundamental to initiate proper management policies in order to conserve this novel target species. Therefore, this work is focused on these particular aims:
1. To evaluate the genetic diversity patterns of H. mammata through its geographical distribution.
2. To assess the genetic structure of this target species at different spatial scales considering the role of current and historical barriers to gene flow in several potential genetic breaks: Atlantic and Mediterranean basins, Western and Eastern Mediterranean Sea, geographical isolation of the oceanic islands (Canary archipelago) and isolation among coastal vs. islands samples.
3. To establish the potential stocks present in our study area considering the genetic and morphological data.
4. To estimate the effective size of H. mammata populations.
5. To evaluate the status of the target species by analysing the distribution of size and weight classes of their populations.
6. To discuss potential impacts of fisheries on H. mammata under genetic and morphological perspectives.
7. To suggest first recommendations towards sustainable management of the H.
34
3. Methodology
3.1. Sampling
The samples were caught under the CUMFISH project
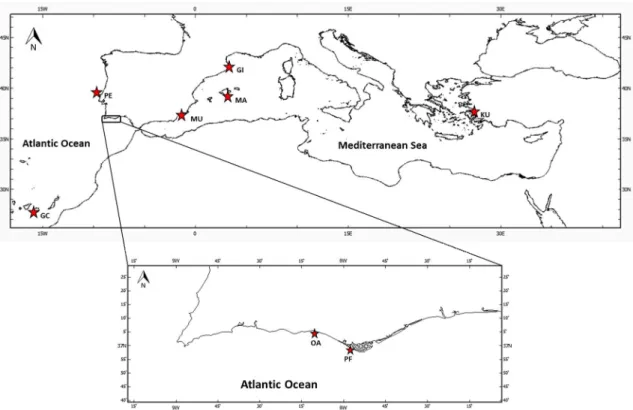
(PTDC/MAR/119363/2010) in which all individuals were collected by scuba diving and free diving between 2011 and 2013.Thirty-five individuals were sampled from each locality (Figure 12), except for Canary Islands where only 20 individuals were caught because this location is considered the south boundary of H. mammata distribution, being its density there lower than in other locations. Holoturia mammata individuals were identified on the basis of external characters and habitat, sacrificed by freezing and preserved in 100% ethanol until tissue dissection. Tissue samples of internal muscle bands or wall were removed from each specimen and preserved in 100% ethanol.
Figure 12 - Location of the sampling sites in the Atlantic Ocean and Mediterranean Sea. (GC: Gran Canaria; PE: Peniche; OA: Olhos de Água; PF: Faro; MU: Murcia; MA: Mallorca Island; GI: Girona; KU: Kusadasi.
35
3.2. DNA Extraction, PCR Amplification and Screening
Total genomic DNA was extracted from muscle tissues according to the procedure of Sambrook et al. (1989), with minor modifications.
The development of the Holothuria mammata specific primers for microsatellites, was performed by Ecogenics™ from 15 samples belonging to different locations. Size selected fragments from genomic DNA were enriched for SSR content by using magnetic streptavidin beads and biotin-labeled CT and GT repeat oligonucleotides. The SSR enriched library was analyzed on a Roche 454 platform using the GS FLX titanium reagents.
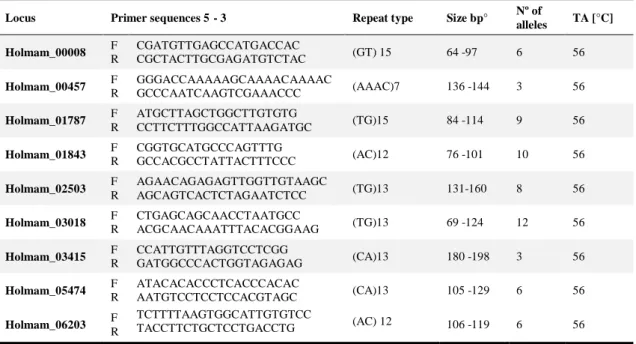
The total 7’082 reads had an average length of 159 base pairs. Of these, 435 contained a microsatellite insert with a tetra- or a trinucleotide of at least 6 repeat units or a dinucleotide of at least 10 repeat units. Suitable primer design was possible in 138 reads, of which 52 were tested for polymorphism. Finally nine microsatellites were chosen according to feasibility and genetic diversity criteria (Table I).
Table I- Primers sequences, type of repeats, size, nº number of alleles found in 15 samples and annealing temperature for PCR amplification.
Locus Primer sequences 5’- 3’ Repeat type Size bp° Nº of
alleles TA [°C] Holmam_00008 F
R
CGATGTTGAGCCATGACCAC
CGCTACTTGCGAGATGTCTAC (GT) 15 64 -97 6 56
Holmam_00457 F R GGGACCAAAAAGCAAAACAAAAC GCCCAATCAAGTCGAAACCC (AAAC)7 136 -144 3 56 Holmam_01787 F
R
ATGCTTAGCTGGCTTGTGTG
CCTTCTTTGGCCATTAAGATGC (TG)15 84 -114 9 56
Holmam_01843 F R CGGTGCATGCCCAGTTTG GCCACGCCTATTACTTTCCC (AC)12 76 -101 10 56 Holmam_02503 F R AGAACAGAGAGTTGGTTGTAAGC AGCAGTCACTCTAGAATCTCC (TG)13 131-160 8 56 Holmam_03018 F R CTGAGCAGCAACCTAATGCC ACGCAACAAATTTACACGGAAG (TG)13 69 -124 12 56 Holmam_03415 F R CCATTGTTTAGGTCCTCGG GATGGCCCACTGGTAGAGAG (CA)13 180 -198 3 56 Holmam_05474 F R ATACACACCCTCACCCACAC AATGTCCTCCTCCACGTAGC (CA)13 105 -129 6 56 Holmam_06203 F
R
TCTTTTAAGTGGCATTGTGTCC
36
Samples from 248 individuals were screened for variation at each of ten microsatellite loci. Polymorphisms were tested by PCR, performed according to conditions shown in Table II.
Table II-PCR conditions, with reagents concentration, number of cycles and temperatures, respectively
Reagents Stock concentration Amount [μl] Final amount/
Concentration PCR cycle
ddH2O - 4.1 4.1 μl
Buffer solution* 10x 1 1x 95°C → 15 min
dNTPs 2 mM 1 200 μM 95°C → 30 s 56°C → 45 s 72°C → 45 s 30 Cycles FW. Primer° 2 μM 0,2 0,04 μM RV. Primer 2 μM 0,8 0,16 μM M13 Primer°° 2 μM 0,8 0,16 μM
Hotstar Taq 5 u/μl 0,1 0,5 u 95°C → 30 s
DNA 5 ng/μl 2 10 ng 53°C → 45 s 72°C → 45 s 72°C → 30 min 10°C → ∞ 8 Cycles * Qiagen, buffer stock (10x) containing 15 mM MgCl2
° with 18 bp M13-tail (5’-TGTAAAACGACGGCCAGT-3’) at 5’-end
°° labelled with a fluorescent dye
Individuals were genotyped by assessing allele size on an ABI 3700 automated sequencer, using forward primers labelled with 6FAM (SIGMA), HEX (SIGMA) and NED (Applied Biosystems). Genotyping was performed through two multiplexes of five/four microsatellites each. Allele scoring was carried out using STRand v2.4.59.
3.3. Genetic Analysis
3.3.1. Genetic Diversity
As parameters of genetic diversity were considered: total and mean number of alleles, number of private alleles, allele frequencies, expected (He) and observed (Ho) heterozygosity. They were calculated using Genetix v.4.05.2 (Belkhir et al., 1996-2004) Genetic linkage disequilibrium between locus pairs was estimated according to Weir and Cockerham (1979) and tested on contingency tables under the null hypothesis of independence (P <0.05) (Genetix v. 4.05.2).
Deviations from Hardy-Weinberg (HWE) genotype proportions were characterized by FIS and tested using exact test in the software Genepop version 4.2.1
(Rousset, 2008). The observed genotype frequencies which deviated significantly from HW proportions, were analysed through the program Micro-Checker v.2.2.3 (Van