Population Genomics of the Euryhaline
Teleost
Poecilia latipinna
J. C. B. Nunez1☯¤, T. P. Seale1☯, M. A. Fraser1☯, T. L. Burton1☯, T. N. Fortson1☯, D. Hoover2, J. Travis2, M. F. Oleksiak1, D. L. Crawford1*
1University of Miami, Rosenstiel School of Marine and Atmospheric Science, 4600 Rickenbacker Causeway, Miami, FL 33149, United States of America,2Department of Biology, Florida State University, Tallahassee, FL 32306, United States of America
☯These authors contributed equally to this work.
¤ Current address: Brown University, Department of Ecology and Evolutionary Biology, 171 Meeting Street, Providence, RI 02912, United States of America
Abstract
Global climate change and increases in sea levels will affect coastal marine communities. The conservation of these ecologically important areas will be a challenge because of their wide geographic distribution, ecological diversity and species richness. To address this problem, we need to better understand how the genetic variation of the species in these communities is distributed within local populations, among populations and between distant regions. In this study we apply genotyping by sequencing (GBS) and examine 955 SNPs to determine Sailfin molly (Poecilia latipinna) genetic diversity among three geographically close mangrove salt marsh flats in the Florida Keys compared to populations in southern and northern Florida. The questions we are asking are whether there is sufficient genetic variation among isolated estuarine fish within populations and whether there are significant divergences among populations. Additionally, we want to know if GBS approaches agree with previous studies using more traditional molecular approaches. We are able to identify large genetic diversity within each saltmarsh community (π36%). Additionally, among the Florida Key populations and the mainland or between southern and northern Florida regions, there are significant differences in allele frequencies seen in population structure and evolutionary relationships among individuals. Surprisingly, even though the cumulative FSTvalue using all 955 SNPs within the three Florida Key populations is small, there are 29
loci with significant FSTvalues, and 11 of these were outliers suggestive of adaptive
diver-gence. These data suggest that among the salt marsh flats surveyed here, there is signifi-cant genetic diversity within each population and small but signifisignifi-cant differences among populations. Much of the genetic variation within and among populations found here with GBS is very similar to previous studies using allozymes and microsatellites. However, the meaningful difference between GBS and these previous measures of genetic diversity is the number of loci examined, which allows more precise delineations of population structure as well as facilitates identifying loci with excessive FSTvalues that could indicate adaptive
divergence. OPEN ACCESS
Citation:Nunez JCB, Seale TP, Fraser MA, Burton TL, Fortson TN, Hoover D, et al. (2015) Population Genomics of the Euryhaline TeleostPoecilia latipinna. PLoS ONE 10(9): e0137077. doi:10.1371/journal. pone.0137077
Editor:Aristeidis Parmakelis, National & Kapodistrian University of Athens, Faculty of Biology, GREECE
Received:February 13, 2015
Accepted:August 11, 2015
Published:September 3, 2015
Copyright:© 2015 Nunez et al. This is an open access article distributed under the terms of the
Creative Commons Attribution License, which permits unrestricted use, distribution, and reproduction in any medium, provided the original author and source are credited.
Data Availability Statement:Raw sequence files for all 144 individual are available at NCBI SRA (BioProject PRJNA280774). Other data are available at Dryad (DOI: doi:10.5061/dryad.kd00n).
Funding:Most of this research was supported by the University of Miami’s Marine Science undergraduate program. Additional support for the adaptor primers was from National Science Foundation, Molecular and Cellular Biosciences 1158241 to MFO (http:// www.nsf.gov/div/index.jsp?div=MCB).
Introduction
Global climate change (GCC) is a driving force behind many disturbances affecting global eco-systems [1,2]. Among the ecosystems disturbed by climate change, coastal habitats are particu-larly vulnerable. They are threatened not only by increasing temperatures and rising sea levels [3], but also by anthropogenic stressors such as pollution, overharvesting, and habitat alter-ation [4,5].
Several studies have shown that ecosystems displaying broader ranges of biodiversity or spe-cies richness tend to be more resistant or resilient to disturbances [6–9]. More recent studies have shown that genotypic diversity plays an analogous role to species diversity,i.e. genetically diverse populations are more resilient in the face of disturbances than those that are less diverse [5,10–12]. As a result, theInternational Union for Conservation of Nature(IUCN) has declared the conservation of genetic diversity to be an necessity [13]. Genetic diversity may also be important to enhance the ability of populations to adapt to rapid environmental changes [14– 16]. Thus for conservation practices, especially with GCC, we need to understand not only the spatial distribution of population size and density but also the distribution of genetic diversity. South Florida Keys coastal habitats may be particularly susceptible to GCC. These ecosys-tems have been under constant threats of habitat loss and reduction in species diversity due to rising sea levels [17,18]. In the Florida Keys, these coastal habitats, predominantly mangrove-dominated salt marshes, are subdivided due to human development and the island habitat. Furthermore, the populations in these mangrove-dominated salt marshes can be isolated from one another because they are not flooded by daily tides that could allow easy movement of individuals among locations but instead are only occasionally flooded by seasonal high tides, hurricanes, and rainfall [18,19]. Characterizing the genetic diversity within and among these coastal habitats can help us ascertain a) if individual populations harbor substantial genetic variation, b) whether the distribution of genetic variation among populations suggests that individual populations have some connectionsviathe exchange of migrants, and c) whether there is evidence that populations occupying even slightly different habitats may show adaptive differentiation. Addressing these issues provide the necessary data to help inform conservation efforts.
In this study we focus on populations of the euryhaline fish, sailfin mollies (Poecilia lati-pinna) inhabiting mangrove saltwater flats. Sailfin mollies are a well-adapted species of top-minnow with extraordinary resilience to salty, fresh and brackish waters that inhabit Florida saltwater flats. We apply Genotyping by Sequencing (GBS) to define the variation at 955 single nucleotide polymorphic sites (SNP). We use these data to address two broad questions: i) do GBS approaches agree with previous studies using more traditional molecular approaches and ii) what is the level of genetic variation within and among populations. Similar to previous studies using allozymes and microsatellites [20,21], the GBS data suggest that most of the vari-ation in southern Florida populvari-ations is within populvari-ations. Additionally, the large number of loci allows us to examine whether the distribution of some SNPs suggests adaptive divergence among populations. We conclude that even in the Florida Keys (<10 km apart) there is readily
detectable genetic divergence among these well-connected populations.
Materials and Methods
populations were collected from spatially isolated ponds with different environmental condi-tions (Table 1). One hundred and twenty individuals (thirtypersite) were collected from South Florida populations; sixteen individuals were collected from the North Florida population. Fish were collected near shore using minnow traps and dip nets. All fish were returned to the local environment after removing small (<10mm2) fin clips. Collected fish were measured for
stan-dard length, and fin clips were stored in 320 ul of Chaos buffer (4.5M guanadinium thiocynate, 2% N-lauroylsarcosine, 50mM EDTA, 25mM Tris-HCL pH 7.5, 0.2% antifoam, 0.1M ß-mer-captoethanol) and stored at 4°C prior to processing. Genomic DNA was isolated using a silica column [22]. Genomic DNA quality was assessedviagel electrophoresis, and concentrations were quantified using Biotium AccuBlue™Broad Range dsDNA Quantitative Solution accord-ing to the manufacturer’s instructions.
GBS was preformed as described [23] using the restriction enzymeAse I. Adaptors (0.4 pmol/sample) were ligated to 50 ng of gDNA. The GBS library was sequenced on a single lane using Illumina HiSeq 2500 with a 100 bp single end read (Elim Biopharmaceuticals, Inc.). The
Table 1. Collection Sites and Sample Size.
Location N (120 individuals) Latitude Longitude Salinity (‰)
North Florida, Wacissa River (WR) 14 30°20’21.29”N 83° 59’32.48” Fresh
Miami-Dade, Crandon Park 24 25°43'31.17"N 80° 9'4.09"W 35.0
Big Pine Key, Cahill Rd (BPC) 27 24°40'6.92"N 81°22'8.44"W 50.0
Big Pine Key, No Name Road (BPN) 27 24°43'39.08"N 81°23'44.45"W 45.0
No Name Key (NNK) 28 24°42'5.95"N 81°19'52.65"W 35.0
N sample size afterfiltering data (see text),*Salinity was determine when collecting samples.
doi:10.1371/journal.pone.0137077.t001
Fig 1.Poecilia latipinnacollection sites.The study uses a nested analysis for individuals collection across Florida in two two regions,A:North Florida and South Florida. Within the southern regions were two locations,B:Crandon and the Florida Keys. Within the Florida Keys, individuals were collected at three locations,C:Big Pine Key N, Big Pine Key C and No Name Key.
UNEAK GBS analysis pipeline, TASSEL [24], was used to call SNPs using Bowtie. Only the first 64 bp of each sequence (Tag) was retained. This minimizes the errors in sequence calls associated with the end of 100 bp sequences [24].
We examined pairwise differences within and among populations (number of differences between a pair of individuals per SNP100%), heterozygosity, Hardy-Weinberg equilibrium,
migration rates, FSTvalues, and outlier FSTidentification using the“ape”package in the R
sta-tistical computing environment [25], Arlequin v.3.5.12 [26] and LOSITAN [27]. FSTvalues
cal-culated by FDist2 LOSITAN [27] and Arlequin v.3.5.12 [26] were very similar, but the p-values were different because they are based on different permutations of the data. FDist2 defines sig-nificance based on permutation of SNPs with similar expected heterozygosites. Arlequin defines significance permutations of individuals. Migration estimations were determined using a matrix of Slatkin’s linearized FST[28]. Estimates of effective population size (Ne) use
Arle-quin v.3.5.12 [26] and a Bayesian historic approximation [29] using>250,000 simulations.
Population structure was defined by fastSTRUCTURE [30], and RaXML was used to build a maximum likelihood tree [31]. Isolation by distance (IBD) and discrimination analyses used the R-package“adegenet”[32,33]. IBD was tested using a Mantel test between a matrix of genetic distances and a matrix of geographic distances. Discriminant analysis of principal com-ponents (DAPC) was used to discern differences among populations. In contrast to Structure, DAPC does not assume unrelatedness, and therefore, potentially closely related individuals can be included in the analysis.
Analyses for outlier SNPs were performed using LOSITAN (FDist2) [34] and Arlequin v.3.5.12. FDist2 comparisons were performed among the five populations, among the three Florida Keys populations and the Miami-Dade population, among the three Florida Keys pop-ulations and northernversussouthern populations. For the last FDist2 comparison (Northvs. South), the four South Florida populations were treated as a single population. Comparisons were run using 500,000 simulations at a 99% confidence interval and a false discovery rate (FDR) of 0.01. Arlequin outlier analyses were conducted using a hierarchical model [35] with 10,000 coalescent simulations and 100 demes simulated per group. Coalescent simulations between the three Florida Keys could not be performed individually due to their high migration rate. Thus, we treated these locations as a single population in the hierarchical outlier test. We performed three comparisons: 1) among all populations (Keys (as a single population), Cran-don Park in Miami-Dade and North Florida), 2) between the Keys and CranCran-don Park in Miami-Dade, and 3) between South Florida (treating the four South Florida locations as a sin-gle population) and North Florida populations.
To identify the genes with outlier SNPs, we searched GenBank at the National Center for Biotechnology Information (NCBI) using the 64 bp sequence tags containing these SNPs. Spe-cifically, the nucleotide Basic Local Alignment Search Tool (nBLAST) at NCBI was searched among Actinopterygi sequences (ray-finned fishes; taxid:7898), using highly similar sequences search algorithm (megaBLAST) and accepting matches with E values less than 1oE-5. All other parameters were used as default.
Ethics Statement: Fieldwork was completed within publically available lands and no permis-sion was required for access.Poecilia latipinnais not endangered or protected status, and small marine minnows do not require collecting permits for non-commercial purposes. All fish were captured in minnow traps with little stress and released in less than 1 hour. Fish were returned to the site of capture with little obvious effect of sampling small fin clips (<4mm x 4mm).
Results
Nested Sampling
There is a nested set of five Florida populations with a total of 120 individuals (Fig 1,Table 1). The nesting consists of the northern and southern region: the southern region (Crandon Park in Miami-Dade County and the Florida Keys) and the northern region (WR, n = 14) in the Florida panhandle. Within the southern region were two locations: the Florida Keys with three populations (Fig 1B; Big Pine Key: BPC, n = 27, BPN, n = 27 and No Name Key: NNK, n = 28, and Crandon Park in Miami-Dade County, n = 24). The geographic distances among the three populations in the Florida Keys are small (<10 km). Within the southern regions, Crandon
Park is approximately 180 km from the Keys, and between the southern and northern regions, the distance is>600 km (Fig 1). The four populations in the south Florida region were
col-lected in mangrove salt flats with salinities ranging from 35 ppt to 5o ppt (Table 1). The most northern population was collected in freshwater at the headwaters of the Wacissa River.
Population sizes were estimated using a Bayesian approach [29]. These data suggest that population sizes were between 10,000 to approximately 90,000 in southern Florida but were approximately in the 100–1,000 range for the single northern population. These data are simi-lar to those estimated in the hierarchical AMOVA assuming mutation rates of 1E-9.
Genomic DNA and Read Depth
Poecilia latipinnagenomic DNAs (gDNA) were used to create bar-coded, reduced representa-tion, genomic libraries [23]. Each SNP is found on a single non-overlapping“tag”(64 bp sequence) where the sequence is initiated at the restriction site. An initial total of 740,993 SNPs were covered by 128 million 64 bp reads (tags). Of these, 18,255 SNPs had a minimum of five reads per SNP and 5% minimum allele frequencies across all samples. We removed 24 of 144 individuals with<10% calls and removed SNPs not called in 80% of individuals, resulting in
1,320 SNPs in 120 individuals (Table 1). Furthermore, we removed SNPs in which observed heterozygosity significantly exceeded expected heterozygosity (HWE, p<0.01) and SNPs with
significant linkage-disequilibrium (p<0.01, or with r2>0.2). This resulted in 955 SNPs with
6.48 millions reads. The average number of reads per SNP was 6,787 (range: 775 to 16,468). Excluding individuals with no reads (i.e., there were no sequences for a SNP), the average num-ber of reads per SNP per individual was 64 (range: 8–137). Individuals with no reads are excluded because they do not contribute to measures of allele frequencies, or population genetic measures.
SNP Loci
Table 2provides the average frequency of the major allele and average expected heterozygosity. The major SNP allele is defined by the allele with a frequency of>0.5 across all five
popula-tions. The average major allele frequency across all five populations for 955 SNPs was 81% with 95% within 8% of this value (Table 2A). Within each of the five populations, the average major allele frequency ranged from 70% for WR to 82% for BPC. Across all five populations, the average heterozygosity was 27.6% with 95% of loci within 8% of this value. Within each of the five populations, heterozygosity ranged from 14% to 24% (Table 2B).
there are no fixed differences and an average of 17% difference in allele frequencies. Within the Florida Keys there is an average of 10% difference in allele frequencies.
Genetic Diversity within Populations
Within all four southern Florida populations (Crandon and Keys) the pairwise differences (π) among individuals is substantial and similar toπamong all individuals (i.e., among all 120 individuals ignoring populations,Table 4). In the most northern freshwater population (WR), πis o.228 or>30% lower thanπwithin each population in the southern region (o.228 com-pared to an average of 0.355). This reduction inπfor the WR population is also reflected in the number of monomorphic sites: WR has approximately 4-fold more monomorphic sites than the southern populations. The frequency of homozygotes could arise from too few reads per SNP and thus could inflate the frequency of invariable or monomorphic SNPs in a population. To avoid this potential source of bias, the number of monomorphic sites was calculated only if there were ten or more individuals with ten or more reads per SNP per individual. Thus, the greater number of monomorphic sites in the northern FL population is not due to low sequence depth.
Table 2. A: Major Allele frequencies and B: Heterozygosity for 955 SNPs.
A:
Major Allele Frequencies Overall BPC BPN NNK Crandon WR
Avg 0.810 0.827 0.825 0.825 0.818 0.700
95%- 0.802 0.817 0.815 0.815 0.806 0.676
95%+ 0.818 0.837 0.835 0.835 0.829 0.724
MIN 0.500 0.227 0.220 0.260 0.000 0.000
Max 0.950 1.000 1.000 1.000 1.000 1.000
B:
Heterozygosity Overall BPC BPN NNK Crandon WR
Avg 0.276 0.238 0.240 0.238 0.233 0.142
95%- 0.268 0.227 0.229 0.227 0.222 0.131
95%+ 0.284 0.248 0.250 0.248 0.244 0.154
MIN 0.095 0.000 0.000 0.000 0.000 0.000
Max 0.500 0.500 0.500 0.500 0.500 0.500
Major alleles are alleles with>0.5 frequency across all populations
doi:10.1371/journal.pone.0137077.t002
Table 3. Differences in Allele Frequencies for Major Allele.
w/in FL Keys
w/in S. FL
South FLvs. North FL
Number of Fixed differences 0 0 30
Average difference in frequencies for the major allele across all 5 populations
0.099 0.169 0.335
+95% 0.095 0.161 0.353
-95% 0.104 0.176 0.317
Differences for“w/in FL Keys”are among the Key populations with the largestversussmallest allele frequency.
Differences for“w/in S.Fl”are among the Southern populations (Keys & Crandon) with the largestversus smallest major allele frequency.
Differences for“South FLvs. North FL”are average of major South–North allele frequencies
Genetic Diversity Among Populations
To examine the diversity among populations, we applied an analysis of molecular variance (AMOVA, [36]) among 3 groups: northern Florida (WR), Crandon Park and the Florida Keys. Using all 955 SNPs indicates there is significant difference among all three groups (p<0.0001).
Much (71%) of the variation is within populations, and 28% is among groups (Keys, northern or southern Florida). Considering only the four Southern populations (Crandon and the three Keys), 92% of the variation is within populations and 8% is among populations. Examining only the Florida Keys, 99% of the variation is within populations, with only 1% of the genetic variation among the three Florida Keys populations. These divergence patterns are reflected in the overall FSTvalue using all 955 SNPs (Table 5).
The overall FSTvalues show a divergence pattern where WR, the most northern population,
has the largest FSTvalues (~0.45) when contrasted with any of the southern populations.
Between southern Florida and the Florida Keys, the FSTvalue is approximately 0.08, and within
the Florida Keys the FSTvalues are near 0.01. There are three additional sets of results that use
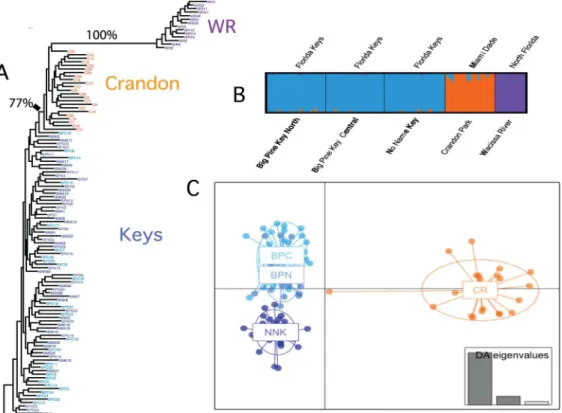
the variation in allele frequencies to define divergences among populations (Fig 2): maximum likelihood tree, Structure [37], and discriminant analysis of principal components (DAPC, [38]). The maximum likelihood tree (Fig 2A) uses all 955 SNPs and reveals divergence between the Florida Keys relative to both Crandon Park and WR populations (the only branches sup-ported by bootstraps values>50%). There is little that distinguishes the three Florida Keys
populations, yet Crandon Park and WR form two well-supported clades.
Structure analyses [37] suggest that there are three groups of individuals. Specifically, three groups maximize the marginal likelihood of the entire data set (Fig 2B). The three groups cor-respond to northern Florida, Crandon and the three Florida Keys populations. To further
Table 4. Pairwise Differences.
Avg. Min. Max. Mono
All 0.393 0.187 0.630 0
BPC 0.360 0.264 0.485 99
BPN 0.357 0.269 0.477 99
NNK 0.357 0.279 0.458 105
Crandon 0.348 0.277 0.407 130
WR 0.228 0.187 0.260 472
Mono: monomorphic, number of invariable SNPs with at least 10 individuals with a minimum of 10 reads per individual per SNP
doi:10.1371/journal.pone.0137077.t004
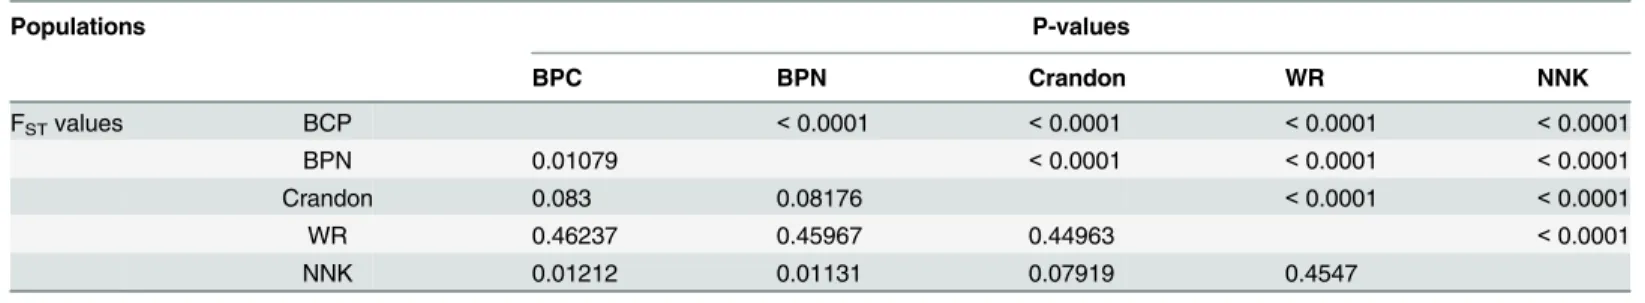
Table 5. Overall FST Values Between Population with P-values.
Populations P-values
BPC BPN Crandon WR NNK
FSTvalues BCP <0.0001 <0.0001 <0.0001 <0.0001
BPN 0.01079 <0.0001 <0.0001 <0.0001
Crandon 0.083 0.08176 <0.0001 <0.0001
WR 0.46237 0.45967 0.44963 <0.0001
NNK 0.01212 0.01131 0.07919 0.4547
P-values calculated after 10,100 replications
resolve differences among the four populations in the southern Florida population (Crandon and the three Florida Keys populations), a DAPC analysis [38] was applied to the four southern Florida populations (Fig 2C). DAPC is a multivariate approach that partitions the genetic vari-ation into a between-group and a within-group component using principal components of genetic variation to describe the genetic differences among groups while minimizing the differ-ences within groups. DAPC shows that the first discriminant function separates Crandon from the Keys and the 2ndfunction separates No Name Key from the two Big Pine Keys populations (Fig 2C). These results reflect the geographic separation of these four populations.
The divergence among populations seen in FSTvalues suggests variation in population
con-nectivity. To estimate this, we calculated migration rate using Slatkin’s distances [28] among these three regions: Northern Florida, Crandon Park and the Keys (Fig 3). The three Keys pop-ulations' migration rates are comparatively higher with approximately 44 migrants per genera-tion among all three populagenera-tions. Between the Keys and Crandon Park there are 6 migrants per generation, and<1 between Southern and Northern Florida (Fig 3).
Locus-Specific Differences
The overall FSTvalues among populations are significant even though the FSTvalues are small
among the four southern populations (Table 5). However, there are SNPs within the Florida Keys, among the southern Florida populations or among all five populations that have large, significant FSTvalues (FDist2, p<0.01;Table 6). The FSTvalue distribution and associated
Fig 2. Population divergence.Maximum likelihood tree, structure plot and DAPC plot.A:Maximum likelihood tree of all 120 individuals. The three Florida Key populations are in green, light blue and dark blue, Crandon Park is orange and north Florida (WR) is purple. The only two branches with bootstrap values>50% are labeled with frequency of support.B:Structure plot from the most likely K = 3.C:DAPC plot for the four south Florida populations: Big Pine N is blue Big Pine C is light blue, No Name Key is deep blue and Crandon Park is orange. Insert is the percent explained variance for the first three
discrimination eigenvalues.
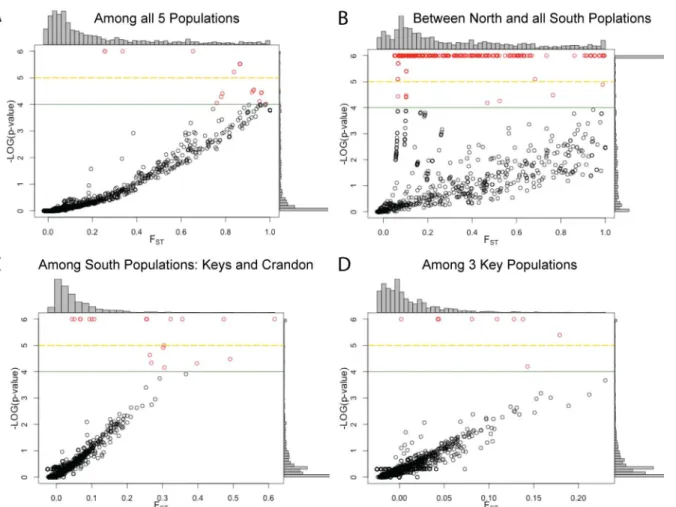
p-values (as negative log10,e.g., where 2 = 0.01, 6 = 1e-6) are shown inFig 4. With 955 SNPs, one would expect ~9 SNPs by chance to have p-values less than 1%. In all cases, the number of SNPs with significant FSTvalues exceeds this null expectation, dramatically so for the
distinc-tion between northern and southern Florida. Furthermore, Bonferroni’s corrected p-values (<10−5) suggest that despite the small geographic distances among the Florida Keys popula-tions, there are SNPs that have significant divergences. We can compare the number of FDist2 significant FSTvalues (Table 6,Fig 4) with the number found using AMOVA hierarchical
Fig 3. Migration Estimates.Diagram showing the estimated number of migrantspergeneration among all populations. Estimates were determined using a matrix of Slatkin’s linearized FST. Text with the lines
between populations shows the estimated migration rate as well as the geographic distance between populations.
doi:10.1371/journal.pone.0137077.g003
Table 6. SNP specific FSTvalues and FDist2 outliers.
# SNPs significant (corrected) Avg. significant FSTvalue Min. Max. Outliers
5 populations 119 (7) 0.778 0.256 1.000 62
Crandon vs. Keys 48 (14) 0.224 0.044 0.617 23
Keys 29 (9) 0.118 0.02 0.230 11
N vs S 481 (349) 0.338 0.050 1.000 411
Number of SNPs with significant FSTvalues p<0.01 (with Bonferroni’s correction, p-value<10−5). Average, minimum and maximum FSTvalues among
significant SNP. Outlier loci are based on permutation of data and occur less than 1% with FDR correction of 1% (approximate p-value = 0.003).
analyses [26]. The FSTvalues for both are nearly identical, but the p-values are different because
they are based on different permutations of the data. While the number of significant FST
val-ues is higher for the AMOVA (Table 7), nearly all the significant FSTvalues (Table 6) were
sig-nificant with the AMOVA hierarchical analysis: among all populations all 119 (100%) are also significant, and among the population in the southern regions (Crandon vs Keys), 44 out of 48 (92%) share significance. However, for FSTvalues between the northern and southern
regions, only 255 of 481 (53%) have shared significance.
Fig 4. FSTvalues and p-values for all SNPs.SNPs shown as a function of their FSTvalues and their corresponding FDR corrected P-value. Histograms
show the distribution FSTvalues (above) and p-values (right) of plot. FDist2 outlier SNPs are shown in Red above the green line. SNPs above the yellow
dashed line have p-values below the Bonferroni’s correction threshold (<10−5). Comparisons shownA:All 5 populations,B:North vs. South Florida (Crandon and the Keys as one population),C:South Florida (Crandonversusthe Keys),D:Keys (BPC, BPN, NNK). SNPs with a p-value<1E-6 were set to 1E-6.
doi:10.1371/journal.pone.0137077.g004
Table 7. SNPs FSTvalues in a Hierarchical Island Model test.
AMOVA Significant SNPs (corrected) Hierarchial Outliers Avg. Outlier FSTvalue Min. Outlier Max. Outlier
Among All Populations 514(326) 103 0.886 0.660 1.000
N v S 527(319) 72 0.971 0.916 1.000
Crandon vs. Keys 155(35) 17 0.504 0.393 0.773
Number of SNPs with significant FSTvalues p<0.01 (with Bonferroni’s correction, p-value<10−5). Average, minimum and maximum FSTvalues among
significant outleier SNP.
To determine whether any of these SNPs may have adaptive significance, an outlier analysis was used to identify SNPs with FSTvalues that lie outside the 99% distribution with 1% FDR
(Table 6, [39]). Results from the FDist2 outlier test found 62 outlier SNPs among all 5 popula-tions (Fig 4A), 23 within South Florida (Fig 4B), 11 among the Keys (Fig 4D), and 411 between northern and southern Florida (Fig 4C).
Among the 411 outlier SNPs, the average number of reads for each SNP among the 120 individuals is 6,705, (range: 1,167 to 12,534). Of these 481 outlier SNPs, 32 had significant nBLAST hits to all bony fish (E-value<10−15). The majority of these (18) were for transcrip-tional factors or signaling factors (receptors, G-proteins). Among the three Florida Keys popu-lations, which are less than 10 km apart with small overall pairwise genetic distances (FST
values<0.02), there are eleven outlier SNPs with an average FSTvalue of 0.104 (range: 0.020–
0.230). These 11 SNPs have an average of 4,783 reads (range: 3,3578 to 5,734) among the 71 individuals in the three Florida Keys populations. Only one of these SNPs had meaningful annotation: FAM69A, a cysteine-rich type II transmembrane protein localized to the endoplas-mic reticulum.
Outlier tests identify loci with potentially adaptive FSTvalues that are unlikely to occur
because their values exceed the value for all other SNPs with similar heterozygosity [40]. Yet, the false positive rate can exceed 5% depending on the demography of populations and the underlying models used in outlier analysis [40]. FDist2 (Lositan, [27]) uses an island model, and while this seems appropriate for the Keys, we wanted to verify these data using a hierarchi-cal model used in Arlequin [26].
Results from the hierarchical outlier test are shown inTable 7. This model depends on lim-ited migration and thus could not calculate values within the Keys; therefore the three Key locations were treated as one population. These data are similar to the FDist data: among all populations there are>100 SNPs that had outlier FSTvalues: 72 for the comparison between
NorthernversusSouthern regions and 17 in southern Florida (between Crandon and the Keys) comparison.
InFig 5depicts the Venn diagram for shared loci among AMOVA significant FSTvalues
and outlier tests for FDist2 and hierarchical models. For comparison among all populations, 54 out of the 62 (87%) FDist2 outliers are outliers with the hierarchical model. For the compar-ison within the Southern Region (Crandonversusthe Keys) 14 of the 23 (61%) FDist2 outlier
Fig 5. Venn diagrams showing 3-way comparisons of Loci with significant FSTvalues: FDist outlier test, Hierarchical outlier test, and significant
FSTvalues from the AMOVA: (A) Among all populations: (Keysvs. Crandonvs. North Florida); (B) Southern Florida (Crandonvs. Florida Keys) and
(C)Northvs. South Florida.
are outliers with the hierarchical model. Many fewer outliers were shared when comparing the Northern and Southern region (Fig 5): only 20 out of the 411 (5%) FDist2 outliers are outliers with the hierarchical model.
Discussion
Among coastal habitats, mangrove estuarine forests are changing: they are extending further north with saltwater intrusion associated with sea level rise [3,18,41,42]. How an increase in sea level affects the distribution and size of mangrove estuaries is dependent on human habita-tion: coastal habitats may be inundated with seawater which could support mangrove habitats, but the presence of human development will preclude mangroves from growing [3,42,43]. The movement and potential reduction of mangrove forests by GCC could affect ecological and population dynamics of animals inhabiting these estuaries. A critical factor in the survival of a specific species is the standing genetic variation that allows species to adapt to these changes [14]. To determine the extent of genetic variation and how it is partitioned among populations, we provide data on the genetic diversity in the teleost fish Sailfin molly (Poecilia latipinna) by comparing three geographically close Florida Keys populations to a mainland population in south Florida (Crandon Park) and a northern Florida, freshwater population. Previous studies have demonstrated thatP.latipinnapopulations have genetic divergence that increases with geographic distance [21], and this diversity is affected by periodic storms or hurricanes [20]. These studies have shown that there is substantial genetic diversity among regions (100s of kilometers apart,e.g., northern and southern Florida) with little substantial diversity among populations within a region (10s of kilometers apart, [21]. The genetic varia-tion among regions is responsible for significant differences in life history traits (body size, growth and maturity [44–46]). These studies suggest that the changes in allele frequencies across large geographic regions affect important biological traits. Thus, these allozyme and microsatellite data suggest that conservation practices need to consider the preservation of a few local populations among many distant regions. In this study, we examine 955 SNPs loci and demonstrate that even on the smallest geographic scale (<10 kilometers) there are
sub-stantial differences in allele frequencies, which may arise due to natural selection for locally adapted demes.
SNPs and Population Genetics
For population genetics it is common to examine polymorphic proteins, variable microsatellites or DNA sequences from one or a few genes. Proteins typically have two or few alleles that repre-sent an unknown number of nucleotide changes. Microsatellites have many alleles (approx. 20 in
P.latipinna, [20]) that differ in the number of repeats. Thus, GBS SNP data are most similar to DNA sequences because we are examining nucleotide changes with two alleles at a single position. However, GBS SNP data are different from DNA sequence variation analyses because only vari-able positions are captured from 64 bp Tags (short sequencing reads trimmed to 64 base pairs). Clearly, examining only polymorphic Tags inflates our measures of nucleotide variation. Yet this is not so different from choosing variable allozymes, which inflates estimates of the amount of protein polymorphism. What we can say is that for polymorphic Tags (Tags with SNPs) there is an averageπof 39.3%. To compare GBS SNPs to DNA sequence variation, we can correct for the selection of only polymorphic sites within Tags by dividing by 64 bp/SNP (see below).
Genetic Diversity within Populations
differences (π, number of nucleotide differences between pairs of individuals divided by the number of SNPs). The pair-wise differences within each southern Florida population is>34%
with a range of 34.8–36.0% (Table 4). These differences among individuals within a population are similar to the value across all individuals in all five populations. That is, the diversity within each of the southern FL populations is similar to the variation among all individuals when ignoring population structure. This similarity ofπwithin and among populations explains the AMOVA results within the Florida Keys where 99% of the variation is within populations. In the northern freshwater populationπis substantially less (22.8%).
The second measure of genetic diversity is He (expected heterozygosity), which is approxi-mately 0.23 in the southern populations. In the northern population heterozygosity is much smaller: it is 0.14 or 60% of that found in the southern populations. These data are based on an average of 6,787 reads per SNP (range: 775–16,468), with an average of 57 reads per SNP per individual (range: 6–137). Thus, it is unlikely that this variation is due to sequencing errors because all SNPs have sufficient replication. In comparison to other GBS studies,πvalues within these sailfin molly populations are similar to those measured in stickleback and natural populations ofSaccharomyces cerevisiae[47,48].
These measures of genetic diversity using GBS data are substantial and seem to be much larger than other measures of genetic variation. For example, allozymes in populations from the same region have heterozyosity values of 0.05 [21] with 13% of loci being polymorphic. Yet, the direct comparison between SNPs and allozymes is difficult. Allozyme diversity will underestimate the actual level of genetic variation. For one reason, it is biased because only charged amino acid polymorphisms are discerned in protein gel electrophoresis. For another, proteins represent 100s of amino acids and even detectable allozyme variation may be the aggregation of hundreds of single nucleotide differences [49]. We filtered the SNP data to dis-cover only polymorphic sequences in 64 bp sequences (see above). If one divides the SNP mea-sures of diversity (πand heterozygosity) by 64 (number of nucleotides per variable sequence), πis 0.5% and expected heterozygosity is only 0.004. If we assume only one amino acid substitu-tion among 100 possible amino acids in an allozyme, then 0.13% of amino acids are polymor-phic with heterozyosity of 10−4at each amino acid. Although these are crude estimates, they do suggest that GBS provides much more information about polymorphism per locus than allo-zymes. This is not surprising because neutral divergence is a function of functional constraints [50], and in protein coding genes (e.g., allozymes) there are fewer nucleotide substitutions that do not have a deleterious effect than in random genomic regions interrogated using GBS. Thus, one expects more variation in GBS studies than when using allozymes. The fact that GBS pro-vides orders of magnitude more loci suggests that these data can reveal more detailed informa-tion about the conservainforma-tion genetics of a species.
We can compare the pairwise individual differences estimated from SNPs,πper bp (0.5%, π/64 bp per sequence), to DNA sequence variation. SNP'sπper bp of 0.5% is larger than theπ for DNA sequences captured from teleost fish promoters ofLdh-Bamong populations from Georgia to Maine (0.018; Crawfordet al. 1999) and promoters for CYP1A among populations from New England (0.015; [51]). The values we report here are also larger than theπfor DNA sequences estimated in 5 global populations ofDrosophila melanogasterin theeveregulatory elements (0.015; [52] and betweenD.melanogasterandD.simulans, 0.03 [53]. When com-pared across a wide array of taxa,π= 0.5% is a substantial level of genetic variation relative to most animals [54]. These comparisons to DNA sequence data suggest that, like the comparison to protein polymorphisms, GBS provides a greater variety of genomic regions that have greater polymorphism because there are fewer constraints.
Overall, the data on SNP polymorphism suggest first, that within populations,P.latipinna
Additionally, GBS SNP data provide a greater variety of loci that have greater variation than the DNA sequence variation of single genes in many previous studies. Second, the data show that the genetic diversity is higher in the four southern populations than in the single northern population. Third, the data show that in the southern populations,πwithin populations is sim-ilar toπacross all individuals. The high frequency of polymorphisms within populations is similar to previous studies onP.latipinnausing allozymes and microsatellites that indicated a large proportion of all genetic variation is found within individual populations [20,21]. The important point is that while GBS studies examine 100s-1,000s more loci than allozymes or microsatellites, the conclusions about the distribution of variation within and among popula-tions is similar among all three genetic markers and thus is not an artifact of one particular marker.
Genetic Diversity among Populations
Among the five populations, the four southern Florida populations were sampled in saline or hyper-saline water with little obvious connection to daily tidal flows. These upper-tidal salt flats are inundated at extreme high tides or during storms. These southern Florida populations are geographically separated and environmentally different than the WR freshwater popula-tion, and this is clearly seen in the SNP data. WR is clearly distinct from the southern Florida populations: the WR populationversussouthern populations has the largest overall FSTvalue,
the most number of SNPs with significant FSTvalues, and is the only population with fixed
dif-ferences in allele frequencies. This divergence between these two distant regions is similar to previous allozyme and microsatellite data [20,21]. Specifically, based on allozymes, the FST
val-ues among regions including northern Florida and Georgia was 0.21 [21]. We provide a similar comparison by contrasting FSTvalues for northernversusall southern populations. Based on
481 SNPs with significant FSTvalues, the average FSTvalue was 0.34.
Without replicates of other freshwater samples or hyper-saline samples in northern Florida, it is difficult to discern what evolutionary factors are affecting the divergence between these two regions. However, the WR population in northern Florida has more monomorphic SNP and lowerπand He values than any southern population, suggesting that this population has been historically smaller and more isolated. Both would contribute to greater drift. Addition-ally, the number of SNPs with significant FSTvalues is large but highly dependent on the
method used to determine significance (Tables6and7). Specifically, only 53% of FSTvalues
share significance between the two approaches used here. This also extends to outlier analyses: most FDist2 outliers are not outliers with hierarchical analysis. These data suggest that demography (bottle neck, complex population structure, etc.) affects the analyses between the northern and southern regions. Thus, without a more explicit sampling design to ascertain geo-graphic and environmental effects, the simplest explanation is that the divergence among the northern and southern regions represents neutral divergence.
Among the four southern populations (Crandon and the three Florida Keys), there is little over all genetic divergence: across all 955 SNPs, the FSTvalues comparing Crandonversusthe
Florida Keys are approximately 0.09 and within the Florida Keys FSTvalues are 0.01 (Table 5).
Yet, similar to allozyme studies, the mainland population (Crandon) can be distinguished from the Florida Keys by phylogenetic, Structure and discrimination analyses (Fig 2). That is, while most SNPs have little divergence among southern populations, there is a sufficient number of divergent SNPs allowing one to distinguish among the Florida KeysversusCrandon (Fig 5). This is most readily seen in the number of SNPs with significant FSTvalues (44 shared in both
analyses or 14 with Bonferroni’s correction). These 44 SNPs have an average FSTvalue of 0.22.
The genetic divergence among the three Florida Keys populations is small with little support for isolation among them: overall FSTvalues are very small (0.01), and there is no support for
differentiation based on phylogenetic or Structure analyses. However the discrimination analy-sis does suggest that there is sufficient allelic variation to distinguish NNK from the two other Florida Key sites (BPC and BPN). This can be seen in the 29 SNPs (9 with Bonferonni’s correc-tion) that have significant FSTvalues (Fig 5). These FSTvalues cannot be confirmed with the
AMOVA model because migration is too high for these analyses. The average FSTvalue among
these 29 SNPs is 0.12. Given the low overall difference among the Florida Keys populations (FST= 0.01) and the fact that only 3% of SNPs have significant FSTvalues (29/955), it is
surpris-ing that 11 of the SNPs are significant outliers.
The important point about both the significant and outlier FSTvalues (Fig 5) is that they
suggest that populations within southern Florida have large and significant differences in allele frequencies that were unexpected based on previous analyses. The p-values associated with these FSTvalues (Fig 5), the large number of reads for each SNP and the consistency among
sta-tistical approaches indicate that these FSTvalues are biologically relevant and not technical or
statistical artifacts.
Outlier SNP
Outlier SNPs are SNPs whose FSTvalues exceed the values expected based on extensive
permu-tation of the data [27,39]. While several biological processes can create excessively large FST
values, the simplest explanation is often that these SNPs are evolving by natural selection [39,
40,55,56]. However, FDist2 analyses used in these analyses are associated with false positives [40,57,58]. This is because the FDist2 analyses assume an island model of migration that is not always likely to be correct. When this demographic model matches the actual patterns of migrant exchange, FDist2 analyses often perform well with few if any false positives [40]. While an island model may be suitable, we contrast FDist2 with a hierarchical model. While many of the outliers were corroborated with both approaches, especially within south Florida, these results differ in the comparison between the northern and southern Florida populations, most likely due to complex demography associated with the one isolated northern population.
For the FDist2 comparison among southern populations (Crandonvs. Florida Keys), an island model seems reasonable. For the Crandonversusthe Keys, there are 23 FDist2 outliers (average FSTvalue of 0.26, with the range of p-values from<10−6to 210−4;Fig 4). The average
difference in allele frequencies is 0.353 (compared to 0.156 for SNPs with non-significant FST
values). Most of these outliers (61%) were also found in the hierarchical analysis (Fig 5). These low FSTvalues, changes in allele frequencies and support from two outlier methods indicate a
much stronger divergence for outlier SNPs than other SNPs. Simulation studies suggest that when FDist2 examines populations where the island model is a good approximation, the false positive rate is nearly zero and the true positive rate is approximately 20%. Thus, the number of outliers for the comparison of southern populations is likely to be a good approximation. We therefore conclude that even though southern populations are well connected (FSTvalues
~0.09), natural selection has affected allele frequencies among these populations. The identifi-cation of potentially adaptive divergence among southern populations is where GBS SNP stud-ies differ from previous studstud-ies. These results are possible because GBS examines many more loci and thus is more likely to find a locus with significant changes and statistically, one can dis-tinguish loci with large significant FSTvalues from neutral background by permutation of the
data.
The outliers within the Florida Keys are more difficult to model. The exceedingly small FST
model) there are 11 outlier SNPs (average FSTvalue of 0.10, range 0.23 to 0.02, range of
p-val-ues from<10−6to 210−4). The average difference in allele frequencies for these 11 SNPs is 0.191 (compared to 0.0095 for SNPs with non-significant FSTvalues). These 11 SNPs have
approximately 100-fold larger FSTvalues and 20-fold greater changes in allele frequencies than
the other SNPs. We could not apply a hierarchical outlier test within the Keys because migra-tion rates were too high for these analyses. Thus, although the differences in allele frequency and extreme p-values (Fig 4) support the outlier test, caution would suggest that not all of these values are true positives. If one assumes these populations are panmictic, then the nine FST
val-ues that exceed Bonferroni’s correction may be indicative of adaptive divergence. What these data suggest is that even among populations that are separated by<10s of kilometers and with
little overall genetic divergence, there are some SNPs affected by natural selection.
We find outlier loci with extremely small p-values (Fig 4) that are corroborated using differ-ent approaches (Fig 5). The support for these are especially strong for the population in south-ern Florida (Crandon and the Keys). Yet, estimations of migration rates (Fig 3) are large (6 individuals per generation) to extremely large (>40 individuals per generation). If some or
many of the outlier SNPs are adaptive, this suggests that selection coefficients are large enough to overcome these migration rates.
Conservation Genomics
Conservation practices need to consider the genetic variation within and among populations [5,11–13]. Understanding variation within a population provides information on whether there is adequate genetic variation for selection to act on and thus whether a species may adapt to changing environments. Differences among populations provide information on whether there is genetic diversity among habitats. At a minimum, such diversity can indicate whether we need to maintain the connectivity among populations. Connectivity among populations functionally increases effective population size through migration and thus acts to maintain genetic diversity [59,60]. In the extreme, diversity among populations might also indicate adaptive divergence, in which case individuals from different populations are not fully exchangeable and local extinctions cannot be mitigated by immigration from other locations.
Understanding the genetic diversity within and among populations is more important with GCC because the stress of climate change can cause species extinction, reduce habitat quality, or alter species distributions [1,2,61,62]. With sufficient genetic variation it is possible that species can adapt to GCC, mitigating its effects [14]. With GCC and rising sea levels many coastal habitats will be affected. The questions we are asking are whether there is sufficient vari-ation among isolated estuarine fish within populvari-ations and whether there are significant diver-gences among populations.
These data indicate that within southern FloridaP.latipinnapopulations there is a high level of genetic variation within all surveyed populations. The southern populations have high migration rates (Fig 3) and no fixed differences, suggesting that conservation of several sites with many individuals would preserve genetic variation best. Second, although it is difficult to predict which loci are important for future adaptive divergence necessary to mitigate GCC effects, the data also show thatP.latipinnadisplays some adaptive divergence even among geographically close populations. This adaptive divergence found in our genomic data among geographically close populations supports conclusions drawn from previous analyses of life history traits [44,
Finally, we would like to remark on the similarity between our GBS SNP data and previous analyses of similarP.latipinnapopulations using allozymes or microsatellites [20,21]. Nearly all of our conclusions about the genetic variation within and among populations using GBS SNPs are similar to the conclusions from these older technologies. The two exceptions are the number of loci and the ability to use these high numbers of loci in permutation tests to find outlier SNPs (SNPs with excessive FSTvalues). The large number of loci with small FSTvalues
strongly influences the larger estimates of Nm (effective population size times migration). Additionally, since nearly all of these loci appear to be neutral, we can more accurately detect loci with exceptionally high FSTvalues. Thus, GBS SNP analyses appear to be similar to
previ-ously utilized techniques for determining population structure but provide a substantial improvement on those methods for detecting the potential signature of natural selection.
Acknowledgments
We thank the University of Miami and in particular Will Drennan and Gary Hitchcock in the Marine Science Program for supporting the undergraduate research which developed most of these data. We also thank David Dayan for help in collecting samples. Additional support for the adaptor primers was from NSF, MCB 1158241.
Author Contributions
Conceived and designed the experiments: MFO DLC. Performed the experiments: DLC MFO JCBN TPS MAF TLB TNF DH. Analyzed the data: DLC MFO JCBN TPS MAF TLB TNF. Contributed reagents/materials/analysis tools: MFO. Wrote the paper: DLC MFO JT JCBN TPS MAF TLB TNF.
References
1. Sinervo B, Mendez-de-la-Cruz F, Miles DB, Heulin B, Bastiaans E, Cruz MVS, et al. Erosion of Lizard Diversity by Climate Change and Altered Thermal Niches. Science. 2010; 328(5980):894–9. doi:10.
1126/Science.1184695PMID:WOS:000277618800050.
2. Williams SE, Shoo LP, Isaac JL, Hoffmann AA, Langham G. Towards an Integrated Framework for Assessing the Vulnerability of Species to Climate Change. Plos Biology. 2008; 6(12):2621–6. doi: ARTN e325 doi:10.1371/journal.pbio.0060325PMID:WOS:000261913700002.
3. Day JW, Christian RR, Boesch DM, Yáñez-Arancibia A, Morris J, Twilley RR, et al. Consequences of Climate Change on the Ecogeomorphology of Coastal Wetlands. Estuar Coast. 2008; 31(3):477–91.
doi:10.2307/40663447
4. Holling CS. Resilience and Stability of Ecological Systems. Annual Review of Ecology and Systemat-ics. 1973; 4:1–23.
5. Hughes AR, Stachowicz JJ. Genetic diversity enhances the resistance of a seagrass ecosystem to dis-turbance. P Natl Acad Sci USA. 2004; 101(24):8998–9002. doi:10.1073/Pnas.0402642101PMID: WOS:000222104900031.
6. Hector A, Schmid B, Beierkuhnlein C, Caldeira MC, Diemer M, Dimitrakopoulos PG, et al. Plant diver-sity and productivity experiments in European grasslands. Science. 1999; 286(5442):1123–7. doi:10.
1126/Science.286.5442.1123PMID:WOS:000083534200033.
7. Engelhardt KAM, Ritchie ME. Effects of macrophyte species richness on wetland ecosystem function-ing and services. Nature. 2001; 411(6838):687–9. doi:10.1038/35079573PMID:
WOS:000169112500043.
8. Tilman D, Wedin D, Knops J. Productivity and sustainability influenced by biodiversity in grassland eco-systems. Nature. 1996; 379(6567):718–20.
9. Loreau M, Naeem S, Inchausti P, Bengtsson J, Grime JP, Hector A, et al. Ecology—Biodiversity and ecosystem functioning: Current knowledge and future challenges. Science. 2001; 294(5543):804–8.
doi:10.1126/Science.1064088PMID:WOS:000171851800033.
11. Reusch TBH, Ehlers A, Hammerli A, Worm B. Ecosystem recovery after climatic extremes enhanced by genotypic diversity. P Natl Acad Sci USA. 2005; 102(8):2826–31. doi:10.1073/Pnas.0500008102 PMID:WOS:000227232400030.
12. Reusch TBH, Hughes AR. The emerging role of genetic diversity for ecosystem functioning: Estuarine macrophytes as models. Estuar Coast. 2006; 29(1):159–64. PMID:WOS:000237680200014. 13. Reed DH, Frankham R. Correlation between Fitness and Genetic Diversity. Conserv Biol. 2002; 17(1). 14. Hoffmann AA, Sgro CM. Climate change and evolutionary adaptation. Nature. 2011; 470(7335):479–
85. doi:10.1038/nature09670PMID:21350480
15. Parmesan C, Yohe G. A globally coherent fingerprint of climate change impacts across natural sys-tems. Nature. 2003; 421(6918):37–42. doi:10.1038/nature01286PMID:12511946.
16. Hofmann GE, Todgham AE. Living in the Now: Physiological Mechanisms to Tolerate a Rapidly Chang-ing Environment. Annual Review of Physiology. 2010; 72(1):127–45. doi:
10.1146/annurev-physiol-021909-135900PMID:20148670.
17. Sternberg LDSL, Ross M, O'Brian J. Sea-Level Rise and The Reduction of Pine Forest in the Florida Keys. Ecological Aplications. 1994; 4(1):144–56.
18. Cavanaugh KC, Kellner JR, Forde AJ, Gruner DS, Parker JD, Rodriguez W, et al. Poleward expansion of mangroves is a threshold response to decreased frequency of extreme cold events. Proceedings of the National Academy of Sciences. 2014; 111(2):723–7. doi:10.1073/pnas.1315800111
19. Twilley RR. The exchange of organic carbon in basin mangrove forests in a southwest Florida estuary. Estuarine, Coastal and Shelf Science. 1985; 20(5):543–57.http://dx.doi.org/10.1016/0272-7714(85) 90106-4.
20. Apodaca JJ, Trexler JC, Jue NK, Schrader M, Travis J. Large-Scale Natural Disturbance Alters Genetic Population Structure of the Sailfin Molly, Poecilia latipinna. Am Nat. 2013; 181(2):254–63. doi:10.1086/
668831PMID:WOS:000314091200012.
21. Trexler JC. Hierarchical Organization of Genetic-Variation in the Sailfin Molly, Poecilia-Latipinna (Pisces, Poeciliidae). Evolution. 1988; 42(5):1006–17. doi:10.2307/2408916PMID:WOS: A1988Q095900013.
22. Ivanova NV, Dewaard JR, Hebert PDN. An inexpensive, automation-friendly protocol for recovering high-quality DNA. Molecular Ecology Notes. 2006; 6(4):998–1002. doi:10.1111/j.1471-8286.2006. 01428.x
23. Elshire RJ, Glaubitz JC, Sun Q, Poland JA, Kawamoto K, Buckler ES, et al. A Robust, Simple Genotyp-ing-by-Sequencing (GBS) Approach for High Diversity Species. PLoS ONE. 2011; 6(5):e19379. doi:
10.1371/journal.pone.0019379PMID:21573248
24. Bradbury PJ, Zhang Z, Kroon DE, Casstevens TM, Ramdoss Y, Buckler ES. TASSEL: software for association mapping of complex traits in diverse samples. Bioinformatics. 2007; 23(19):2633–5. Epub 2007/06/26. doi:10.1093/bioinformatics/btm308PMID:17586829.
25. Paradis E, Claude J, Strimmer K. APE: Analyses of Phylogenetics and Evolution in R language. Bioin-formatics. 2004; 20(2):289–90. PMID:14734327.
26. Excoffier L, Laval G, Schneider S. Arlequin (version 3.0): An integrated software package for population genetics data analysis. Evolutionary Bioinformatics. 2005:47–50. PMID:WOS:000207065900004. 27. Antao T, Lopes A, Lopes RJ, Beja-Pereira A, Luikart G. LOSITAN: a workbench to detect molecular
adaptation based on a Fst-outlier method. BMC bioinformatics. 2008; 9(1):323. doi:
10.1186/1471-2105-9-323PMID:18662398; PubMed Central PMCID: PMC2515854.
28. Slatkin M. A measure of population subdivision based on microsatellite allele frequencies. Genetics. 1995; 139(1):457–62. PMID:7705646; PubMed Central PMCID: PMC1206343.
29. Cornuet JM, Pudlo P, Veyssier J, Dehne-Garcia A, Gautier M, Leblois R, et al. DIYABC v2.0: a software to make approximate Bayesian computation inferences about population history using single nucleo-tide polymorphism, DNA sequence and microsatellite data. Bioinformatics. 2014; 30(8):1187–9. doi:
10.1093/bioinformatics/btt763PMID:24389659.
30. Raj A, Stephens M, Pritchard JK. fastSTRUCTURE: Variational Inference of Population Structure in Large SNP Datasets. Genetics. 2014. doi:10.1534/genetics.114.164350
31. Stamatakis A. RAxML Version 8: A tool for Phylogenetic Analysis and Post-Analysis of Large Phyloge-nies. Bioinformatics. 2014. doi:10.1093/bioinformatics/btu033
32. Jombart T. adegenet: a R package for the multivariate analysis of genetic markers. Bioinformatics. 2008; 24(11):1403–5. doi:10.1093/bioinformatics/btn129PMID:18397895.
34. Antao T, Lopes A, Lopes RJ, Beja-Pereira A, Luikart G. LOSITAN: a workbench to detect molecular adaptation based on a Fst-outlier method. Bmc Bioinformatics. 2008; 9(33):323. doi:
10.1186/1471-2105-9-323PMID:18662398; PubMed Central PMCID: PMC2515854.
35. Slatkin M, Voelm L. FST in a hierarchical island model. Genetics. 1991; 127(3):627–9. PMID:2016058; PubMed Central PMCID: PMC1204389.
36. Excoffier L, Smouse PE, Quattro JM. Analysis of molecular variance inferred from metric distances among DNA haplotypes: application to human mitochondrial DNA. Genetics. 1992; 131:479–91. PMID: 1644282
37. Pritchard JK, Stephens M, Donnelly P. Inference of Population Structure Using Multilocus Genotype Data. Genetics. 2000; 155(2):945–59. PMID:10835412
38. Jombart T, Devillard S, Balloux F. Discriminant analysis of principal components: a new method for the analysis of genetically structured populations. BMC Genetics. 2010; 11(1):94. doi: 10.1186/1471-2156-11-94
39. Beaumont MA, Balding DJ. Identifying adaptive genetic divergence among populations from genome scans. Mol Ecol. 2004; 13(4):969–80. doi:10.1111/j.1365-294X.2004.02125.xPMID:15012769 40. Lotterhos KE, Whitlock MC. Evaluation of demographic history and neutral parameterization on the
per-formance of FST outlier tests. Mol Ecol. 2014; 23(9):2178–92. doi:10.1111/mec.12725PMID: 24655127
41. Kemp SJ. Autecological effects of habitat alteration: trophic changes in mangrove marsh fish as a con-sequence of marsh impoundment. Mar Ecol Prog Ser. 2008; 371:233–42. doi:10.3354/Meps07641 PMID:WOS:000261797800022.
42. Rey J, Carlson D, Brockmeyer R Jr. Coastal wetland management in Florida: environmental concerns and human health. Wetlands Ecol Manage. 2012; 20(3):197–211. doi:10.1007/s11273-011-9235-1 43. Feller IC, Lovelock CE, Berger U, McKee KL, Joye SB, Ball MC. Biocomplexity in Mangrove
Ecosys-tems. Annual Review of Marine Science. 2010; 2(1):395–417. doi:10.1146/annurev.marine.010908.
163809PMID:21141670.
44. Trexler JC, Travis J. Phenotypic Plasticity in the Sailfin Molly, Poecilia-Latipinna (Pisces, Poeciliidae) .1. Field Experiments. Evolution. 1990; 44(1):143–56. doi:10.2307/2409530PMID:WOS:
A1990CP95300011.
45. Trexler JC, Travis J, Trexler M. Phenotypic Plasticity in the Sailfin Molly, Poecilia-Latipinna (Pisces, Poeciliidae) .2. Laboratory Experiment. Evolution. 1990; 44(1):157–67. doi:10.2307/2409531PMID: WOS:A1990CP95300012.
46. Travis J. Evolution in the Sailfin Molly: The Interplay of Life-History Variation and Sexual Selection. In: Real LA, editor. Ecological Genetics. Princeton, NJ: Princeton University Press; 1994. p. 205–32. 47. Catchen J, Bassham S, Wilson T, Currey M, O'Brien C, Yeates Q, et al. The population structure and
recent colonization history of Oregon threespine stickleback determined using restriction-site associ-ated DNA-sequencing. Mol Ecol. 2013; 22(11):2864–83. doi:10.1111/mec.12330PMID:23718143 48. Hyma KE, Fay JC. Mixing of vineyard and oak-tree ecotypes of Saccharomyces cerevisiae in North American vineyards. Mol Ecol. 2013; 22(11):2917–30. doi:10.1111/mec.12155PMID:23286354 49. Kreitman M. Nucleotide polymorphism at the alcohol dehydrogenase locus of Drosophila
melanoga-ster. Nature. 1983; 304(5925):412–7. PMID:6410283.
50. Graur D, Li W-H. Fundamentals of Molecular Evolution, 2nd Edition. 2nd ed. Sunderland, MA: Sinauer; 2000. 481 p.
51. Williams LM, Oleksiak MF. Evolutionary and functional analyses of cytochrome P4501A promoter poly-morphisms in natural populations. Mol Ecol. 2011; 20(24):5236–47. doi:10.1111/j.1365-294X.2011.
05360.xPMID:22093087; PubMed Central PMCID: PMC3232336.
52. Ludwig MZ, Kreitman M. Evolutionary dynamics of the enhancer region of even-skipped inDrosophila. Molecular Biology & Evolution. 1995; 12(6):1002–11.
53. Kreitman ME, Aguadé M. Excess polymorphis at the Adh locus inDrosophila melanogaster. Genetics. 1986; 114(1):93–110. PMID:3021568
54. Leffler EM, Bullaughey K, Matute DR, Meyer WK, Ségurel L, Venkat A, et al. Revisiting an Old Riddle: What Determines Genetic Diversity Levels within Species? PLoS Biol. 2012; 10(9):e1001388. doi:10.
1371/journal.pbio.1001388PMID:22984349
55. Bierne N, Roze D, Welch JJ. Pervasive selection or is it. . .? why are FST outliers sometimes so
fre-quent? Mol Ecol. 2013; 22(8):2061–4. doi:10.1111/mec.12241PMID:23671920
57. Hermisson J. Who believes in whole-genome scans for selection[quest]. Heredity. 2009; 103(4):283–4.
doi:10.1038/hdy.2009.101PMID:19654610
58. Narum SR, Hess JE. Comparison of FST outlier tests for SNP loci under selection. Molecular Ecology Resources. 2011; 11:184–94. doi:10.1111/j.1755-0998.2011.02987.xPMID:21429174
59. Phillips PC. Maintenance of polygenic variation via a migration-selection balance under uniform selec-tion. Evoluselec-tion. 1996; 50(3):1334–9.
60. Slatkin M. Gene Flow and Population Structure. In: Real LA, editor. Ecological Genetics. Princeton, NJ: Princeton University Press; 1994. p. 3–17.
61. Harte J, Ostling A, Green JL, Kinzig A. Biodiversity conservation: climate change and extinction risk. Nature. 2004; 430(6995):3 p following 33; discussion following Epub 2004/07/09. doi:10.1038/
430003aPMID:15237466.
62. Thomas CD, Cameron A, Green RE, Bakkenes M, Beaumont LJ, Collingham YC, et al. Extinction risk from climate change. Nature. 2004; 427(6970):145–8.http://www.nature.com/nature/journal/v427/