Page 1 of 12
Estimation of the economic loss associated with the potential water
scarcity due to climate change over a river basin in northeast Brazil:
guiding policy-making process on a tangible scientific basis
Layla Lambiasi
1; Alexandre Gross
2; Mario Monzoni
3The project aimed to quantify the economic loss associated to variations in flow rates patterns, and therefore water availability, due to climate change over a river basin in northeast Brazil. The region has historical drought problems and high social vulnerability. The study simulated different future climate and economic scenarios in a specific water allocation decision support system. Economic loss calculation considers how a potential deficit can affect the production of goods for each user. The results show that significant value is at stake.
1. Introduction
Often decision-makers fail to assimilate properly technical information and therefore do not incorporate it in their planning processes. In fact, many types of produced data are still poorly interpreted. When the topic is climate change, the difficulty in understanding its complexity and at the same time finding the balance among science and policy implementation can be even more challenging.
One of the main resources affected by climate change is water. Impacts in natural cycles can mutate the way hydroclimate variables interact and thus change its availability conditions. Water is a key resource of most human activities and it has great potential on generating economic repercussion when absent. Besides that, usually economic damages go beyond financial harm, translating as well into social problems.
In this sense, this paper summarizes the process and findings from a applied study on the economic impacts of water shortages, enhanced by climate change, in a particularly vulnerable region of Northeast Brazil.
First, the study brought together water use and flow rates scenarios and run it in a water allocation software. The simulation distributes the available water according to the set of priorities for its use, considering how human supply and economic activities compete for this resource. The results, expressed as water deficits for each type of user, show the potential shortcomings of local water management.
1 Researcher at the Center for Sustainability Studies (GVces) of the Business Administration School of Fundação Getulio Vargas (FGV-EAESP). [email protected]
2 Researcher at the Center for Sustainability Studies (GVces) of the Business Administration School of Fundação Getulio Vargas (FGV-EAESP)
3 Coordinator of the Center for Sustainability Studies (GVces) of the Business Administration School of Fundação Getulio Vargas (FGV-EAESP)
Page 2 of 12
With the water deficits defined, the translation of the associated economic loss into monetary terms may come from different estimation methods, which can be used for multiple purposes. The process of choosing the most appropriate method is more of a craft than a science and, ultimately, depends on the analysis intended goals. In the end, it is possible to quantify in an approximated way the economic loss for each water user.
Starting in 2016, the study projected 50 years in the future, stablishing climate, and economic conditions for 2065. By translating water scarcity events into economic losses, it is possible to bring together climate change understanding and management in a hydrologic perspective, and thus offer objectivity to decision-makers (Rose, 2004). Through a more practical point of view, such a practice also contributes in laying solid ground for further planning pertinent applications, such as cost-benefit, cost-effectiveness, and multi-criteria analyses.
Region of interest: Piancó-Piranhas-Açu Basin
Northeast Brazil is one of the most vulnerable regions of the country in matters of water resources management. Because of its geological characteristics and semiarid climate, water has disproportional distributions over time. Most of the precipitation falls between February and May and while the soil retains almost nothing, most rivers cannot keep a constant flow during the period without rain.
Historically, around every 10 years a drought takes place, lasting between 2 to 3 years. Nowadays, the region is going through a drought, started in 2012, being one of the most severe ever seen. Changes in climate conditions can worsen early patterns and increase an already socially vulnerable area. As climate change begins to be addressed, the semiarid in Brazil is focus of different researches and planning actions.
Because of weather’s attributes, to support human and economic development in the region, it was necessary to install a system of integrated reservoirs. Although there are close to 2.300 reservoirs among the basin’s territory, 51 work as strategic storages, because of their sizes, supplying water for 145 cities.
The main economic activity in the region is agriculture, responsible for most of the basin’s water consumption. There are also significant cattle breeding for meat and milk production. Another important economic activity is aquiculture, represented especially by shrimp farming around the basin’s area close to the ocean. Industrial production has not much relevance in the region.
Scaling up scenario planning
Planning for climate change requires some predictive expertizes. Even though trying to anticipate the future is a common practice in some scientific fields, planning for future is inherently uncertain. Practical answers arising from the policy-making process should not underestimate the role uncertainty can play.
Apart from predictive science, in a changing climate, decision-makers should not try to foresee what is unknown, but to prepare for whatever the future might uncover in
Page 3 of 12
the years to come. In this sense, considering a range of possible future scenarios can contribute to identify solutions that perform well in various situations and thus improve human systems’ resilience (Quay, 2010).
Scenario planning stands for a new approach over the general habit of solely extrapolating from historical data, looking in it for what to expect and planning for what might happen. Climate change revolutionized basic hypothesis such as stationarity of natural phenomena, and therefore old premises do not apply in the same way as before.
With that in mind, the assessment conducted by the study tried to explore different alternatives of future climate and economic development, reaching a significant range of possible outcomes. The target is not getting an excessive number of scenarios, but to choose among a satisfactory setting, the ones that are most adequate with the project’s established purposes.
2. Methodology
Scenarios in the context of the study
I. Flow rates Scenarios
The method used to define flow rates alone stands for a possible tool to scale up scenario planning and handle with inherently uncertainties. A previous study compiled 21 IPCC’s GCMs4 results for precipitation and evaporation, and produced flow rates series through hydrological modelling. Starting from it, in a summarized way, the proposed technique consisted in statistically analyzing hydroclimatic characteristics among the GCMs, showing the major tendencies and replicating it over historical data of flow rates series.
Such climate assessment considered a range of modeled possible futures, triaging among them the ones taken as scenarios of interest, that is, reproducing observed trends and serving the project’s purposes. From the process, three flow rates scenarios emerged as possible and plausible future configurations. Besides those, a fourth scenario, being the replication in the future of patterns seen in the past, served as a reference scenario, they characterized as follows:
§ Moderate: soft variation of the historical flow rates patterns with the intensification of its main characteristics.
§ Extreme: aggravation of extreme weather events, the region is getting slightly drier, presenting meanwhile, picks of intense precipitation alternating with severe water scarcity events.
§ Arid: the region is becoming significant drier, there are much less water available among the reservoirs.
§ Historical: this scenario projects the last 50 years over the next 50 ones
Page 4 of 12
II. Water demands Scenarios
The focus of the study lies on consumers who depend on the existing water infrastructure, that is, on the water stored in the 51 strategic reservoirs of the basin. Thereat, although there are other activities that do not access these sources who can also suffer with less precipitation, the analysis does not include such activities. To modelling these other uses would involve a different approach that it not the aim of the project but should be the focus of further research.
Giving the profile of economic activities and human occupation patterns, there are 8 main types of water users in the basin, being, in order of use priority, according to the basin water resources plan (ANA, 2016), the followings: urban supply; rural supply; water diversion to neighboring basins; animal watering (cattle breeding); irrigated agriculture; industrial supply; and aquiculture. This last one is a non-consumptive use and therefore does not compete directly with the others.
To define water demand scenarios, per user in the basin, the methodological steps were as follows:
A. Current water demands
Recognized different data sources helped to compose the current water demands of each user. Table 1 shows total water demand by type of user and its relative share of the total water consumption in the basin, when considering only consumptive uses.
Table 1 – Distribution of water uses in the Piancó-Piranhas-Açu Basin.
Type of user Total water demand
(m3/s)
Percentage of the total (consumptive uses) Urban supply 2,89 12,5% Rural Supply 0,46 2% Water diversion 1,61 4,7% Animal watering 0,61 2,6% Irrigated agriculture 17,48 75,4% Industrial supply 0,65 2,8% Aquiculture 18,98 -
It is interesting to point out that water diversion is mainly to satisfy urban demands from neighboring cities external to the basin. For that reason, the study assumed its water demands as constant in time.
B. Socioeconomic dynamics and driving-parameters of future water demands Starting from the obtained values for current water demands, the way socioeconomic variables, such as population and production rates, change over time will define the future demands for water. In other words, if the number of people in a city rises, water needs for urban supply will also increase. Similarly, if agricultural production in a specific year of the month gets higher, the amount of water consumed would be bigger.
Page 5 of 12
Fluctuations in such variables express the local specific socioeconomic dynamics. As exemplified, these variables outline the behavior of each user over its water consumption, stablishing the driving-parameters for future water demands. With the set parameters, it is possible to define indicators of water consumption, such as per capita water daily needs and amount of water consumed per quantity produced in each activity.
The Table below summarizes the referred parameters and indicators for each water user.
Table 2 – Driving-parameters and water consumption indicators by type of user.
Type of user Driving-parameter Water’s consumption
indicator
Urban supply Urban population m³/hab./day
Rural Supply Rural population m³/hab./day
Animal watering Agricultural and livestock added value m³/prod./day
Irrigated agriculture
50% Agricultural and livestock added value and
50% of industrial added value
m³/prod./day
Industrial supply Industrial added value m³/prod./day
Aquiculture
50% Agricultural and livestock added value and
50% of industrial added value
m³/prod./day
C. Projections of economic development and population growth
In order to project the driving-parameters of socioeconomic conditions in the future, and at the same time promote scenario planning, the study considered three possible development pathways until the year of 2065.
For economic development, the scenarios were as follows:
§ Business-as-usual: reproduces the main behaviors seen in the past § Accelerated: considers a conjunction of favorable factors to the
economic development
§ Stagnant: in contrast to the previous one, establishes a less favorable conjunction.
For population growth, the study adopted one possible scenario, being this the mean trajectory between the UN’s low growth projections rates (World Population Prospects5) and Brazil’s local estimations from IBGE (2013). In this sense, urban and rural population vary the same among the three economic development pathways.
The resulting population trajectory characterizes for a progressive increase between the firsts three decades, reaching a peak in 2035 and after that
Page 6 of 12
starting to decrease. In the end of the considered period the number of habitants is close to the one seen nowadays.
The projections went through for each one of the scenarios described above using the statistical method mutatis-mutandi. This method stablishes that the rhythm of growth of the biggest aggregates, such as the country, will be influencing the mutable parts of the smallest aggregates, such as the basin and lastly its cities.
From current data of population and production added value of the presented activities, the method projected such parameters to the future. Table 3 presents the current and projected values of the main parameters.
Table 3 – Projections for the year of 2065 of the main parameters.
Parameter 2016
2065
Business-as-usual Accelerated Stagnant
Urban population 1,09 mi hab. 1,10 mi hab. 1,10 mi hab. 1,10 mi hab.
Rural population 0,51 mi hab. 0,51 mi hab. 0,51 mi hab. 0,51 mi hab.
Agricultural and
livestock added value R$ 0,049 bi R$ 0,62 bi R$ 0,84 bi R$ 0,58 bi
Industrial added value R$ 2,7 bi R$ 3,6 bi R$ 4,8 bi R$ 3,3 bi
Basin’s GDP R$ 11,74 bi R$ 17,68 bi R$ 25,67 bi R$ 16,58 bi
D. Obtaining future water demands
In the end, by projecting the driving-parameters in the future and multiplying it by the set indicators of water consumption, the resulting values are the future water demands. The outcomes express the water use scenarios for each activity in the basin in a monthly basis.
Water allocation software and the conducted simulations
To simulate water allocation between users, the software used was a Decision Support System LabSid AcquaNet 20136. This software provides an integrated model for complex hydrological systems analysis. Its routines reproduce continuous interactions between water availability (the flow rates scenarios), water user needs (the water demands scenarios) and the set local characteristics, such as supply priorities, storage necessities, and system losses.
The software allows the (virtual) construction of a hydrological network with the main elements of the local water infrastructure. Through determined functions it is possible to outline reservoirs, rivers connections, channels, passing nodes and to distribute water demand patterns. A control panel sets the rules for allocations decisions, determined given local behaviors. Figure 1 below illustrates the hydrological network built for the project.
6 Available on: http://www.labsid.eng.br/software.aspx?id=14. Developed by the Decision Support System Laboratory (LabSid) of the Polytechnic School of University of São Paulo.
Page 7 of 12
Figure 1 – Piancó-Piranhas-Açu hydrological network at the water allocation software.
I. Selecting a set of pertinent scenarios
As presented, the project considered 4 flow rates and 3 water demands scenarios. The combination between them, when run for the built hydrological network, results in 12 final water allocation scenarios. Its outcomes, expressed as water deficits by each reservoir, city, or water user, define a diverse spectrum of possible futures. In this sense, the project aimed to select a satisfactory ensemble among the resulted scenarios and compose an ultimate setting to proceed with the analysis of the economic losses. The differences between the Business-as-usual and the Stagnant economic scenarios were not significant. Thus, the final analysis did not consider the Stagnant one.
Moreover, the project stablished the Business-as-usual economic scenario as the baseline scenario, comparing among it, the 4 different climate results (Historical, Moderated, Extreme, and Arid). Additionally, to assess potential boundary conditions, also included the two climate limits of the Accelerated economic scenario, represented by the Historical and the Arid. In the end, economic loss evaluation consisted in the comparison of 6 different scenarios combining water use and flow rates configurations.
Types of economic losses and scope of estimation within the project
Water shortage can affect different spheres of social interactions. In the economic domain, its consequences can extend to other activities and thus maximize its impacts. To have a meaningful estimation process, it is necessary to define its boundaries. (Howe & Cochrane, 1993)
The main purpose of offering scientific basis for decision-makers it is to support further analysis of policy actions. Once the project focused on the main water
Page 8 of 12
infrastructure and the sectors depending on it, the estimated economic loss limits itself to these contour conditions.
Therefore, thinking on fostering evaluations such as cost-benefit, cost-effectiveness, and multicriteria analyses, among others, it is necessary to fix a solid comparative ground. To do so, the project stipulates what types of losses it aimed at quantifying, presented next:
I. First and second order losses
The order of the loss defines how the impacts of an event, for example a water shortage, affects the analyzed unit of interest (it can be a power plant, a sector, or a city, to name a few). First order losses are those reaching directly the considered unit. In the same way, second order losses are those going further than these limits, and characterizing as the consequences of the impacts over the prior order (Ding, Hayes and Widhalm, 2010).
II. Tangible and intangible losses
Economic losses can translate into different types of impacts. Tangible losses are those one can easily monetarized, usually related to the production of goods or services. On the other hand, intangible losses are subjective and its economic value is relativized. Examples of these types of losses are the effects of an event in population health, culture, and environmental systems (Ding, Hayes & Widhalm, 2010).
In this sense, the project focused on quantifying tangible first order losses for each water user in the basin.
Economic losses estimation methods in the present study
For the defined scope, the chosen method to estimate the economic losses was the production function, specially because of its bottom-up logic and results traceability. Besides this, other methods offered a comparative basis for further discussions. Both approaches were as follows:
I. Production function
The production function method explores the existing relation between a production input (production goods or natural resources) and its corresponding level of economic activity (Dosi, 2001)(Hanley & Barbier, 2009). In the case of water shortage events, the method stablishes that a given value of water deficit corresponds to the amount of the production input affected by the event.
This impact will disturb production activities and thus the final amount of goods and services produced. With less products commercialized, the value collected by the producer decreases.
Page 9 of 12
A. Understanding the physical relation between the input production, in this case water, and the production activity in each water user sector;
B. Quantification of total production expected in normal conditions;
C. Estimation of the share of the expected production affected by the water shortage event, expressed by the water deficits;
D. In the end, the economic loss is the difference of value between what should have been produced in normal conditions and what was produced under the adverse event, expressed in terms of the value payed to the producer. II. Other methods
Another method offered a simplified approach to calculate general second order losses and thus enriching the analysis. The replacement cost method, or substitution method, calculates how much it would cost to replace the production input or substitute the production output in the market (Dosi, 2001).
Estimating economic losses for each water user in the basin
To estimate the economic losses for water users through the production function it is necessary to understand the productive systems and specific aspects of each sector. The water deficits will affect the sector according to its dynamics of water use.
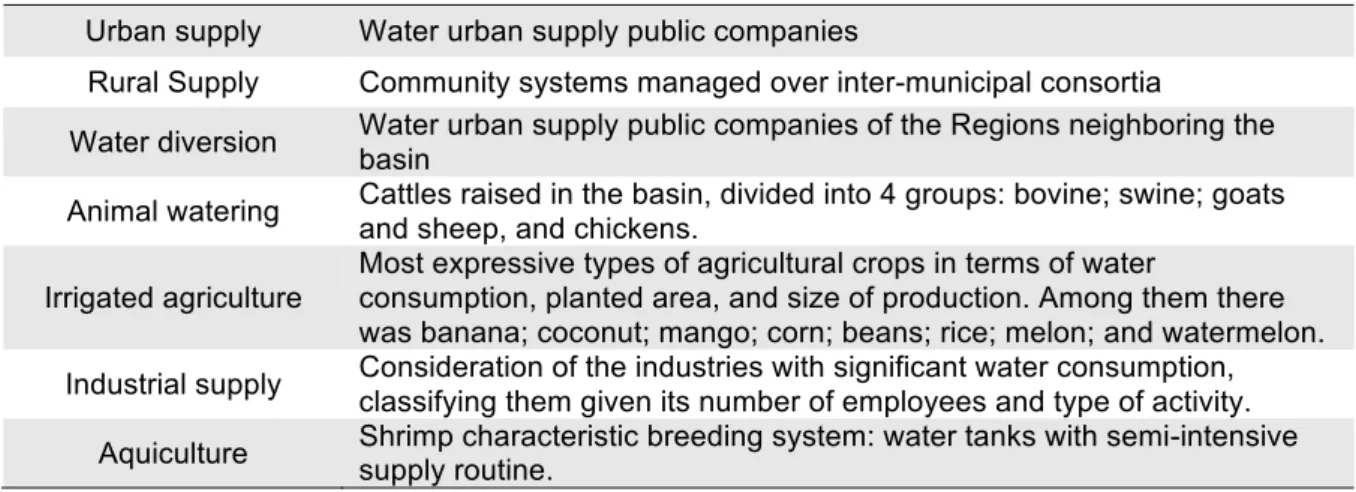
To apply the method, each water use in the basin need to be understood as a segmented unit. To follow the bottom-up approach water users’ activities and behaviors, considering the producer standpoint, had to be disaggregated into its main components. Table 4 summarizes the assumed boundaries of each water use sector.
Table 4 – Nature of the segment unit assumed for each water use sector.
Urban supply Water urban supply public companies
Rural Supply Community systems managed over inter-municipal consortia
Water diversion Water urban supply public companies of the Regions neighboring the
basin
Animal watering Cattles raised in the basin, divided into 4 groups: bovine; swine; goats
and sheep, and chickens. Irrigated agriculture
Most expressive types of agricultural crops in terms of water
consumption, planted area, and size of production. Among them there was banana; coconut; mango; corn; beans; rice; melon; and watermelon. Industrial supply Consideration of the industries with significant water consumption, classifying them given its number of employees and type of activity.
Aquiculture Shrimp characteristic breeding system: water tanks with semi-intensive
supply routine.
Discount rate
For the purposes of this project, we adopted a discount rate of 5,64% per year, equivalent to the interest rate on Brazil’s longer term treasury bonds (expire date 2055).
Page 10 of 12
Debating inherent uncertainties
The simulation of water allocation and its applicability over actual allocation decisions is questionable given the imperative premises around the hydrological network constitution. Despite this, it is a satisfactory simulation of the reality, offering valuable information for tactical decision and comparative analysis.
The project knowingly underestimates the economic impacts. Estimating potential effects of a climate-developing conjuncture implies setting a well-defined scope. Quantifying first order losses, and thus considering only the impacts over the direct water users, was a methodological choice. Naturally, water shortage affects indirect activities as well, and its impacts can be significant higher when considering second order losses.
3. Results
The results show that, when compared to the baseline scenario, the total deficit in the river basin can be up to 133% higher in the worst-case scenario, corresponding to a potential total economic loss estimated around US$ 1.16 trillion until 2065, in 2017-dollar value.
Figure 2 illustrates how economic loss varied among the flow rates scenarios. Figure 2 - Incremental economic loss per scenario in 50 years
Figure 3 brings the annual average of the economic loss per decade and for each scenario, showing how it relates to the GDP of the basin.
28% 7% 57% 97% 139% 0 5 10 15 20 25 30 35
HISTÓRICO MODERADO EXTREMOS ÁRIDO
To tal lo ss (bi llio ns R $) Trended Scenarios Economic loss duo only to socioeconomic accelerated development MAXIMUM POTENTIAL ECONOMIC LOSS
Page 11 of 12
Figure 3 – Evolution of annual average economic loss per decade and its relation with the basin GDP.
Figure 4 shows the differences between the economic loss results when calculated by the two discussed estimation methods. When considering second order losses, the financial damage can be up to three times higher.
Figure 4 – Comparison between the total loss calculated from the production function method and from the replacement/substitution method, per scenario in 50 years.
0 200 400 600 800 1.000 1.200 1º 2º 3º 4º 5º Ann ua l ave rag e lo ss (R $ mil lio ns) DECADES
Te -HHISTORICAL Te - EEXTREME Te - AARID
0,8% GDP 1,3% GDP 1,9% GDP 1,5% GDP 3,1% GDP 3,4% GDP 4,7% GDP 3,3% GDP 1,9% GDP 3,1x 3,6x 3,8x 0 20 40 60 80 100 120 140 160 Tot al lo ss (b ill ions R$) Production function economic loss Replacement/substitution cost economic loss
Page 12 of 12
4. Discussion
It is possible, from an economic standpoint, to measure the dimension of the potential losses associated with water shortages and better understand how they can affect societal dynamics. By translating something as abstract as climate change into physical risk and ultimately into a tangible economic damage, the decision-making process can be guided in a robust manner, offering palpable scientific substance to the policy sphere.
Moreover, the economic loss was estimated for six different future configurations of climate and economics dynamics, scaling up scenario planning and possibly promoting stronger policy actions and strategies. Besides that, the distance between scientific approach and management actions begins to shrink. Advances in economic losses estimation methods can solidify their understating and replicability, empowering decision makers and so promoting general welfare.
5. References
ANA. Plano de recursos hídricos da bacia hidrográfica do rio Piranhas-Açu. Agência Nacional das Águas - ANA. Brasília, p. 345. 2014.
Ding, Y., Hayes, M. J. & Widhalm, M., 2010. Measuring Economic Impacts of Drought: A Review and Discussion. Papers in Natural Resources, 1 1.
Dosi, C., 2001. Environmental values, valuation methods, and natural disaster
damage assessment, Santiago, Chile: s.n.
Hanley, N. & Barbier, E. B., 2009. Pricing Nature: Cost–Benefi t Analysis and
Environmental Policy. Cheltenham, UK; Northampton, MA, USA: Edward Elgar
Publishing Limited.
Howe, C. W. & Cochrane, H. C., 1993. Guidelines for the uniform definition, identification, and measurement of economic damages from natural hazard events: With comments on historical assets, human capital, and natural capital. FMHI
Publications, pp. 1-20.
IBGE. Projeção da População Brasileira. Instituto Brasileiro de Geografia e Estatística, 2013. Disponivel em: <www.ibge.gov.br/apps/populacao/projecao/>. Acesso em: Julho 2016.
QUAY, R. Anticipatory Governance: A Tool for Climate Change Adaptation. Journal
of the American Planning Association v. 76, 2010. 496-511.
Rose, A., 2004. Economic principles, issues, and research priorities in hazard loss estimation. Em: Modeling Spatial and Economic Impacts of Disasters. Berlin; Heidelberg; New York: Springer-Verlag, pp. 13-36.