Admission to Higher Education 2008
A descriptive analysis
Rectory of the University of Porto >> Continuous Improvement Service. 14-10-2008
T
ABLE OF
C
ONTENTS
Chap. I – 1
stround of the National Competition for University Admissions
... 6
I.1 – National overview: a comparison of the public universities
... 6
Table 1: List sorted by rate of places filled
... 6
Table 2: List sorted by weighted average classification of the last qualifying applicant placed
.... 6
Table 3: Rate of places filled: comparative analysis 2007 – 2008... 7
Table 4: Summary 1
stround – Places, applicants, successful applicants and surplus places
... 9
Table 5: Weight of public universities – Places and successful applicants
... 9
Chart 1: Rate of places filled of public universities... 10
Chart 2: Weighted average classification of the last qualifying applicant to public universities... 10
Chart 3: Rate of places filled in public universities: comparative analysis 2007 – 2008... 11
Chart 4: Weighted average classification of the last qualifying applicant to public universities:
comparative analysis 2007 – 2008... 11
I.2 – University of Porto
... 12
I.2.1 – Successful applicants
... 12
Table 6: U.Porto: comparative analysis 2007-2008 of places, successful applicants, rate of
places filled and classification of the last qualifying applicant, per course... 12
Chart 5: Rate of places filled per faculty: comparative analysis 2007-2008... 14
Chart 6: Weighted average classification of the last qualifying applicant, per faculty: comparative
analysis 2007-2008... 15
Table 7: Successful applicants per placement round
... 15
Table 8: Successful applicants per school district where exams took place
... 16
Chart 7: Total and cumulative percentage of successful applicants per school district where
exams took place
... 16
Table 9: Successful applicants per school where exams took place (top 50)... 17
Table 10: Successful applicants per gender and course... 18
Table 11: Successful applicants per gender and faculty... 20
Chart 8: Successful applicants per gender and faculty, in percentage
... 21
Table 12: Successful applicants per admission preference and course
... 21
Table 13: Successful applicants per admission preference and faculty
... 23
Chart 9: Successful applicants per admission preference and faculty, in percentage... 24
I.2.2 – Applicants
... 24
Table 14: Applicants per school district where exams took place... 24
Chart 10: Total and cumulative percentage of applicants per school district where exams took
place... 25
Table 15: Applicants per school where exams took place (top 50)... 25
Table 16: Applicants per gender and course... 26
Table 17: Applicants per gender and faculty... 28
Table 18: Applicants per application choice and course
... 29
Table 19: Applicants per application choice and faculty... 31
Chart 12: Applicants per application choice and faculty, in percentage... 32
Table 20: U.Porto: Rate of places filled and demand per course... 32
Chart 13: Rate of places filled and demand, per faculty... 34
Chart 14: Rate of places filled and course demand for the Faculty of Architecture
... 35
Chart 15: Rate of places filled and course demand for the Faculty of Fine Arts... 35
Chart 16: Rate of places filled and course demand for the Faculty of Sciences
... 36
Chart 17: Rate of places filled and course demand for the Faculty of Nutrition and Food Science
... 37
Chart 18: Rate of places filled and course demand for the Faculty of Sport
... 37
Chart 19: Rate of places filled and course demand for the Faculty of Law
... 38
Chart 20: Rate of places filled and course demand for the Faculty of Economics
... 38
Chart 21: Rate of places filled and course demand for the Faculty of Engineering
... 39
Chart 22: Rate of places filled and course demand for the Faculty of Pharmacy... 39
Chart 23: Rate of places filled and course demand for the Faculty of Arts
... 40
Chart 24: Rate of places filled and course demand for the Faculty of Medicine... 41
Chart 25: Rate of places filled and course demand for the Faculty of Dental Medicine
... 41
Chart 26: Rate of places filled and course demand for the Faculty of Psychology and Education
Science... 42
Chart 27: Rate of places filled and course demand for the Institute of Biomedical Sciences Abel
Salazar... 42
I.2.3 – The U.Porto as 1
stchoice
... 43
Table 21: Applicants in 1
stchoice per school district where exams took place... 43
Chart 28: Applicants in 1
stchoice per district in cumulative percentage
... 43
Table 22: Successful applicants in 1
stchoice per school district where exams took place... 44
Chart 29: Successful applicants in 1
stchoice per district in cumulative percentage
... 44
Table 23: Applicants in 1
stchoice per school where exams took place (top 50)
... 45
Table 24: Successful applicants in 1
stchoice per school where exams took place (top 50)... 46
Table 25: Applicants and successful applicants in 1
stchoice per gender and faculty... 48
Chart 30: Applicants in 1
stchoice per gender and faculty in percentage
... 48
Chart 31: Successful applicants in 1
stchoice per gender and faculty in percentage
... 49
Table 26: Applicants in 1
stchoice – successful and unsuccessful, per course
... 49
Table 27: Applicants in 1
stchoice – successful and unsuccessful, per faculty: comparative
analysis 2007-2008... 51
Chart 32: Successful applicants in 1
stchoice per faculty: comparative analysis 2007-2008
... 52
Chart 33: Applicants in 1
stchoice but unsuccessful due to places available, per faculty:
comparative analysis 2007-2008... 52
Chart 34: Course in the Faculty of Architecture as 1
stchoice
... 53
Chart 35: Courses in the Faculty of Fine Arts as 1
stchoice... 53
Chart 36: Courses in the Faculty of Sciences as 1
stchoice... 54
Chart 38: Course in the Faculty of Sport as 1
stchoice
... 55
Chart 39: Courses in the Faculty of Law as 1
stchoice... 56
Chart 40: Courses in the Faculty of Economics as 1
stchoice... 56
Chart 41: Courses in the Faculty of Engineering as 1
stchoice... 57
Chart 42: Course in the Faculty of Pharmacy as 1
stchoice... 57
Chart 43: Courses in the Faculty of Arts as 1
stchoice... 58
Chart 44: Course in the Faculty of Medicine as 1
stchoice... 59
Chart 45: Course in the Faculty of Dental Medicine as 1
stchoice
... 59
Chart 46: Courses in the Faculty of Psychology and Education Science as 1
stchoice
... 60
Chart 47: Courses in the Institute of Biomedical Sciences Abel Salazar as 1
stchoice... 60
Chap. II – 1
stand 2
ndrounds of the National Competition for University Admission: summary
... 61
II.1. National overview
... 61
Table 28: List sorted by rate of places filled: comparative analysis 2007-2008... 61
Chart 48: Rate of places filled: comparative analysis 2007-2008
... 61
II.2. University of Porto
... 62
Table 29: Rate of places filled and classification of last qualifying applicant per course (1
stand
2
ndrounds)
... 62
Chart 49: Rate of places filled per faculty: comparative analysis 2007-2008... 64
Table 30: Proportion of successful applicants in the 1
stround but who did not complete the
enrolment or were placed again in the 2
ndround, per course... 65
Table 31: Successful applicants in the 2
ndround per admission preference and course... 67
Sources and acronyms
... 69
Translation Note: For the purpose of this document, the following terms shall mean:
Licenciatura - Undergraduate degree Externato - Day-school
Escola secundária – Secondary school (public) Colégio - Private school
Colégio Internato - Private boarding-school
Introduction
The source of the data used is the Ministry of Science, Technology and Higher Education,
Directorate-General for Higher Education.
Chapter I refers only to the 1
stround of the National Competition for University Admissions.
First, we present the data on the public higher education university institutions, aiming at rating the
University of Porto in the national context. Our analysis – with the numbers shown first in a table and
then in a chart – focuses on:
- the rate of places filled;
- the weighted average classification of the last qualifying applicant;
- a comparative analysis with the National Competition for University Admissions – 1
stround
2007.
Then, we describe the situation of the 53 licenciaturas, licenciatura/1
stcycle and integrated
masters courses of the University of Porto, grouped by faculty, and which focuses on:
i.
Successful applicants/Admissions:
- the rate of places filled (compared to the 2007 competition);
- the weighted average classification of the last qualifying applicant placed (compared to the
2007 competition);
- the round of admission;
- the school district where exams took place;
- the school where the exams took place;
- gender;
- valid preferences of placement;
ii.
- Applicants:
- the school district where exams took place;
- the school where the exams took place;
- gender;
- the choice of application;
- the proportion of applicants, regardless of choice (provided it is valid) for application, and the
places available;
- the proportion of applicants who chose the course as 1
stchoice (a valid choice) and the
places available;
iii.
– Demand in 1
stchoice:
- applicants and successful applicants in 1
stchoice, per school district where exams took
place;
- applicants and successful applicants in 1
stchoice, per school where exams took place;
- applicants and successful applicants in 1
stchoice, per gender;
- percentage of successful applicants in 1
stchoice;
- proportion of applicants who chose the course as 1
stchoice but who were unsuccessful, and
the places available.
Chapter II presents a summary of the data on the two rounds of the National Competition for
University Admissions 2008, and focuses on:
- the rate of places filled (compared to the 2007 competition);
- the classification of the last qualifying applicant placed (1
stand 2
ndrounds);
- the proportion of successful applicants in the 1
stround but who did not complete the
enrolment or were successful in the 2
ndround;
Chap. I – 1
stround of the National Competition for University Admissions
I.1 – National overview: a comparison of the public universities
Table 1: List sorted by rate of places filled
Places (1) Successful Applicants (2) Places filled (2)/(1) Average classification* University of Porto 4025 4010 99.6% 154.2
Technical University of Lisbon 3160 3135 99.2% 146.5
University of Aveiro 1446 1428 98.8% 139.2
University of Minho 2312 2246 97.1% 143.4
New University of Lisbon 2575 2499 97.0% 147.6
University of Trás-os-Montes and Alto Douro 1265 1215 96.0% 130.8
Higher Institute of Business and Labour Sciences 970 928 95.7% 144.5
University of Madeira 550 523 95.1% 133.5
University of Coimbra 3102 2937 94.7% 144.8
University of Beira Interior 1270 1168 92.0% 135.2
University of Azores 558 500 89.6% 130.1
University of Évora 965 857 88.8% 125.1
University of Lisbon 3675 3149 85.7% 139.8
University of Algarve 760 644 84.7% 123.8
Total – Public Higher Education - University 26633 25239 94.8% 142.9
Source: MCTES – DGES A08_1F
Table 2: List sorted by weighted average classification of the last qualifying applicant placed
Places (1) Successful Applicants (2) Places filled (2)/(1) Average classification * University of Porto 4025 4010 99.6% 154.2
New University of Lisbon 2575 2499 97.0% 147.6
Technical University of Lisbon 3160 3135 99.2% 146.5
University of Coimbra 3102 2937 94.7% 144.8
Higher Institute of Business and Labour Sciences 970 928 95.7% 144.5
University of Minho 2312 2246 97.1% 143.4
University of Lisbon 3675 3149 85.7% 139.8
University of Aveiro 1446 1428 98.8% 139.2
University of Beira Interior 1270 1168 92.0% 135.2
University of Madeira 550 523 95.1% 133.5
University of Trás-os-Montes and Alto Douro 1265 1215 96.0% 130.8
University of Azores 558 500 89.6% 130.1
University of Évora 965 857 88.8% 125.1
University of Algarve 760 644 84.7% 123.8
Total – Public Higher Education - University 26633 25239 94.8% 142.9
Source: MCTES – DGES A08_1F
* Average classification that would be obtained if all the applicants admitted in each course had a classification equal to the classification of the last qualifying applicant in the general group. Weighting factor: no. of successful applicants in each course.
Table 3: Rate of places filled: comparative analysis 2007 – 2008
2008 2007 Places Successful applicants % Places Successful applicants %Higher Institute of Business and Labour Sciences 970 928 95.7% 936 905 96.7% University of Beira Interior 1270 1168 92.0% 1250 1030 82.4%
University of Madeira 550 523 95.1% 520 490 94.2%
University of Aveiro 1446 1428 98.8% 1438 1362 94.7%
University of Coimbra 3102 2937 94.7% 3076 2913 94.7%
Faculty of Sport Sciences and Physical Education 80 80 100.0% 80 80 100.0%
Faculty of Sciences and Technology 1058 1001 94.6% 1054 953 90.4%
Faculty of Law 375 375 100.0% 375 375 100.0%
Faculty of Economics 320 320 100.0% 320 320 100.0%
Faculty of Pharmacy 200 200 100.0% 190 191 100.5%
Faculty of Humanities 504 395 78.4% 504 441 87.5%
Faculty of Medicine 295 295 100.0% 279 279 100.0%
Faculty of Psychology and Education Science 270 271 100.4% 274 274 100.0%
University of Évora 965 857 88.8% 966 851 88.1%
University of Lisbon 3675 3149 85.7% 3626 3058 84.3%
Faculty of Fine Arts 250 250 100.0% 220 220 100.0%
Faculty of Sciences 930 814 87.5% 910 751 82.5%
Faculty of Law 510 510 100.0% 500 500 100.0%
Faculty of Pharmacy 210 210 100.0% 209 209 100.0%
Faculty of Humanities 1025 628 61.3% 1031 659 63.9%
Faculty of Medicine 375 375 100.0% 375 338 90.1%
Faculty of Dental Medicine 140 140 100.0% 136 136 100.0%
Faculty of Psychology and Education Sciences 235 222 94.5% 245 245 100.0%
University of Trás-os-Montes and Alto Douro 1265 1215 96.0% 1265 1112 87.9%
University of Algarve 760 644 84.7% 780 586 75.1%
Faculty of Marine and Environmental Sciences 105 88 83.8% 110 83 75.5%
Faculty of Sciences and Technology 155 151 97.4% 185 148 80.0%
Faculty of Human and Social Sciences 200 137 68.5% 215 150 69.8%
Faculty of Economics 170 160 94.1% 170 135 79.4%
Faculty of Natural Resources Engineering 100 81 81.0% 70 40 57.1%
2008 2007 Places Successful applicants % Places Successful applicants % University of Porto 4025 4010 99.6% 3968 3947 99.5% Faculty of Architecture 120 120 100.0% 108 108 100.0%
Faculty of Fine Arts 140 140 100.0% 140 140 100.0%
Faculty of Sciences 665 657 98.8% 655 655 100.0%
Faculty of Nutrition and Food Science 65 65 100.0% 65 66 101.5%
Faculty of Sport 110 110 100.0% 110 110 100.0% Faculty of Law 175 175 100.0% 170 170 100.0% Faculty of Economics 330 330 100.0% 330 330 100.0% Faculty of Engineering 830 830 100.0% 810 811 100.1% Faculty of Pharmacy 185 185 100.0% 185 185 100.0% Faculty of Arts 650 642 98.8% 650 625 96.2% Faculty of Medicine 245 245 100.0% 240 241 100.4%
Faculty of Dental Medicine 90 90 100.0% 90 90 100.0%
Faculty of Psychology and Education Science 170 170 100.0% 170 170 100.0%
Institute of Biomedical Sciences Abel Salazar 250 251 100.4% 245 246 100.4%
University of Azores 558 500 89.6% 540 395 73.1%
New University of Lisbon 2575 2499 97.0% 2485 2423 97.5%
Faculty of Sciences and Technology 1070 1057 98.8% 1070 1020 95.3%
Faculty of Medical Sciences 230 230 100.0% 210 217 103.3%
Faculty of Human and Social Sciences 725 660 91.0% 705 686 97.3%
Faculty of Law 100 100 100.0% 100 100 100.0%
Faculty of Economics 390 392 100.5% 360 360 100.0%
Higher Institute of Statistics and Information Management 60 60 100.0% 40 40 100.0%
Technical University of Lisbon 3160 3135 99.2% 3133 2937 93.7%
Faculty of Architecture 285 285 100.0% 268 251 93.7%
Faculty of Veterinary Medicine 95 95 100.0% 95 95 100.0%
Faculty of Motor Skill Development 224 225 100.4% 224 223 99.6%
Higher Institute of Agronomy 240 240 100.0% 240 240 100.0%
Higher Institute of Social and Political Sciences 432 432 100.0% 441 413 93.7%
Higher Institute of Economics and Management 445 445 100.0% 445 445 100.0%
Technical Higher Institute 1439 1413 98.2% 1420 1270 89.4%
Public Higher Education – University 26633 25239 94.8% 26300 24046 91.4%
Table 4: Summary 1
stround – Places, applicants, successful applicants and surplus places
Public Higher Education Public Higher Education- University U.Porto (1) (2) (3) (3)/1) (3)/(2) Places 50219 26633 4025 8.0% 15.1% Applicants 53062 n/a 13990 26.4% --Applicants in 1st choice 53062 n/a 7045 13.3% --
Successful applicants 44336 25239 4010 9.0% 15.9%
Successful applicants in 1st
choice 23366 n/a 2486 10.6% --
Surplus places 5917 1414 17 0.3% 1.2%
n/a = not available
Sources: MCTES – DGES A08_1F and MCTES – DGES BD_U.Porto_08_1F
Table 5: Weight of public universities – Places and successful applicants
Places (1) Successful applicants (2) (1)/Total (3) (2)/Total (4)
University of Porto 4025 4010 15.1% 15.9%
University of Lisbon 3675 3149 13.8% 12.5%
Technical University of Lisbon 3160 3135 11.9% 12.4%
University of Coimbra 3102 2937 11.6% 11.6%
New University of Lisbon 2575 2499 9.7% 9.9%
University of Minho 2312 2246 8.7% 8.9%
University of Aveiro 1446 1428 5.4% 5.7%
University of Beira Interior 1270 1168 4.8% 4.6%
University of Trás-os-Montes and Alto Douro 1265 1215 4.7% 4.8%
Higher Institute of Business and Labour Sciences 970 928 3.6% 3.7%
University of Évora 965 857 3.6% 3.4%
University of Algarve 760 644 2.9% 2.6%
University of Madeira 550 523 2.1% 2.1%
University of Azores 558 500 2.1% 2.0%
Total – Public Higher Education - University 26633 25239 100.0% 100.0%
(3) (4)
Chart 1: Rate of places filled of public universities
99,6% 99,2% 98,8% 97,1% 97,0% 96,0% 95,7% 95,1% 94,7% 92,0% 89,6% 88,8% 85,7% 84,7% 94,8% 0% 10% 20% 30% 40% 50% 60% 70% 80% 90% 100% University of PortoTechnical University of Lisbon University of Aveiro University of Minho New University of Lisbon University of Trás-os-Montes and Alto Douro Higher Institute of Business and Labour Sciences University of Madeira University of Coimbra University of Beira Interior University of Azores University of Évora University of Lisbon University of Algarve Total
Chart 2: Weighted average classification of the last qualifying applicant to public universities
154,2 147,6 146,5 144,8 144,5 143,4 139,8 139,2 135,2 133,5 130,8 130,1 125,1 123,8 142,9 0,0 20,0 40,0 60,0 80,0 100,0 120,0 140,0 160,0 University of Porto
New University of Lisbon Technical University of Lisbon University of Coimbra Higher Institute of Business and Labour Sciences University of Minho University of Lisbon University of Aveiro University of Beira Interior University of Madeira University of Trás-os-Montes and Alto Douro University of Azores University of Évora University of Algarve Total
Chart 3: Rate of places filled in public universities: comparative analysis 2007 – 2008
99,6% 99,2% 98,8% 97,1% 97,0% 96,0% 95,7% 95,1% 94,7% 92,0% 89,6% 88,8% 85,7% 84,7% 94,8% 99,5% 93,7% 94,7% 87,9% 97,5% 87,9% 96,7% 94,2% 94,7% 82,4% 73,1% 88,1% 84,3% 75,1% 91,4% 0% 10% 20% 30% 40% 50% 60% 70% 80% 90% 100% University of PortoTechnical University of Lisbon University of Aveiro University of Minho New University of Lisbon University of Trás-os-Montes and Alto Douro Higher Institute of Business and Labour Sciences University of Madeira University of Coimbra University of Beira Interior University of Azores University of Évora University of Lisbon University of Algarve Total 2007 2008
Chart 4: Weighted average classification of the last qualifying applicant to public universities:
comparative analysis 2007 – 2008
154,2 147,6 146,5 144,8 144,5 143,4 139,8 139,2 135,2 133,5 130,8 130,1 125,1 123,8 142,9 149,5 141 137,7 135,1 135,2 138,2 135,2 133,1 135,2 130,1 128,8 123,7 128,5 122,9 137,4 0,0 20,0 40,0 60,0 80,0 100,0 120,0 140,0 160,0 University of PortoNew University of Lisbon Technical University of Lisbon University of Coimbra Higher Institute of Business and Labour Sciences University of Minho University of Lisbon University of Aveiro University of Beira Interior University of Madeira University of Trás-os-Montes and Alto Douro University of Azores University of Évora University of Algarve Total 2007 2008
I.2 – University of Porto
I.2.1 – Successful applicants
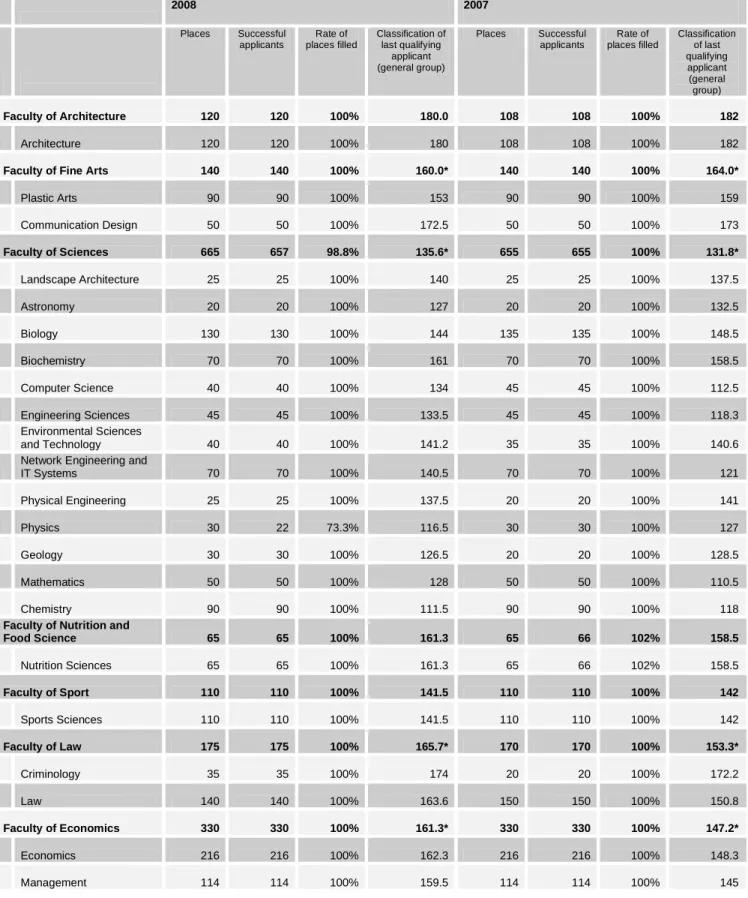
Table 6: U.Porto: comparative analysis 2007-2008 of places, successful applicants, rate of places
filled and classification of the last qualifying applicant, per course
2008 2007 Places Successful applicants Rate of places filled Classification of last qualifying applicant (general group) Places Successful applicants Rate of places filled Classification of last qualifying applicant (general group) Faculty of Architecture 120 120 100% 180.0 108 108 100% 182 Architecture 120 120 100% 180 108 108 100% 182
Faculty of Fine Arts 140 140 100% 160.0* 140 140 100% 164.0*
Plastic Arts 90 90 100% 153 90 90 100% 159 Communication Design 50 50 100% 172.5 50 50 100% 173 Faculty of Sciences 665 657 98.8% 135.6* 655 655 100% 131.8* Landscape Architecture 25 25 100% 140 25 25 100% 137.5 Astronomy 20 20 100% 127 20 20 100% 132.5 Biology 130 130 100% 144 135 135 100% 148.5 Biochemistry 70 70 100% 161 70 70 100% 158.5 Computer Science 40 40 100% 134 45 45 100% 112.5 Engineering Sciences 45 45 100% 133.5 45 45 100% 118.3 Environmental Sciences and Technology 40 40 100% 141.2 35 35 100% 140.6
Network Engineering and
IT Systems 70 70 100% 140.5 70 70 100% 121 Physical Engineering 25 25 100% 137.5 20 20 100% 141 Physics 30 22 73.3% 116.5 30 30 100% 127 Geology 30 30 100% 126.5 20 20 100% 128.5 Mathematics 50 50 100% 128 50 50 100% 110.5 Chemistry 90 90 100% 111.5 90 90 100% 118
Faculty of Nutrition and
Food Science 65 65 100% 161.3 65 66 102% 158.5 Nutrition Sciences 65 65 100% 161.3 65 66 102% 158.5 Faculty of Sport 110 110 100% 141.5 110 110 100% 142 Sports Sciences 110 110 100% 141.5 110 110 100% 142 Faculty of Law 175 175 100% 165.7* 170 170 100% 153.3* Criminology 35 35 100% 174 20 20 100% 172.2 Law 140 140 100% 163.6 150 150 100% 150.8 Faculty of Economics 330 330 100% 161.3* 330 330 100% 147.2* Economics 216 216 100% 162.3 216 216 100% 148.3 Management 114 114 100% 159.5 114 114 100% 145
2008 2007 Places Successful applicants Rate of places filled Classification of last qualifying applicant (general group) Places Successful applicants Rate of places filled Classification of last qualifying applicant (general group) Faculty of Engineering 830 830 100% 156.5* 810 811 100% 146.5* Bioengineering 60 60 100% 180.5 40 40 100% 178.8 Engineering Sciences – Mining and
Geo-Environmental Engineering 10 10 100% 142 10 10 100% 132
Civil Engineering 175 175 100% 149.5 175 176 101% 139.5
Environmental Engineering 40 40 100% 154.8 40 40 100% 142.5
Electrical and Computers
Engineering 195 195 100% 151.8 195 195 100% 143.8
Industrial Engineering and
Management 50 50 100% 176.3 50 50 100% 168
Informatics and Computing
Engineering 102 102 100% 161.8 102 102 100% 154.3
Mechanical Engineering 112 112 100% 162.8 112 112 100% 150.8
Metallurgical and Materials
Engineering 21 21 100% 149 21 21 100% 135.3 Chemical Engineering 65 65 100% 138.3 65 65 100% 126 Faculty of Pharmacy 185 185 100% 166.3 185 185 100% 163 Pharmaceutical Sciences 185 185 100% 166.3 185 185 100% 163 Faculty of Arts 650 642 98.8% 134.6* 650 625 96% 130.8* Archaeology 35 35 100% 125.6 40 39 98% 109.8 Information Science 40 40 100% 142 40 40 100% 137.8 Communication Sciences: Journalism, Public
Relations and Multimedia 75 75 100% 160 75 75 100% 161.6
Language Sciences 20 20 100% 133.2 20 20 100% 125.4 Portuguese and Lusophone Studies 20 20 100% 119.2 20 20 100% 125.4 Philosophy 65 56 86.2% 105.8 70 70 100% 114.6 Geography 80 81 101.3% 119 80 80 100% 126.4 History 80 80 100% 122 90 79 88% 105.8 History of Art 35 35 100% 118.8 40 27 68% 117.4 Applied Languages 30 30 100% 156.8 20 20 100% 156.8 Languages and International Relations 35 35 100% 160.4 20 20 100% 175.4 Languages, Literatures and Cultures 85 85 100% 146.4 85 85 100% 137.6 Sociology 50 50 100% 141.2 50 50 100% 135.8 Faculty of Medicine 245 245 100% 185.2 240 241 100% 186.3 Medicine 245 245 100% 185.2 240 241 100% 186.3
Faculty of Dental Medicine 90 90 100% 173.3 90 90 100% 171.5
2008 2007 Places Successful applicants Rate of places filled Classification of last qualifying applicant (general group) Places Successful applicants Rate of places filled Classification of last qualifying applicant (general group) Faculty of Psychology and
Education Science 170 170 100% 146.8* 170 170 100% 154.3*
Education Sciences 55 55 100% 136 55 55 100% 147.5
Psychology 115 115 100% 152 115 115 100% 157.5
Institute of Biomedical
Sciences Abel Salazar 250 251 100% 175.5* 245 246 100% 174.9*
Aquatic Sciences 35 35 100% 142.5 35 35 100% 145.5
Medicine 155 156 100.6% 183.7 150 150 100% 182
Veterinary Medicine 60 60 100% 173.5 60 61 102% 174.5
U.Porto total 4025 4010 99.6% 154.2* 3968 3947 99% 149.5*
* Average classification that would be obtained if all applicants admitted to each course had a classification equal to the classification of the last qualifying applicant in the general group. Weighting factor: no. of successful applicants to each course.
Sources: MCTES – DGES A08_1F and MCTES – DGES A07_1F
Chart 5: Rate of places filled per faculty: comparative analysis 2007-2008
100% 100% 99% 100% 100% 100% 100% 100% 100% 99% 100% 100% 100% 100% 100% 100% 100% 100% 100% 100% 100% 100% 96% 100% 100% 100% 100% 99% 0% 10% 20% 30% 40% 50% 60% 70% 80% 90% 100% Faculty of Architecture
Faculty of Fine Arts Faculty of Sciences Faculty of Nutrition and Food Science Faculty of Sport Faculty of Law Faculty of Economics Faculty of Engineering Faculty of Pharmacy Faculty of Arts Faculty of Medicine Faculty of Dental Medicine Faculty of Psychology and Education Science Institute of Biomedical Sciences Abel Salazar Total U.Porto
2007 2008
Chart 6: Weighted average classification of the last qualifying applicant, per faculty: comparative
analysis 2007-2008
180,0 160,0 135,6 161,3 141,5 165,7 161,3 156,5 166,3 134,6 185,2 173,3 146,8 175,5 154,2 182,0 164,0 131,8 158,5 142,0 153,3 147,2 146,5 163,0 130,8 186,3 171,5 154,3 174,9 149,5 0 20 40 60 80 100 120 140 160 180 200 Faculty of ArchitectureFaculty of Fine Arts Faculty of Sciences Faculty of Nutrition and Food Science Faculty of Sport Faculty of Law Faculty of Economics Faculty of Engineering Faculty of Pharmacy Faculty of Arts Faculty of Medicine Faculty of Dental Medicine Faculty of Psychology and Education Science Institute of Biomedical Sciences Abel Salazar Total U.Porto
2007 2008
Table 7: Successful applicants per placement round
Total %
General 3860 96.3%
Madeira 72 1.8%
Azores 31 0.8%
Emigrants 20 0.5%
Applicants with disabilities 17 0.4%
Military 10 0.2%
U.Porto total 4010 100.0%
´
Table 8: Successful applicants per school district where exams took place
Total % Cumulative % Porto 2432 60.6% 60.6% Braga 404 10.1% 70.7% Aveiro 396 9.9% 80.6% Viana do Castelo 169 4.2% 84.8% Vila Real 118 2.9% 87.8% Viseu 118 2.9% 90.7%
Autonomous Region of Madeira 78 1.9% 92.6%
Bragança 73 1.8% 94.5%
Autonomous Region of the Azores 39 1.0% 95.4%
Coimbra 38 0.9% 96.4% Leiria 29 0.7% 97.1% Guarda 21 0.5% 97.6% Lisboa 20 0.5% 98.1% Santarém 16 0.4% 98.5% Castelo Branco 11 0.3% 98.8% Faro 10 0.2% 99.1% Overseas 6 0.1% 99.2% Setúbal 5 0.1% 99.3% Beja 3 0.1% 99.4% Portalegre 3 0.1% 99.5% Évora 1 0.0% 99.5% (blank) 20 0.5% 100.0% U.Porto total 4010 100.0%
Source: MCTES – DGES BD_U.Porto_08_1F
Chart 7: Total and cumulative percentage of successful applicants per school district where exams
took place
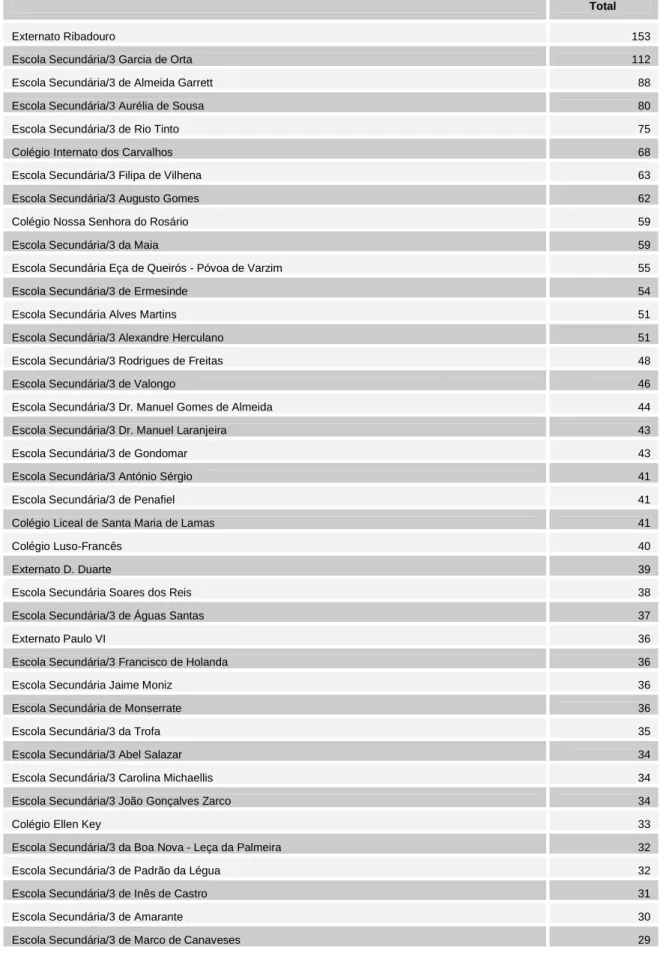
0 500 1000 1500 2000 2500 3000 P o rt o B ra g a A v e ir o V ia n a d o C a s te lo V ila R e a l V is e u R . A . M a d e ir a B ra g a n ç a R . A . A ç o re s C o im b ra L e ir ia G u a rd a L is b o a S a n ta ré m C a s te lo B ra n c o F a ro O v e rs e a s S e tú b a l B e ja P o rt a le g re É v o ra (b la n k ) 0% 10% 20% 30% 40% 50% 60% 70% 80% 90% 100% Total %cumulativeTable 9: Successful applicants per school where exams took place (top 50)
Total
Externato Ribadouro 153
Escola Secundária/3 Garcia de Orta 112
Escola Secundária/3 de Almeida Garrett 88
Escola Secundária/3 Aurélia de Sousa 80
Escola Secundária/3 de Rio Tinto 75
Colégio Internato dos Carvalhos 68
Escola Secundária/3 Filipa de Vilhena 63
Escola Secundária/3 Augusto Gomes 62
Colégio Nossa Senhora do Rosário 59
Escola Secundária/3 da Maia 59
Escola Secundária Eça de Queirós - Póvoa de Varzim 55
Escola Secundária/3 de Ermesinde 54
Escola Secundária Alves Martins 51
Escola Secundária/3 Alexandre Herculano 51
Escola Secundária/3 Rodrigues de Freitas 48
Escola Secundária/3 de Valongo 46
Escola Secundária/3 Dr. Manuel Gomes de Almeida 44
Escola Secundária/3 Dr. Manuel Laranjeira 43
Escola Secundária/3 de Gondomar 43
Escola Secundária/3 António Sérgio 41
Escola Secundária/3 de Penafiel 41
Colégio Liceal de Santa Maria de Lamas 41
Colégio Luso-Francês 40
Externato D. Duarte 39
Escola Secundária Soares dos Reis 38
Escola Secundária/3 de Águas Santas 37
Externato Paulo VI 36
Escola Secundária/3 Francisco de Holanda 36
Escola Secundária Jaime Moniz 36
Escola Secundária de Monserrate 36
Escola Secundária/3 da Trofa 35
Escola Secundária/3 Abel Salazar 34
Escola Secundária/3 Carolina Michaellis 34
Escola Secundária/3 João Gonçalves Zarco 34
Colégio Ellen Key 33
Escola Secundária/3 da Boa Nova - Leça da Palmeira 32
Escola Secundária/3 de Padrão da Légua 32
Escola Secundária/3 de Inês de Castro 31
Escola Secundária/3 de Amarante 30
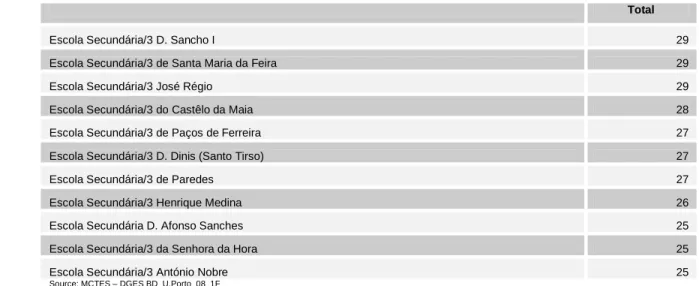
Total
Escola Secundária/3 D. Sancho I 29
Escola Secundária/3 de Santa Maria da Feira 29
Escola Secundária/3 José Régio 29
Escola Secundária/3 do Castêlo da Maia 28
Escola Secundária/3 de Paços de Ferreira 27
Escola Secundária/3 D. Dinis (Santo Tirso) 27
Escola Secundária/3 de Paredes 27
Escola Secundária/3 Henrique Medina 26
Escola Secundária D. Afonso Sanches 25
Escola Secundária/3 da Senhora da Hora 25
Escola Secundária/3 António Nobre 25
Source: MCTES – DGES BD_U.Porto_08_1F
Table 10: Successful applicants per gender and course
F M Total
Faculty of Architecture 68 52 120
Architecture 68 52 120
Faculty of Fine Arts 96 44 140
Plastic Arts 60 30 90 Communication Design 36 14 50 Faculty of Sciences 353 304 657 Landscape Architecture 14 11 25 Astronomy 7 13 20 Biology 98 32 130 Biochemistry 45 25 70 Computer Science 8 32 40 Engineering Sciences 26 19 45
Environmental Sciences and Technology 23 17 40
Network Engineering and IT Systems 10 60 70
Physical Engineering 10 15 25
Physics 5 17 22
Geology 13 17 30
Mathematics 29 21 50
Chemistry 65 25 90
Faculty of Nutrition and Food Science 55 10 65
Nutrition Sciences 55 10 65
Faculty of Sport 42 68 110
F M Total Faculty of Law 126 49 175 Criminology 29 6 35 Law 97 43 140 Faculty of Economics 147 183 330 Economics 96 120 216 Management 51 63 114 Faculty of Engineering 245 585 830 Bioengineering 36 24 60
Engineering Sciences – Mining and Geo-Environmental Engineering 3 7 10
Civil Engineering 60 115 175
Environmental Engineering 19 21 40
Electrical and Computers Engineering 24 171 195
Industrial Engineering and Management 20 30 50
Informatics and Computing Engineering 20 82 102
Mechanical Engineering 17 95 112
Metallurgical and Materials Engineering 7 14 21
Chemical Engineering 39 26 65 Faculty of Pharmacy 137 48 185 Pharmaceutical Sciences 137 48 185 Faculty of Arts 424 218 642 Archeology 18 17 35 Information Science 25 15 40
Communication Sciences: Journalism, Public Relations and Multimedia 60 15 75
Language Sciences 19 1 20
Portuguese and Lusophone Studies 13 7 20
Philosophy 28 28 56
Geography 45 36 81
History 42 38 80
History of Art 24 11 35
Applied Languages 21 9 30
Languages and International Relations 26 9 35
Languages, Literatures and Cultures 65 20 85
Sociology 38 12 50
Faculty of Medicine 140 105 245
F M Total
Faculty of Dental Medicine 57 33 90
Dental Medicine 57 33 90
Faculty of Psychology and Education Science 150 20 170
Education Sciences 50 5 55
Psychology 100 15 115
Institute of Biomedical Sciences Abel Salazar 167 84 251
Aquatic Sciences 20 15 35
Medicine 104 52 156
Veterinary Medicine 43 17 60
U.Porto total 2207 1803 4010
Source: MCTES – DGES BD_U.Porto_08_1F
Table 11: Successful applicants per gender and faculty
F M Total
Faculty of Architecture 68 52 120
Faculty of Fine Arts 96 44 140
Faculty of Sciences 353 304 657
Faculty of Nutrition and Food Science 55 10 65
Faculty of Sport 42 68 110 Faculty of Law 126 49 175 Faculty of Economics 147 183 330 Faculty of Engineering 245 585 830 Faculty of Pharmacy 137 48 185 Faculty of Arts 424 218 642 Faculty of Medicine 140 105 245
Faculty of Dental Medicine 57 33 90
Faculty of Psychology and Education Science 150 20 170
Institute of Biomedical Sciences Abel Salazar 167 84 251
U.Porto total 2207 1803 4010
55% 45%
Chart 8: Successful applicants per gender and faculty, in percentage
0% 10% 20% 30% 40% 50% 60% 70% 80% 90% 100% F A U P F B A U P F C U P F C N A U P F A D E U P F D U P F E P F E U P F F U P F L U P F M U P F M D U P F P C E U P IC B A S T o ta l U .P o rt o M FTable 12: Successful applicants per admission preference and course
1 2 3 4 5 6 Total
Faculty of Architecture 113 3 2 2 120
Architecture 113 3 2 2 120
Faculty of Fine Arts 99 35 5 1 140
Plastic Arts 58 26 5 1 90 Communication Design 41 9 50 Faculty of Sciences 252 142 97 80 50 36 657 Landscape Architecture 15 4 3 2 1 25 Astronomy 12 1 2 2 3 20 Biology 51 30 23 16 6 4 130 Biochemistry 22 18 13 10 3 4 70 Computer Science 15 7 8 5 1 4 40 Engineering Sciences 17 8 8 6 4 2 45
Environmental Sciences and Technology 12 11 6 4 6 1 40
Network Engineering and IT Systems 22 23 9 7 6 3 70
Physical Engineering 15 6 1 1 2 25
Physics 13 5 2 1 1 22
Geology 12 3 2 2 4 7 30
Mathematics 28 4 6 4 4 4 50
Chemistry 18 22 14 21 12 3 90
Faculty of Nutrition and Food Science 23 5 1 12 7 17 65
1 2 3 4 5 6 Total Faculty of Sport 100 7 1 1 1 110 Sports Sciences 100 7 1 1 1 110 Faculty of Law 152 10 6 6 1 175 Criminology 28 1 3 2 1 35 Law 124 9 3 4 140 Faculty of Economics 292 32 4 1 1 330 Economics 205 7 3 1 216 Management 87 25 1 1 114 Faculty of Engineering 525 154 57 35 42 17 830 Bioengineering 38 2 1 5 11 3 60
Engineering Sciences - Mining and Geo-Environmental Engineering 4 1 1 2 2 10
Civil Engineering 114 31 11 10 5 4 175
Environmental Engineering 18 11 3 3 4 1 40
Electrical and Computers Engineering 128 47 13 3 4 195
Industrial Engineering and Management 40 3 3 1 2 1 50
Informatics and Computing Engineering 88 4 4 2 2 2 102
Mechanical Engineering 72 37 1 1 1 112
Metallurgical and Materials Engineering 4 3 6 4 4 21
Chemical Engineering 23 12 14 5 8 3 65 Faculty of Pharmacy 68 15 23 26 32 21 185 Pharmaceutical Sciences 68 15 23 26 32 21 185 Faculty of Arts 371 113 76 44 17 21 642 Archaeology 26 4 4 1 35 Information Science 17 8 11 3 1 40
Communication Sciences: Journalism, Public Relations, Multimedia 68 6 1 75
Language Sciences 8 6 1 4 1 20
Portuguese and Lusophone Studies 6 2 3 8 1 20
Philosophy 13 13 13 6 3 8 56
Geography 41 16 8 8 3 5 81
History 42 16 10 5 2 5 80
History of Art 17 11 5 2 35
Applied Languages 24 1 3 2 30
Languages and International Relations 30 5 35
Languages, Literatures and Cultures 59 15 7 3 1 85
Sociology 20 10 14 4 2 50
Faculty of Medicine 233 9 2 1 245
1 2 3 4 5 6 Total
Faculty of Dental Medicine 17 4 11 11 23 24 90
Dental Medicine 17 4 11 11 23 24 90
Faculty of Psychology and Education Science 101 31 20 6 6 6 170
Education Sciences 21 18 11 1 2 2 55
Psychology 80 13 9 5 4 4 115
Institute of Biomedical Sciences Abel Salazar 140 59 15 15 10 12 251
Aquatic Sciences 14 5 5 6 1 4 35
Medicine 102 51 2 1 156
Veterinary Medicine 24 3 8 8 9 8 60
U.Porto total 2486 619 318 239 190 158 4010
Source: MCTES – DGES BD_U.Porto_08_1F
Table 13: Successful applicants per admission preference and faculty
1 2 3 4 5 6 Total
Faculty of Architecture 113 3 2 2 120
Faculty of Fine Arts 99 35 5 1 140
Faculty of Sciences 252 142 97 80 50 36 657
Faculty of Nutrition and Food Science 23 5 1 12 7 17 65
Faculty of Sport 100 7 1 1 1 110 Faculty of Law 152 10 6 6 1 175 Faculty of Economics 292 32 4 1 1 330 Faculty of Engineering 525 154 57 35 42 17 830 Faculty of Pharmacy 68 15 23 26 32 21 185 Faculty of Arts 371 113 76 44 17 21 642 Faculty of Medicine 233 9 2 1 245
Faculty of Dental Medicine 17 4 11 11 23 24 90
Faculty of Psychology and Education Science 101 31 20 6 6 6 170
Institute of Biomedical Sciences Abel Salazar 140 59 15 15 10 12 251
U.Porto total 2486 619 318 239 190 158 4010
62% 15% 8% 6% 5% 4% 100%
Chart 9: Successful applicants per admission preference and faculty, in percentage
0% 10% 20% 30% 40% 50% 60% 70% 80% 90% 100% F A U P F B A U P F C U P F C N A U P F A D E U P F D U P F E P F E U P F F U P F L U P F M U P F M D U P F P C E U P IC B A S T o ta l U .P o rt o 6 5 4 3 2 1I.2.2 – Applicants
Table 14: Applicants per school district where exams took place
Total % Cumulative % Porto 5933 42.4% 42.4% Braga 1824 13.0% 55.4% Aveiro 1432 10.2% 65.7% Lisboa 721 5.2% 70.8% Viseu 548 3.9% 74.8% Viana do Castelo 531 3.8% 78.5% Coimbra 412 2.9% 81.5%
Autonomous Region of Madeira 370 2.6% 84.1%
Vila Real 346 2.5% 86.6%
Leiria 328 2.3% 89.0%
Santarém 279 2.0% 91.0%
Setúbal 241 1.7% 92.7%
Autonomous Region of the Azores 240 1.7% 94.4%
Bragança 213 1.5% 95.9% Guarda 159 1.1% 97.0% Faro 141 1.0% 98.1% Castelo Branco 111 0.8% 98.8% Évora 48 0.3% 99.2% Beja 31 0.2% 99.4% Portalegre 22 0.2% 99.6% Overseas 20 0.1% 99.7% (blank) 40 0.3% 100.0% U.Porto total 13990
Chart 10: Total and cumulative percentage of applicants per school district where exams took place
0 1000 2000 3000 4000 5000 6000 7000 P o rt o B ra g a A v e ir o L is b o a V is e u V ia n a d o C a s te lo C o im b ra R . A . M a d e ir a V ila R e a l L e ir ia S a n ta ré m S e tú b a l R . A . A ç o re s B ra g a n ç a G u a rd a F a ro C a s te lo B ra n c o É v o ra B e ja P o rt a le g re O v e rs e a s (b la n k ) 0% 10% 20% 30% 40% 50% 60% 70% 80% 90% 100% Total % cumulativeTable 15: Applicants per school where exams took place (top 50)
Total
Externato Ribadouro 258
Escola Secundária/3 Garcia de Orta 231
Escola Secundária Alves Martins 172
Escola Secundária Jaime Moniz 169
Escola Secundária/3 de Rio Tinto 166
Escola Secundária/3 da Maia 166
Escola Secundária/3 de Almeida Garrett 164
Escola Secundária/3 Alexandre Herculano 151
Escola Secundária Carlos Amarante 149
Escola Secundária/3 Filipa de Vilhena 148
Escola Secundária/3 Aurélia de Sousa 145
Colégio Internato dos Carvalhos 143
Escola Secundária Eça de Queirós - Póvoa de Varzim 141
Escola Secundária/3 Francisco de Holanda 140
Escola Secundária/3 Augusto Gomes 131
Escola Secundária/3 de Ermesinde 129
Externato D. Duarte 128
Escola Secundária de Monserrate 122
Escola Secundária/3 de Penafiel 120
Escola Secundária/3 de Valongo 114
Escola Secundária/3 de Gondomar 113
Escola Secundária/3 D. Maria II 104
Total
Escola Secundária/3 Rodrigues de Freitas 102
Escola Secundária/3 Alcaides de Faria - Arcozelo 102
Escola Secundária/3 Dr. Manuel Gomes de Almeida 100
Escola Secundária/3 Sá de Miranda 97
Escola Secundária Santa Maria Maior 97
Escola Secundária/3 António Sérgio 96
Escola Secundária/3 da Trofa 95
Escola Secundária/3 da Boa Nova - Leça da Palmeira 94
Escola Secundária Soares dos Reis 91
Externato Carvalho Araújo 90
Escola Secundária/3 Alberto Sampaio 90
Escola Secundária/3 de Águas Santas 87
Colégio Nossa Senhora do Rosário 87
Escola Secundária/3 Dr. Manuel Laranjeira 86
Escola Secundária/3 Carolina Michaellis 85
Escola Secundária/3 D. Sancho I 85
Escola Secundária/3 de Amarante 83
Escola Secundária/3 de Marco de Canaveses 82
Escola Secundária/3 de Paços de Ferreira 82
Escola Secundária/3 de Santa Maria da Feira 81
Escola Secundária D. Afonso Sanches 81
Escola Secundária/3 de Felgueiras 81
Escola Secundária/3 António Nobre 80
Escola Secundária/3 João Gonçalves Zarco 80
Externato Paulo VI 79
Escola Secundária/3 de Fafe 79
Escola Secundária/3 Camilo Castelo Branco-V.N.Famalicão 78
Source: MCTES – DGES BD_U.Porto_08_1F
Table 16: Applicants per gender and course
F M Total
Faculty of Architecture 314 257 571
Architecture 314 257 571
Faculty of Fine Arts 355 194 549
Plastic Arts 232 124 356 Communication Design 224 133 357 Faculty of Sciences 1244 1304 2548 Landscape Architecture 91 59 150 Astronomy 48 52 100 Biology 411 190 601 Biochemistry 391 160 551
F M Total
Computer Science 53 267 320
Engineering Sciences 98 88 186
Environmental Sciences and Technology 166 122 288
Network Engineering and IT Systems 62 517 579
Physical Engineering 39 111 150
Physics 22 83 105
Geology 71 73 144
Mathematics 117 88 205
Chemistry 166 70 236
Faculty of Nutrition and Food Science 444 72 516
Nutrition Sciences 444 72 516 Faculty of Sport 144 295 439 Sports Sciences 144 295 439 Faculty of Law 1213 510 1723 Criminology 579 210 789 Law 891 400 1291 Faculty of Economics 531 566 1097 Economics 380 457 837 Management 437 460 897 Faculty of Engineering 1142 2357 3499 Bioengineering 297 248 545
Engineering Sciences - Mining and Geo-Environmental Engineering 34 69 103
Civil Engineering 253 547 800
Environmental Engineering 287 248 535
Electrical and Computers Engineering 113 902 1015
Industrial Engineering and Management 184 369 553
Informatics and Computing Engineering 122 630 752
Mechanical Engineering 137 844 981
Metallurgical and Materials Engineering 67 171 238
Chemical Engineering 191 119 310 Faculty of Pharmacy 841 287 1128 Pharmaceutical Sciences 841 287 1128 Faculty of Arts 1516 678 2194 Archaeology 71 60 131 Information Science 206 120 326
Communication Sciences: Journalism, Public Relations and Multimedia 436 159 595
Language Sciences 124 42 166
F M Total Philosophy 83 75 158 Geography 136 128 264 History 160 155 315 History of Art 66 23 89 Applied Languages 154 59 213
Languages and International Relations 256 113 369
Languages, Literatures and Cultures 244 92 336
Sociology 370 127 497
Faculty of Medicine 910 460 1370
Medicine 910 460 1370
Faculty of Dental Medicine 522 219 741
Dental Medicine 522 219 741
Faculty of Psychology and Education Science 637 96 733
Education Sciences 246 32 278
Psychology 453 69 522
Institute of Biomedical Sciences Abel Salazar 1256 631 1887
Aquatic Sciences 105 53 158
Medicine 930 484 1414
Veterinary Medicine 272 115 387
U.Porto total 7856 6140 13990
Note: In the sub-totals of faculties with more than one course and in the U.Porto total (as applicants may have applied to more than one course),each applicant is counted only once.
Source: MCTES – DGES BD_U.Porto_08_1F
Table 17: Applicants per gender and faculty
F M Total
Faculty of Architecture 314 257 571
Faculty of Fine Arts 355 194 549
Faculty of Sciences 1244 1304 2548
Faculty of Nutrition and Food Science 444 72 516
Faculty of Sport 144 295 439 Faculty of Law 1213 510 1723 Faculty of Economics 531 566 1097 Faculty of Engineering 1142 2357 3499 Faculty of Pharmacy 841 287 1128 Faculty of Arts 1516 678 2194 Faculty of Medicine 910 460 1370
Faculty of Dental Medicine 522 219 741
Faculty of Psychology and Education Science 637 96 733
Institute of Biomedical Sciences Abel Salazar 1256 631 1887
U.Porto total 7856 6140 13990
56% 44%
Chart 11: Applicants per gender and faculty, in percentage
0% 10% 20% 30% 40% 50% 60% 70% 80% 90% 100% F A U P F B A U P F C U P F C N A U P F A D E U P F D U P F E P F E U P F F U P F L U P F M U P F M D U P F P C E U P IC B A S T o ta l U .P o rt o M FTable 18: Applicants per application choice and course
1 2 3 4 5 6 Total
Faculty of Architecture 284 104 69 39 44 31 571
Architecture 284 104 69 39 44 31 571
Faculty of Fine Arts 275 109 71 43 32 19 549
Plastic Arts 136 94 57 27 21 21 356 Communication Design 139 101 51 27 28 11 357 Faculty of Sciences 535 472 467 403 370 301 2548 Landscape Architecture 44 18 33 21 21 13 150 Astronomy 13 6 15 21 21 24 100 Biology 114 123 103 104 85 72 601 Biochemistry 81 101 88 92 107 82 551 Computer Science 34 54 59 73 51 49 320 Engineering Sciences 33 22 29 30 33 39 186
Environmental Sciences and Technology 37 61 67 45 50 28 288
Network Engineering and IT Systems 76 112 128 106 100 57 579
Physical Engineering 21 24 36 20 24 25 150
Physics 13 23 13 21 15 20 105
Geology 23 23 25 27 20 26 144
Mathematics 28 30 31 27 31 58 205
1 2 3 4 5 6 Total
Faculty of Nutrition and Food Science 156 77 59 70 69 85 516
Nutrition Sciences 156 77 59 70 69 85 516 Faculty of Sport 258 75 53 31 14 8 439 Sports Sciences 258 75 53 31 14 8 439 Faculty of Law 647 313 226 280 141 116 1723 Criminology 254 122 105 124 83 101 789 Law 393 302 188 225 110 73 1291 Faculty of Economics 709 111 104 70 61 42 1097 Economics 420 205 65 65 47 35 837 Management 289 319 90 95 61 43 897 Faculty of Engineering 1654 539 446 323 317 220 3499 Bioengineering 174 90 80 83 68 50 545
Engineering Sciences - Mining and
Geo-Environmental Engineering 11 19 20 19 21 13 103
Civil Engineering 220 164 147 113 89 67 800
Environmental Engineering 110 81 81 83 101 79 535
Electrical and Computers Engineering 262 270 186 122 106 69 1015
Industrial Engineering and Management 223 82 107 43 62 36 553
Informatics and Computing Engineering 280 139 104 102 74 53 752
Mechanical Engineering 298 245 162 115 96 65 981
Metallurgical and Materials Engineering 28 38 58 44 39 31 238
Chemical Engineering 48 42 56 45 61 58 310 Faculty of Pharmacy 348 182 178 147 143 130 1128 Pharmaceutical Sciences 348 182 178 147 143 130 1128 Faculty of Arts 785 401 347 290 205 166 2194 Archaeology 37 23 15 21 20 15 131 Information Science 51 53 73 61 50 38 326
Communication Sciences: Journalism, Public
Relations and Multimedia 257 116 74 67 48 33 595
Language Sciences 21 29 30 37 30 19 166
Portuguese and Lusophone Studies 6 10 20 23 11 14 84
Philosophy 13 22 38 30 24 31 158
Geography 48 47 50 46 35 38 264
History 54 52 59 50 52 48 315
History of Art 17 17 24 15 8 8 89
Applied Languages 46 59 39 37 17 15 213
1 2 3 4 5 6 Total
Languages, Literatures and Cultures 100 75 64 49 27 21 336
Sociology 62 100 91 98 87 59 497
Faculty of Medicine 547 328 161 212 94 28 1370
Medicine 547 328 161 212 94 28 1370
Faculty of Dental Medicine 150 93 94 98 134 172 741
Dental Medicine 150 93 94 98 134 172 741
Faculty of Psychology and Education Science 218 134 131 96 93 61 733
Education Sciences 48 70 52 36 44 28 278
Psychology 170 88 92 72 59 41 522
Institute of Biomedical Sciences Abel Salazar 479 619 298 218 195 78 1887
Aquatic Sciences 31 18 33 36 17 23 158
Medicine 333 536 207 156 150 32 1414
Veterinary Medicine 115 69 73 41 46 43 387
U.Porto total 7045 2299 1693 1442 961 550 13990
Note: In the sub-totals of faculties with more than one course and in the U.Porto total (as applicants may have applied to more than one course), each applicant is counted only in their highest (valid) choice.
Source: MCTES – DGES BD_U.Porto_08_1F
Table 19: Applicants per application choice and faculty
1 2 3 4 5 6 Total
Faculty of Architecture 284 104 69 39 44 31 571
Faculty of Fine Arts 275 109 71 43 32 19 549
Faculty of Sciences 535 472 467 403 370 301 2548
Faculty of Nutrition and Food Science 156 77 59 70 69 85 516
Faculty of Sport 258 75 53 31 14 8 439 Faculty of Law 647 313 226 280 141 116 1723 Faculty of Economics 709 111 104 70 61 42 1097 Faculty of Engineering 1654 539 446 323 317 220 3499 Faculty of Pharmacy 348 182 178 147 143 130 1128 Faculty of Arts 785 401 347 290 205 166 2194 Faculty of Medicine 547 328 161 212 94 28 1370
Faculty of Dental Medicine 150 93 94 98 134 172 741
Faculty of Psychology and Education Science 218 134 131 96 93 61 733
Institute of Biomedical Sciences Abel Salazar 479 619 298 218 195 78 1887
U.Porto total 7045 2299 1693 1442 961 550 13990
50% 16% 12% 10% 7% 4%
Note: In the sub-totals of faculties with more than one course and in the U.Porto total (as applicants may have applied to more than one course), each applicant is counted only in their highest (valid) choice.
Chart 12: Applicants per application choice and faculty, in percentage
0% 10% 20% 30% 40% 50% 60% 70% 80% 90% 100% F A U P F B A U P F C U P F C N A U P F A D E U P F D U P F E P F E U P F F U P F L U P F M U P F M D U P F P C E U P IC B A S T o ta l U .P o rt o 6 5 4 3 2 1Table 20: U.Porto: Rate of places filled and demand per course
Places Successful applicants
Rate of
places filled Applicants *
Applicants per place Applicants 1st choice Applicants 1st choice per place Faculty of Architecture 120 120 100% 571 4.8 284 2.4 Architecture 120 120 100% 571 4.8 284 2.4
Faculty of Fine Arts 140 140 100% 549* 3.9 275 2.0
Plastic Arts 90 90 100% 356 4.0 136 1.5 Communication Design 50 50 100% 357 7.1 139 2.8 Faculty of Sciences 665 657 98.8% 2548* 3.8 535 0.8 Landscape Architecture 25 25 100% 150 6.0 44 1.8 Astronomy 20 20 100% 100 5.0 13 0.7 Biology 130 130 100% 601 4.6 114 0.9 Biochemistry 70 70 100% 551 7.9 81 1.2 Computer Science 40 40 100% 320 8.0 34 0.9 Engineering Sciences 45 45 100% 186 4.1 33 0.7
Environmental Sciences and
Technology 40 40 100% 288 7.2 37 0.9
Network Engineering and IT
Systems 70 70 100% 579 8.3 76 1.1 Physical Engineering 25 25 100% 150 6.0 21 0.8 Physics 30 22 73.3% 105 3.5 13 0.4 Geology 30 30 100% 144 4.8 23 0.8 Mathematics 50 50 100% 205 4.1 28 0.6 Chemistry 90 90 100% 236 2.6 18 0.2
Places Successful applicants
Rate of
places filled Applicants *
Applicants per place Applicants 1st choice Applicants 1st choice per place Faculty of Nutrition and Food
Science 65 65 100% 516 7.9 156 2.4 Nutrition Sciences 65 65 100% 516 7.9 156 2.4 Faculty of Sport 110 110 100% 439 4.0 258 2.3 Sports Sciences 110 110 100% 439 4.0 258 2.3 Faculty of Law 175 175 100% 1723* 9.8 647 3.7 Criminology 35 35 100% 789 22.5 254 7.3 Law 140 140 100% 1291 9.2 393 2.8 Faculty of Economics 330 330 100% 1097* 3.3 709 2.1 Economics 216 216 100% 837 3.9 420 1.9 Management 114 114 100% 897 7.9 289 2.5 Faculty of Engineering 830 830 100% 3499* 4.2 1654 2.0 Bioengineering 60 60 100% 545 9.1 174 2.9
Engineering Sciences - Mining and
Geo-Environmental Engineering 10 10 100% 103 10.3 11 1.1
Civil Engineering 175 175 100% 800 4.6 220 1.3
Environmental Engineering 40 40 100% 535 13.4 110 2.8
Electrical and Computers
Engineering 195 195 100% 1015 5.2 262 1.3
Industrial Engineering and
Management 50 50 100% 553 11.1 223 4.5
Informatics and Computing
Engineering 102 102 100% 752 7.4 280 2.7
Mechanical Engineering 112 112 100% 981 8.8 298 2.7
Metallurgical and Materials
Engineering 21 21 100% 238 11.3 28 1.3 Chemical Engineering 65 65 100% 310 4.8 48 0.7 Faculty of Pharmacy 185 185 100% 1128 6.1 348 1.9 Pharmaceutical Sciences 185 185 100% 1128 6.1 348 1.9 Faculty of Arts 650 642 98.8% 2194* 3.4 785 1.2 Archaeology 35 35 100% 131 3.7 37 1.1 Information Science 40 40 100% 326 8.2 51 1.3 Communication Sciences: Journalism, Public Relations and
Multimedia 75 75 100% 595 7.9 257 3.4
Language Sciences 20 20 100% 166 8.3 21 1.1
Portuguese and Lusophone
Studies 20 20 100% 84 4.2 6 0.3 Philosophy 65 56 86.2% 158 2.4 13 0.2 Geography 80 81 101.3% 264 3.3 48 0.6 History 80 80 100% 315 3.9 54 0.7 History of Art 35 35 100% 89 2.5 17 0.5 Applied Languages 30 30 100% 213 7.1 46 1.5
Languages and International
Relations 35 35 100% 369 10.5 73 2.1
Languages, Literatures and
Cultures 85 85 100% 336 4.0 100 1.2
Places Successful applicants
Rate of
places filled Applicants *
Applicants per place Applicants 1st choice Applicants 1st choice per place Faculty of Medicine 245 245 100% 1370 5.6 547 2.2 Medicine 245 245 100% 1370 5.6 547 2.2
Faculty of Dental Medicine 90 90 100% 741 8.2 150 1.7
Dental Medicine 90 90 100% 741 8.2 150 1.7
Faculty of Psychology and
Education Science 170 170 100% 733* 4.3 218 1.3
Education Sciences 55 55 100% 278 5.1 48 0.9
Psychology 115 115 100% 522 4.5 170 1.5
Institute of Biomedical Sciences
Abel Salazar 250 251 100% 1887* 7.5 479 1.9
Aquatic Sciences 35 35 100% 158 4.5 31 0.9
Medicine 155 156 100.6% 1414 9.1 333 2.1
Veterinary Medicine 60 60 100% 387 6.5 115 1.9
U.Porto total 4025 4010 99.6% 13990* 3.5 7045 1.8
* Actual no. of applicants applying in any (valid) choice to a faculty’s courses, and not the sum of applications to each course in the said faculty. In the faculties with more than one course (as applicants may have applied to more than one), we cannot compare this figure with those prior to 2007, where the total per faculty was the sum of applications to courses.
Source: MCTES – DGES BD_U.Porto_08_1F
Chart 13: Rate of places filled and demand, per faculty
100% 100% 98,8% 100% 100% 100% 100% 100% 100% 98,8% 100% 100% 100% 100% 99,6% 2,4 2,0 0,8 2,4 2,3 3,7 2,1 2,0 1,9 1,2 2,2 1,7 1,3 1,9 1,8 4,8 3,9 3,8 7,9 4,0 9,8 3,3 4,2 3,4 5,6 8,2 4,3 7,5 3,5 6,1 0 1 2 3 4 5 6 7 8 9 10 FAUP FBAUP FCUP FCNAUP FADEUP FDUP FEP FEUP FFUP FLUP FMUP FMDUP FPCEUP ICBAS Total U.Porto
Applicants per place Applicants in 1st choice per place
Chart 14: Rate of places filled and course demand for the Faculty of Architecture
100% 2,4 4,8 0 0,5 1 1,5 2 2,5 3 3,5 4 4,5 5 ArchitectureApplicants per place Applicants in 1st choice per place Rate of places filled
Chart 15: Rate of places filled and course demand for the Faculty of Fine Arts
100% 100% 1,5 2,8 4,0 7,1 0 1 2 3 4 5 6 7 8 Plastic Arts Communication Design
Applicants per place Applicants in 1st choice per place Rate of places filled
36
Chart 16: Rate of places filled and course demand for the Faculty of Sciences
100% 100% 100% 100% 100% 100% 100% 100% 100% 73,3% 100% 100% 100% 1,8 0,7 0,9 1,2 0,9 0,7 0,9 1,1 0,8 0,4 0,8 0,6 0,2 6,0 5,0 4,6 7,9 8,0 4,1 7,2 8,3 6,0 3,5 4,8 4,1 2,6 0 1 2 3 4 5 6 7 8 9 Landscape Architecture Astronomy Biology Biochemistry Computer Science Engineering Sciences Environmental Sciences and
Technology Network Engineering and IT Systems
Physical Engineering Physics Geology Mathematics Chemistry
Applicants per place
Applicants in 1st choice per place Rate of places filled
Chart 17: Rate of places filled and course demand for the Faculty of Nutrition and Food Science
100% 2,4 7,9 0 1 2 3 4 5 6 7 8 9 Nutrition SciencesApplicants per place Applicants in 1st choice per place Rate of places filled
Chart 18: Rate of places filled and course demand for the Faculty of Sport
100%
2,3
4,0
0 0,5 1 1,5 2 2,5 3 3,5 4 4,5
Sports Sciences
Applicants per place Applicants in 1st choice per place Rate of places filled
Chart 19: Rate of places filled and course demand for the Faculty of Law
100% 100% 7,3 2,8 22,5 9,2 0 5 10 15 20 25 Criminology LawApplicants per place Applicants in 1st choice per place Rate of places filled
Chart 20: Rate of places filled and course demand for the Faculty of Economics
100% 100% 1,9 2,5 3,9 7,9 0 1 2 3 4 5 6 7 8 9 Economics Management
Applicants per place Applicants in 1st choice per place Rate of places filled
Chart 21: Rate of places filled and course demand for the Faculty of Engineering
100% 100% 100% 100% 100% 100% 100% 100% 100% 100% 2,9 1,1 1,3 2,8 1,3 4,5 2,7 2,7 1,3 0,7 9,1 10,3 4,6 13,4 5,2 11,1 7,4 8,8 11,3 4,8 0 2 4 6 8 10 12 14 16 Bioengineering Engineering Sciences - Mining and Geo-EnvironmentalEngineering Civil Engineering Environmental Engineering Electrical and Computers
Engineering Industrial Engineering and
Management Informatics and Computing
Engineering Mechanical Engineering Metallurgical and Materials
Engineering Chemical Engineering
Applicants per place Applicants in 1st choice per place Rate of places filled
Chart 22: Rate of places filled and course demand for the Faculty of Pharmacy
100% 1,9
6,1
0 1 2 3 4 5 6 7
Pharmaceutical Sciences
Applicants per place Applicants in 1st choice per place Rate of places filled