Repositório ISCTE-IUL
Deposited in Repositório ISCTE-IUL:
2020-04-06Deposited version:
Post-printPeer-review status of attached file:
Peer-reviewedCitation for published item:
Cardoso, E., Costa, D. & Santos, D. (2017). Introducing the Learning Scorecard: a tool to improve the student learning experience. European Journal of Higher Education IT. 2017 (1)
Further information on publisher's website:
https://www.eunis.org/erai/2017-1/Publisher's copyright statement:
This is the peer reviewed version of the following article: Cardoso, E., Costa, D. & Santos, D. (2017). Introducing the Learning Scorecard: a tool to improve the student learning experience. European Journal of Higher Education IT. 2017 (1). This article may be used for non-commercial purposes in accordance with the Publisher's Terms and Conditions for self-archiving.
Use policy
Creative Commons CC BY 4.0
The full-text may be used and/or reproduced, and given to third parties in any format or medium, without prior permission or charge, for personal research or study, educational, or not-for-profit purposes provided that:
• a full bibliographic reference is made to the original source • a link is made to the metadata record in the Repository • the full-text is not changed in any way
The full-text must not be sold in any format or medium without the formal permission of the copyright holders.
Serviços de Informação e Documentação, Instituto Universitário de Lisboa (ISCTE-IUL) Av. das Forças Armadas, Edifício II, 1649-026 Lisboa Portugal
Phone: +(351) 217 903 024 | e-mail: [email protected] https://repositorio.iscte-iul.pt
Introducing the Learning Scorecard: a tool to improve
the student learning experience
Elsa Cardoso1, Daniela Costa2, Diogo Santos3
1Instituto Universitário de Lisboa (ISCTE-IUL) and INESC-ID, Av. Forças Armadas, 1649-026 Lisbon, Portugal, [email protected]
2Instituto to Universitário de Lisboa (ISCTE-IUL), Av. Forças Armadas, 1649-026 Lisbon, Portugal, [email protected]
3Instituto to Universitário de Lisboa (ISCTE-IUL), Av. Forças Armadas, 1649-026 Lisbon, Portugal, [email protected]
Keywords
Student learning; Balanced Scorecard; Business Intelligence; Gamification.
1. SUMMARY
Improving the student learning experience is an essential aspect of teaching. This paper presents the Learning Scorecard (LS), a tool designed to monitor and manage the learning experience of students in a course. The LS has a student view and a faculty (or course coordinator) view. The student view essentially focuses on time management and uses gamification to engage students with the course’s activities. In the faculty view, data is aggregated from the student’s view, enabling the course coordinator to monitor the average progress of students in the different classes of the course he/she is lecturing. The Learning Scorecard has been developed using Business Intelligence and performance management techniques. It includes a Balanced Scorecard and dashboards for the visualization and monitoring of the student learning experience. In this paper the design of the LS will be presented as well as some initial results with an ongoing experiment in a course lectured in different Higher Education programs within the same university.
2. THE LEARNING SCORECARD
The Learning Scorecard is a performance management tool that applies the quality management principle of “if you can’t measure it, you can’t manage it and improve it”. The goal of the LS is to provide Higher Education students with an analytical environment enabling the monitoring of their performance in a course, contributing to the enhancement of the student learning experience. By measuring the individual student learning performance, the LS also enables the course coordinator to monitor the ongoing learning experience of students throughout the semester. Given its context, the LS is a case study of learning analytics, a recent research area, focusing on the measurement and analysis of “data about learners and their contexts, for purposes of understanding and optimizing learning and the environments in which it occurs,” (Long and Siemens, 2011).
This project started in the spring semester of the 2015-2016 academic year, as a research project of a group of graduate students of a course on Decision Support Systems at the University Institute of Lisbon (ISCTE-IUL), a public university in Lisbon, Portugal. It is currently the research theme of two master dissertations in Computer Science Engineering. The LS has already been used to improve the learning experience of students in the Data Warehouse course, in the winter semester of 2016-2017 (Cardoso et al., 2016). Presently, the LS tool is being tested in the Business Intelligence course, lectured in undergraduate and graduate programs – an ongoing experiment that will be concluded in May 2017.
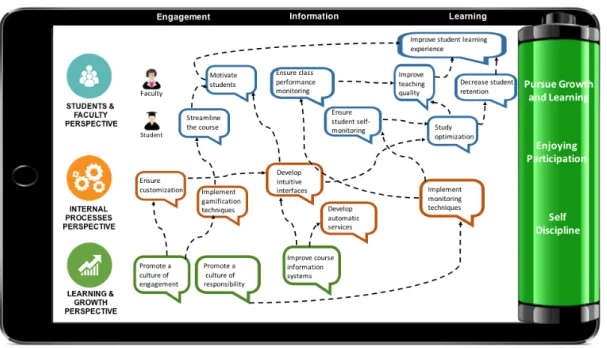
The Learning Scorecard design includes a balanced scorecard (with a strategy map and a quantification framework) and a set of dashboards for the monitoring of the student learning experience. Since the LS is designed for two “customer segments” – students and course coordinator – which have different goals, expectations and pain points, the tool provides two separate views: the student view and the faculty view. The strategy map, in Figure 1, describes the most important strategic objectives and
their dependencies (called cause-and-effect relationships) in order to achieve the strategy of a course (which basically consists of achieving the learning outcomes with an improved student learning experience). In this map, there are three perspectives: Students and Faculty, Internal Processes, and Learning and Growth. The financial perspective, the fourth standard perspective in a Balanced Scorecard is not relevant for the Learning Scorecard, which is focused solely on the student learning experience. At the right end side of Figure 1, are the values that drive this strategic project, which are defined from a student’s view as: pursue growth and learning, enjoying participation and self-discipline. The strategy map is draw as a “mobile phone”, as a metaphor for the portability of the LS platform. One of the design requirements of the LS relates to the portability across web browsers (Firefox, Google Chrome, Safari, Edge) including mobile devices. The development of a mobile application for the student view is also contemplated in the near future.
The strategy map is a communication tool that should be read bottom-up, starting with the objectives in the learning and growth perspective. Following all the cause-and-effect relationships in the map, we can see that the ultimate goal of the LS is to “improve student learning experience”. Each of these strategic objectives are measured by a set of KPIs (key performance indicators) that are monitored in the faculty view by the course coordinator.
Figure 1: The Learning Scorecard strategy map
The LS uses gamification, a recent technique which is being applied to education and other sectors, that uses game design elements in non-game contexts (Deterding et al., 2011; Dicheva et al., 2015). Gamification is particularly important for the student view, and is used to engage and motivate students to experience the different learning challenges proposed by the course coordinator.
The Learning Scorecard receives data from two systems: the e-learning platform and the student academic system. An important design requirement is to have intuitive and user-friendly interfaces, in which the input data required from students should be kept to a minimum. Most of the required data is uploaded into the LS by the course coordinator, based on the course syllabus.
2.1. The student view
The LS student view focuses on time management and monitoring of the individual learning experience. Gamification techniques play a central role in the design of the student view, since the tool is supposed to be used voluntarily by students. Gamification enables the motivation of students in terms of achieving the course goals, and provides a healthy competition environment towards the best course performance. Currently, the LS uses the following game elements: experience points (XP), levels, quests or challenges, leaderboard, avatars, and rewards.
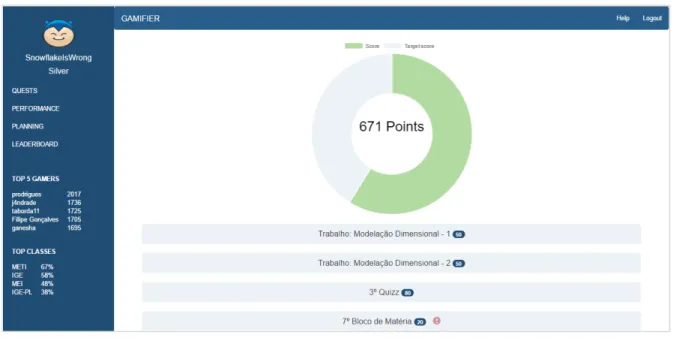
In the LS, students are divided into classes according to their program. Students begin with zero points, and are thus encouraged to learn to earn experience points, and increase their game level. Figure 2 presents an example of the entry page of the student view, for a particular student or “gamer”. In this page the student can visualize his/her performance (in points) and receive alerts about incoming quests deadlines. A summary of the leaderboard is always present (at the sidebar, in the left-down corner of Figure 2), with the top-5 gamers (ordered by points) and the ranking of classes, ordered by the number of active students using the LS. The identification of classes in Figure 2 is done using the Portuguese acronym of the program. Figure 2 presents real data (as of November 18, 2016), of a student enrolled in the Data Warehouse course in the winter semester of 2016-2017. In this semester the course was taught to four programs (respectively with the acronyms MEI, METI, IGE and IGE-PL): two master programs in the area of computer science engineering and two undergraduate programs in informatics and management.
Figure 2: The LS student view: quests and points
Students can also visualize the course planning, with a list of all planned quests, according to the course syllabus. There are mandatory and optional quests. Students receive experience points for concluding quests. Currently, the following type of quests are implemented:
• class assiduity (validated with the assiduity report generated by the student academic system; students have a university student card that needs to be activated at the location and time of the class)
• quizzes (performed using the e-learning system) • exercises (also submitted to the e-learning system)
• practical assignment (entails a qualitative evaluation performed in a tutorial meeting with the teacher, in which students receive feedback on the development of the course’s practical assignment; for instance, in the case of the Data Warehouse course, this assignment was the development of a data mart).
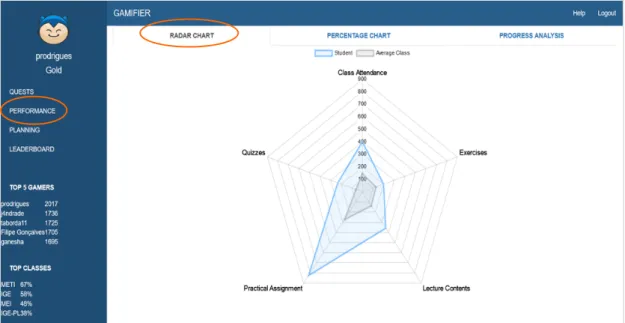
The performance functionality in the student view includes three standard visualizations: progress analysis, percentage chart and radar chart. Figure 3 presents an example of the progress analysis dashboard for the top gamer at the time, in November 18, 2016 (week 9 of the semester, which comprises 12 weeks in total). Student performance is also presented in comparison with the average performance of the class, using a radar chart, as displayed in Figure 4. The percentage chart provides a visualization of the student’s current achievements versus the total amount of points that he/she could have earned so far in the different types of quests.
Student identification data privacy is an important non-functional requirement of the Learning Scorecard. That is, the course coordinator only has access to aggregated class data. What could be perceived as a missed opportunity (in terms of the identification of at-risk students) was in fact considered an advantage. The LS was mainly designed for students to support their learning experience
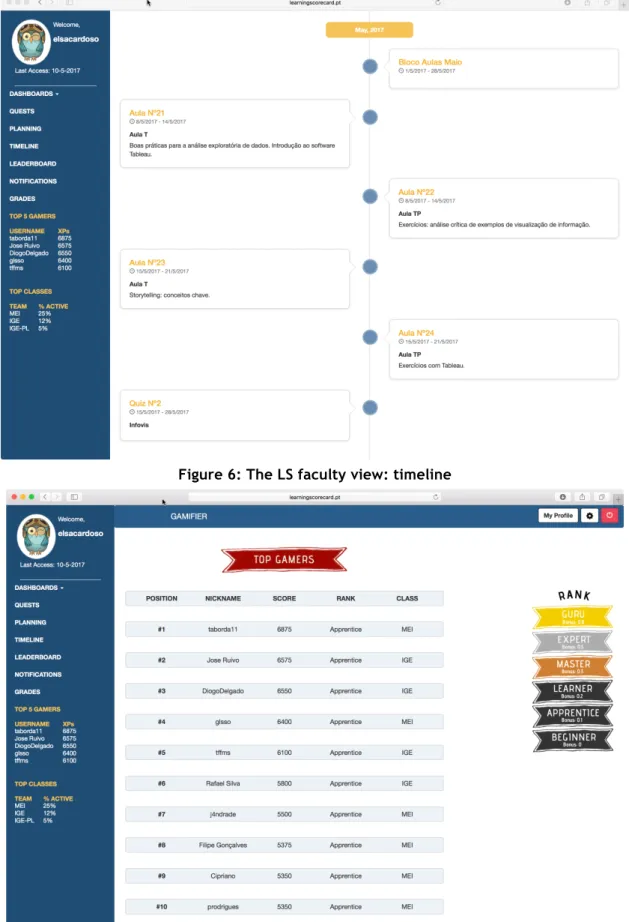
in a course, as such in our perspective, student privacy contributes to the voluntarily use of the platform, removing any fear of faculty observation. Only the student nickname is shared in the leaderboard (see also Figure 7). Figures 2, 3 and 4 were kindly sent by students to the course coordinator for the purpose of documenting the LS usage.
Figure 3: The LS student view: performance visualization (progress analysis)
Figure 4: The LS student view: performance visualization (radar chart)
2.2. The faculty view
The faculty view is an essential part of the LS tool. The initial prototype of the Learning Scorecard only had the student view. The current version of the LS tool has both views implemented. As a result of the implementation of the faculty view some changes were introduced into the student view. In this paper the interfaces related to the student view are from the first version of the tool, whereas the interfaces described in this section belong to the second version of the tool.
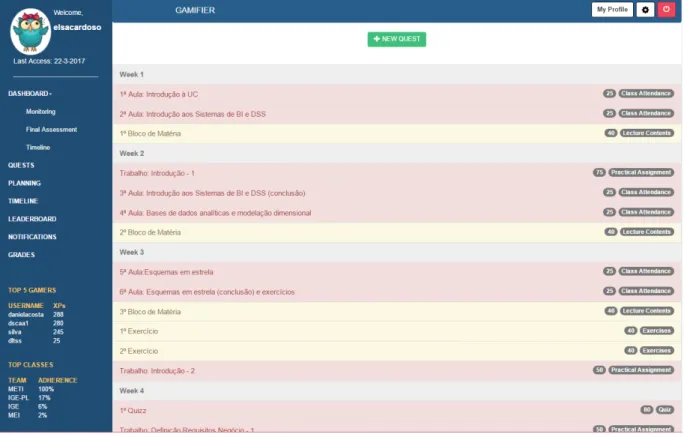
In this view, the course coordinator can increase the communication with the students and customize their learning path. Figure 5 presents the planning functionality, in which the course coordinator can insert the list of quests for the course. This list will be later available in the planning option of the
student view (see the sidebar in Figure 2 for example). Each quest has a type and a number of points that can be awarded. Figure 6 also presents the list of quests but using a timeline format. This is a new functionality, which is also available in the student view. The data displayed in Figure 5 is just test data, whereas Figures 6 and 7 display the current data in the platform.
Figure 5: The LS faculty view: planning of all quests
With the Learning Scorecard the course coordinator can monitor the progress of students in terms of the following dimensions:
• Engagement • Student motivation • Student responsibility • Study optimization • Learning feedback • Student collaboration
The monitoring functionality can be analyzed in average, considering the performance of all students enrolled in the course, or filtered by class. The LS is currently applied to courses that are taught to students of different programs. Hence the idea of using gamification to explore the “natural and healthy” competition among students from programs in related scientific areas.
Engagement is measured by three indicators: percentage of students registered / active / and inactive in the LS. Student motivation is measured by the average number of points (XP). Responsibility is measured by the number of quests performed and the average quest delay. Study optimization is measured by the percentage of completed quests within the course milestones. The learning feedback is calculated in terms of the average grade of the quizzes. Finally, student collaboration is assessed by the number of points awarded in posts submitted to the course’s forum (in the e-learning platform). The faculty view is essential for the validation of quests. Class attendance, forum participation and and practical assignment are evaluated by the course coordinator. Assiduity data is imported from the university academic system. XPs gained through the participation in the course’s forum are introduced at the end of the semester. Each student will earn a percentage of the maximum number of 5000 XP, according to their participation (an excellent performance earns 100% of the forum XPs, a very good performance 80%, good 60%, satisfactory 40% and finally an inactive student receives 0 XP). There are
also extra XP to grab in the forum. Extraordinary posts, that contribute to the collective learning of the class are awarded with 350 XP (each).
Figure 6: The LS faculty view: timeline
3. PROTOTYPE DEVELOPMENT AND EVALUATION
Figure 8 describes the development process of the LS, which began in the Spring semester of the 2015-2016 academic year (more specifically in April 2015-2016). The result of this initial development phase was LS version 1 (v1), only with the student view. This version was tested by an initial group of 110 students in a Data Warehouse course (labelled Course I in Figure 8), lectured in the 2016-2017 fall semester to four different programs. Data was collected from October to December 2016. At the end of this pilot study, students were asked to fill in an online questionnaire to assess student engagement, motivation, and satisfaction with the course and the LS platform. The feedback gathered from these questionnaires was essential to drive the next phase of development, which will be concluded by the end of March 2017. LS version 2 (v2) comprises both the student and faculty views. This new version will be tested in another course (labelled Course II in Figure 8), focusing on Business Intelligence and Data Visualization, which is also taught to students from (three) different programs. The coordinator of both courses is the same, which ensures a continuity in terms of the evaluation of the LS. The second study pilot will occur between April and May 2017. In June 2017, a new round of questionnaires will be sent to students to evaluate the performance of the tool and their perception of the impact of the LS to improve the learning experience.
The real impact of the tool can only be assessed with more case studies and in several academic years. Nevertheless, the impact on student grades will also be studied, in terms of final grades as well as partial grades (e.g., practical assignment and individual test), according to the pedagogic methodologies used in the courses. Taking this aspect into consideration, the initial selection of courses to evaluate the LS has already considered courses with similar pedagogic methodologies.
Figure 8: Learning Scorecard development and evaluation timeline
The LS platform was developed using Node.js. The front-end was developed using HTML and CSS. Javascript, specifically Express.js, was used for the back-end implementation. Several modules were used: Bootstrap, for platform design, Chart.js, for the implementation of the charts in the LS dashboards, Passport and Crypto, for secure authentication of students in the LS. The LS platform also includes a MySQL database.
3.1. LS version 1: feedback from students
At the end of the first pilot, students answered a questionnaire to evaluate the experience. The questionnaire was sent to students enrolled in the Data Warehouse course, and 54 students answered it, accounting for a response rate of 49%. Of these 54 students, only 37 (68.5%) had previously registered in the LS platform. The reasons for not having registered were: lack of time (main reason), and lack of interest or awareness of the platform.
Only 16.2% of students used the platform until the end of the semester, whereas 45.9% used the LS between two and four weeks1. When asked about the reasons why their motivation to use the platform faded, students provided the following feedback: “I missed one quiz and thought that I couldn’t win
the final top 3 rewards, so I gave up…”, lack of time, “lack of motivation after the hacking situation…”, validity of quests was ambiguous. The LS platform was hacked during the first pilot, after only two weeks of being online, and data from quests was lost. As a result of this incident, a significant number of students did not resume their game. The security of the platform was improved, but this issue had a major impact on the number of active students.
Despite the low usage figures, when asked if they enjoyed using an academic platform with gamification, 75% of students answered positively.
The received feedback was crucial to the improvement of the LS platform and the second pilot. Special attention was given to the previous reasons that led to the low adoption of the LS in the first pilot. The reward system was changed: the reward is now available to all gamers in a proportion of the total XP earned, as opposed to a top-3 ranking or podium (see Figure 7).
Another important aspect was the validation of quests. Most of the improvement suggestions received from students was related to the type of quests and their validation in the platform. All the received feedback (44 suggestions) was taken into consideration, which led to a much richer second version of the LS. In this new version of the platform, data input by students has been minimized, and unnecessary quests or quests which could not be objectively validated were deleted (such as the reading of slides or papers). The original mindset and values of the LS platform are: “pursue growth and learning”, “enjoying participation” and “self discipline”, as displayed in the strategy map of Figure 1. Students were supposed to validate only the quests they had actually performed – “self discipline” – only then the LS could be used to monitor their own learning path. However, students didn’t perceive the “self discipline” part, and acted mainly with the reward in mind. With the new reward policy implemented it will be very interesting to see if the students’ behavior will be different in the second pilot experiment of the LS platform, which is currently ongoing.
Notifications have been implemented in the faculty view, so that alerts can be issued when quests are about to end. The usability of the interface was also improved.
When questioned about “how important is student data privacy for your participation as a gamer in
the LS?”, about 42% of students considered it important (33.3%) and very important (8.3%). In contrast,
27.8% considered data privacy not important and 8.3% even said it was totally unimportant. Regarding this issue, there are mixed feelings amongst the students, however, we decided to continue to ensure student data privacy.
Students mentioned that the LS and the e-learning platform should be completely integrated. For some of them, having two platforms was confusing. This is a very important remark. Blackboard is the learning platform used at ISCTE-IUL. All the functionalities that were already available in the e-learning platform were not programmed into the LS, for instance, quizzes and the forum. Regarding quizzes, the grades are imported to the LS, and students are only asked to evaluate the difficulty of the quiz (in a scale of low, medium, high).
4. CONCLUSIONS AND FUTURE WORK
This paper presented a new tool designed to improve the student learning experience, the Learning Scorecard. The LS receives data from the e-learning platform used at the university and the student academic system (for the assiduity data). The e-learning platform is used to run quizzes and specific challenges (such as practical exercises), and also to encourage student collaboration via the course’s forum. The LS was designed to complement the e-learning platform, adding game elements to the student view to increase their motivation and engagement with the learning process. For the course coordinator, the LS provides a comprehensive and customized view of the learning experience of students that significantly extends the current functionalities available in the e-learning platform used in the university.
A lot is planned for future work. Research is being developed in terms of the reward mechanisms integrated with game dynamics, with the purpose of increasing and maintaining the motivation of students to use the tool, and ultimately pursue a better final grade. The goal of the Learning Scorecard is to improve the student learning experience, as a process but also as an outcome. In the future, the LS may also be applied to other courses in different scientific areas, other than Decision Support Systems and Business Intelligence (for instance, in Mathematics and Architecture). The development of a mobile app for the student view is also planned for the next academic year. It is also possible to
generalize the use of the Learning Scorecard to other universities, however, significant development is required. The concept of the LS is very rich; another group of students is currently developing a new module to study academic success and the link to pedagogic practices in courses using data from one program. The original ideal behind the development of the LS was to actively involve students in the learning process, making them aware of the key factors that impact their learning experience in Higher Education. At the same time, the LS platform is also a great example of a business intelligence and learning analytics application, attempting to measure and manage indicators of the learning process, which is something that students can relate to.
5. REFERENCES
Cardoso, E., Santos, D., Costa, D., Caçador, F., Antunes, A., Parada, R. (2016) Learning Scorecard: Monitor and Foster Student Learning through Gamification. 2nd International Workshop on Educational Knowledge Management, Italy, CEUR Workshop Proceedings, Vol-1780, 39-50
Deterding, S., Dixon, D., Khaled, R., Nacke, L. (2011) From Game Design Elements to Gamefulness: Defining “Gamification”. 15th International Academic MindTrek Conference, Finland
Dicheva, D., Dichev, C., Agre, G., Angelova, G. (2015) Gamification in Education: a systematic mapping study. Educational Technology & Society, 18(3), 75-88
Long, P., Siemens, G. (2011) Penetrating the fog: Analytics in learning and education. Educause Review, 46(5), 31-40
6. AUTHORS’ BIOGRAPHIES
Prof. Dr. Elsa Cardoso. Assistant Professor, Director of the Master in
Integrated Business Intelligence Systems at Instituto Universitário de Lisboa (ISCTE-IUL), Portugal, and leader of the Business Intelligence Task Force of EUNIS (European University Information Systems organization). She is also a researcher at the Information and Decision Support Systems Group of INESC-ID Lisboa, Portugal. She has a PhD in Information Science and Technology, with a specialization in Business Intelligence. Her research interests include business intelligence and data warehousing, data visualization, big data analytics, performance management, balanced scorecard, applied to Higher Education and Healthcare.
https://pt.linkedin.com/in/elsa-cardoso-88092215
Daniela Costa is a graduate student of the Master program in Computer
Science Engineering at Instituto Universitário de Lisboa (ISCTE-IUL), with a specialization in Information and Knowledge Management Systems. She has an undergraduate degree in Computer Science Engineering (2015) also from ISCTE-IUL. Her research interests are business intelligence and data mining.
Diogo Santos is a graduate student of the Master program in Computer
Science Engineering at Instituto Universitário de Lisboa (ISCTE-IUL), with a specialization in Information and Knowledge Management Systems. He has an undergraduate degree in Computer Science Engineering (2015) also from ISCTE-IUL. His research interests include business intelligence and gamification.