thinning in yield control
and its effects on quality
of the grapes and wine
composition in cv. Baga
(Vitis vinifera L.)
Hugo Alexandre Dias Ferreira de
Oliveira e Silva
Tese de Doutoramento apresentada à
Faculdade de Ciências da Universidade do Porto
Ciências Agrárias
2018
Orientador
Prof. Doutor Jorge Bernardo Lacerda de Queiroz
Faculdade de Ciências da Universidade do Porto
Coorientador
Doutora Maria Paula do Amaral Alegria Guedes de Pinho
Faculdade de Farmácia da Universidade do Porto
Dissertação submetida à Faculdade de Ciências da Universidade do Porto para a obtenção do grau de Doutor em Ciências Agrárias
Alternatives to bunch thinning in yield control
and its effects on quality of the grapes and
wine composition in cv. Baga (Vitis vinifera L.)
Métodos alternativos à monda de frutos no controlo do
rendimento e gestão da qualidade da uva e do vinho, na
casta Baga (Vitis vinifera L.)
Acknowledgements
To Professor Doctor Jorge Queiroz, my supervisor, for all the support, enthusiasm that always engaged on my work, and for all the interesting and insightful discussions about viticulture and wines.
To Doctor Paula Guedes de Pinho, my co-supervisor, for the support with study of the aromatic component of the wine samples, and for all the objectivity, advices and challenges that proposed to me.
To Vinhos Messias S.A., Dr. Manuel Messias in particular, for the institutional collaboration during the work, for the support without which it would be impossible to carry out the project and also for the assistance provided by many of its employees.
To Engineer Manuel António, for the suggestions that gave me during the course of the study, the awareness that always showed to the progress of the project, for the clarity that always have concern the company's vision, and the availability to help in this work.
To Doctor Nathalie Moreira, for performing the flavour compounds quantification and for the help on understanding them.
To SAPEC Portugal Lda., to Engineer António Guerra, to Engineer Lília Rodrigues and to Engineer Luís Silva for sharing ideas, thoughts and experiences related to the usage of Ascophyllum nodosum and for supplying product to be used in vineyard.
To Dr. Moisés Couto and Dr. Sandrine Pires, for the help in vineyard tasks, in dealing with all the problems that emerged from the tasks, for sharing ideas, which enabled least painful advances with the tasks in hand.
To my Father, for helping to see and feel that scientific knowledge will be wasted if it is not positioned into reality, giving me the wine business perspective of the study.
To my Mother, for all the help in vineyard work and the fermentation control, for the understanding and sympathy placed during the execution of the studied tasks, which increased my admiration of her.
Last, a deep and most grateful thank to Margarida Dias, for the motivation that gave to me, for the help with all stages of the work, for understanding what it takes to do the work needed to complete this degree, and for sharing and living my dreams!
Publications
Silva HO, Baptista M, Guedes de Pinho P, Queiroz J. Double Maturation Raisonnée: effects on quality of grapes and wine composition in cv. Baga (Vitis vinifera L.). Double Maturation Raisonnée: Effets sur la qualité des raisins et la composition du vin de cv. Baga (Vitis vinifera L.). Proceedings 20th International Symposium GiESCO. Mendoza. 2017.
Silva HO, Baptista M, Moreira N, Guedes de Pinho P, Queiroz J. Three-year study of yield control methods and its effects on quality of the grapes and wine composition - cv. Baga (Vitis Vinifera L.). Proceedings of the 10th International Congress of Vitivinicultural Terroirs, Tokaj, 2014.
Silva HO, Baptista M, Guedes de Pinho P, Queiroz J. Alternatives to bunch thinning in yield control and its effects on quality of the grapes and wine composition in cv. Baga (Vitis vinifera L). Alternative à l‟eclaircissage des grapes pour le controle du rendement et ses effets sur la qualité des raisins et du vin, cv. Baga (Vitis vinifera L). Proceedings 18th International Symposium GiESCO (Porto), Ciência Téc. Vitiv. 2013; 28: 436-440.
Queiroz J, Silva HO, Baptista M, Baptista M, Guedes de Pinho P. Alternatives to bunch thinning in yield control and its effects on quality of the grapes and wine composition in cv. Baga (Vitis vinifera L). Proceedings of the 9th International Congress of Vitivinicultural Terroirs, Dijon-Reims, 2012: 6. 49-52.
Abstract and keywords
As it happens with other grape varieties, Baga is prone to high productivity and also to rot, due to the production of compact clusters and thin skin berries. The occurrence of some diseases and excessive productivity are frequently associated, and therefore, yield control is an important issue. Fruit thinning and the application of growth regulators do not produce intended effects, revealing inconsistencies, technical difficulties to implement and high costs. Manual cluster thinning is time-consuming and chemical thinning is difficult to control, yielding random results depending on variety, phenological status and dosage of the used chemicals.
A three-year study was carried out, testing the production control techniques "early severe leaf removal" (manual and mechanical, MAD and MED, respectively), "Double Maturation Raisonnée" (DMR) and "manual bunch thinning" (MBT).
The objective of this work was to compare the effects of MAD, MED, DMR and MBT as methods of yield control and to demonstrate their individual effects on Baga variety, quality of grapes, musts and resulting wines. Using MAD, the first six basal leaves were removed at flowering, while MED was performed using the leaf removal machine in the fruiting zone on both sides of the vine at the same period. MBT was performed at veraison, limiting one bunch per shoot. DMR was performed 15 days before harvest, leaving shoots and bunches hanging on the wires.
A randomized complete block design with four replications was used.
The results reflected some influence of the different climatic conditions over the effects of each method studied on three harvests. However, some tendencies could be found: the techniques studied decrease vine yield; MAD, MED, DMR and MBT showed successfully lower yields; MAD, MED and DMR showed lower incidence of rot and cluster compactness, as well as some improvements in the composition of the must (something not presented in MBT); the wines produced with DMR and MED presented good sensorial quality, similar or superior to the used commercial References, while wines produced under MAD and MBT conditions presented superior results compared to Control (CTR) but not to the References; MED proved to be a lower-cost alternative to the other methods.
Keywords: Yield; Quality; Bunch Thinning; „Double Maturation Raisonnée‟; Early
Resumo e Palavras-chave
Tal como ocorre com outras variedades de uva, a casta Baga é propensa a produtividade elevada e também à podridão, devido a produzir cachos compactos e bagos de película fina. A ocorrência de algumas doenças e produtividade excessiva estão frequentemente associadas, sendo, por isso, o controle de rendimento uma questão importante. A monda de cachos e aplicação de reguladores de crescimento não produzem os efeitos pretendidos, revelando inconsistências, dificuldades técnicas de implementação e custos elevados. A monda manual é demorada e a monda química é difícil de controlar, produzindo resultados aleatórios dependendo da variedade, estado fenológico e de dosagem dos químicos usados.
Foi realizado um estudo de três anos, testando as técnicas de controlo de produção "desfolha precoce severa" (manual e mecânica, MAD e MED), "Double Maturation Raisonnée" (DMR) e a “monda de cachos manual” (MBT).
O objetivo deste trabalho foi comparar os efeitos destas técnicas MAD, MED, DMR e MBT como métodos de controle de rendimento e demonstrar os seus efeitos sobre qualidade das uvas, mostos e vinhos da casta Baga. Utilizando MAD, as primeiras seis folhas basais foram removidas à floração, enquanto que MED foi realizada utilizando a máquina de desfolha na zona de frutificação em ambos os lados da videira no mesmo período. MBT foi realizada na fase do “pintor”, limitando um cacho por pâmpano. A técnica DMR foi realizada 15 dias antes da colheita, deixando varas e cachos pendurados nos arames. Foi utilizado o delineamento experimental de blocos ao acaso (aleatório), com quatro repetições.
Os resultados obtidos, sobre os efeitos de cada um dos métodos em estudo, foram influenciados, em certa medida, pelas diferentes condições climáticas das 3 colheitas. No entanto, algumas tendências podem ser encontradas: as técnicas estudadas fizeram diminuir a produtividade da videira; tendo a MAD, MED, DMR e MBT mostrado menores rendimentos; a utilização das técnicas MAD, MED e DMR resultou numa menor incidência de podridão e compacidade do cacho, e em algumas melhorias na composição do mosto (algo não apresentado por MBT); os vinhos produzidos com uvas sujeitas às técnicas de DMR e MED apresentaram boa qualidade sensorial, similar ou superior às Referências comerciaisutilizadas, enquanto as obtidas pelas técnicas de MAD e MBT apresentaram resultados superiores ao CTR mas não às Referências; a técnica de MED revelou ser uma alternativa de menor custo aos outros métodos.
Palavras-chave: Produção; Qualidade; Monda de cachos; „Double Maturation
Index
Table of Contents
Acknowledgements ... v
Publications ...vi
Abstract and keywords ... vii
Resumo e Palavras-chave ... viii
Index ... ix
Table list ... xii
Figure list ... xvi
Abbreviations ... xviii
Preamble ... xx
I Overview ... 1
II Yield control techniques and wine quality ... 11
2.1 Reproductive cycle of the vine ... 11
2.2 Microclimate and canopy management ... 13
2.3 Wine quality and grape composition ... 16
2.3.1 Grape composition and berry development ... 17
2.3.2. Carotenes and chlorophyls ... 20
2.3.3 Aroma compound composition... 21
2.3.4 Composition of Baga grapes and wines ... 33
2.4 Yield control techniques ... 35
III Material and Methods ... 44
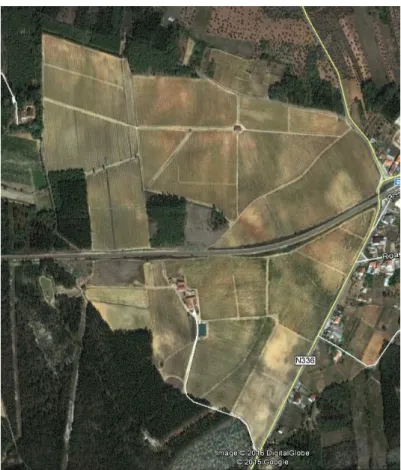
3.1 Location and description of vineyard ... 44
3.2 Climate description ... 47
3.3 Experimental design ... 50
3.4 Methods and quantifications ... 51
3.4.1. Pruning ... 51
3.4.2. Canopy management ... 51
3.4.3. Leaf removal ... 52
3.4.4. Manual Bunch Thinning (MBT) ... 54
3.4.5. ‘Double Maturation Raisonnée’ (DMR) ... 54
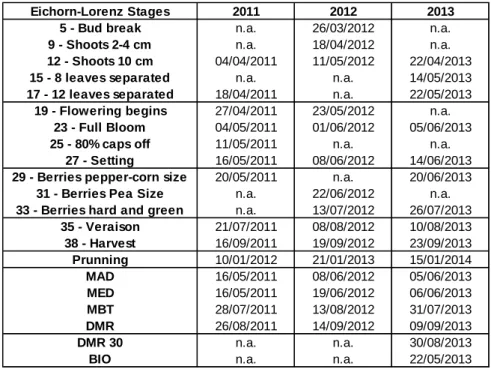
3.4.7 Timelines ... 56
3.4.8. Canopy assessment ... 56
3.4.9. Yield components ... 58
3.4.10. Micro-fermentations ... 61
3.5 Chemical analysis of wines produced ... 62
3.6 Carotenoids quantification in berry skins ... 62
3.7 Aromatic description of wines produced ... 63
3.7.1 Short chemical and sensorial description of quantified compounds ... 64
3.8 Sensorial analysis of wines produced... 66
3.9 Statistical Analysis ... 66
IV Viticulture studies - Results and discussion ... 68
4.1 Introduction... 68
4.2 Weather characterization ... 69
4.3 Canopy characterization and early leaf removal... 72
4.4 Yield components ... 76
4.4.1 Bud break and Fertility ... 76
4.4.2 Fruit set ... 78
4.4.3 Cluster morphology ... 80
4.4.4 Berry components ... 82
4.4.5 Yield ... 85
4.4.6 Vegetative expression and vigour ... 87
4.4.7 Fruit properties and quality... 88
4.4 Principal components analysis ... 96
V Carotenoids and chlorophylls - Results and discussion ... 106
5.1 Introduction... 106
5.1 Carotenoid and chlorophylls content ... 107
5.3 Principal components analysis ... 113
VI Aroma composition of Baga wines - Results and discussion ... 119
6.1 Introduction... 119
6.2 Aromatic compound content ... 120
6.2 Odour Activity Values (OAV). Baga varietal aroma compounds ... 132
6.3 Principal components analysis ... 137
VII Wine tasting and wine quality ... 141
7.2 Principal components analysis (PCA) ... 147
VIII Broad perspective over results and wine quality... 151
IX Conclusions and Final Remarks ... 158
Table list
Table 1 - Wine production for 2012-16 (Source: Adapted from OIV, 2017 [1]). ... 2 Table 2 - Most common grape varieties planted (in hectares, Source: Adapted from IVV, 2015 [2]). ... 4
Table 3 - Planted vine areas per Portuguese region (Source: Adapted from IVV, 2015 [2]). ... 4 Table 4 - Most planted varieties in Portugal in 2014 (Source: IVV, 2015 [2]). ... 5 Table 5 - Wine production in Portugal in 2014 per region (Source: IVV, 2015 [2]). ... 6 Table 6 - Evolution of wine production in Portugal per region 2004-14 (Source: IVV, 2015 [2]). ... 6 Table 7 - Evolution of wine production in European Union (Source: IVV, 2015 [2]). ... 7 Table 8 - Comparison of Portuguese wine production with other countries (Source: IVV, 2015 [2]). ... 7
Table 9 - Climate description of the vineyard region for 2011 - 2013 vintages (data from Coimbra). ... 48
Table 10 - Climate description of the vineyard region for 1959-88 (data from Coimbra). ... 49
Table 11 - Randomized blocks experimental design for all modalities, conducted in experimental vineyard Baga in 2011, 2012 and 2013 vintages. ... 50
Table 12 - Dates for each activity and vegetative evolution for 2011 - 2013 vintages. ... 56
Table 13 - Compounds quantified by SPME-GC-MS method, odour descriptors, odorant series and odour threshold. ... 65 Table 14 - Climate description, using several bioclimatic indexes, of the vineyard region for 2011 - 2013 vintages. ... 69 Table 15 - Days in difference between vegetative stages and/or modality activities. ... 70
Table 16 - Canopy description for 2011, 2012 and 2013 vintages and exposed canopy surface - height and width, determined using 40 vines per modality. Average values and standard deviation (between brackets). ... 72
Table 17 - Modality influence over leaf area, for 2011, 2012 and 2013 vintages, determined using 12 marked vines and shoots per modality. Average values and standard deviation (between brackets). ... 73 Table 18 - Canopy description and plant vigour expression at veraison, using Point Quadrat Analysis - 2011, 2012 and 2013 vintages, determined using 12 marked vines and shoots per modality. Average values and standard deviation (between brackets).74
Table 19 - Canopy description and light environment characterization at veraison, using Point Quadrat Analysis - 2011, 2012 and 2013 vintages, determined using 12 marked vines and shoots per modality. Average values and standard deviation (between brackets). ... 75
Table 20 - Modality influence over bud number, shoot number and bunch number per vine, for 2011, 2012 and 2013 vintages, determined using 12 marked vines and shoots per modality. Average values and standard deviation (between brackets). ... 76
Table 21 - Modality influence over Bud break and Potential fertility indexes, for 2011, 2012 and 2013 vintages, determined using 12 marked vines and shoots per modality. Average values and standard deviation (between brackets). ... 77 Table 22 - Modality influence over Flower and Berry number, Fruit set ratio, and berry number ration between CTR and each modality, for 2011, 2012 and 2013 vintages, determined using 12 marked vines and shoots per modality. Average values and standard deviation (between brackets). ... 79 Table 23 - Modality influence over basal cluster morphology - cluster and berry weight, and compactness, for 2011, 2012 and 2013 vintages, determined using 12 marked clusters per modality. Average values and standard deviation (between brackets). ... 81 Table 24 - Averages values for modality influence over berry components - berry, pulp, skin and seed weight, skin/pulp ration, berry diameter and number of seeds per berry, for 2011, 2012 and 2013 vintages, determined using samples from 12 marked clusters per modality. ... 83
Table 25 - Modality to CTR ratio for each modality influence over berry components - berry, pulp, skin and seed weight, skin/pulp ration, berry diameter and number of seeds per berry, for 2011, 2012 and 2013 vintages, determined using 12 marked clusters per modality. ... 84
Table 26 - Modality influence over yield per vine and average cluster weight, for 2011, 2012 and 2013 vintages, determined using samples from 12 marked clusters per modality. Average values and standard deviation (between brackets). ... 85 Table 27 - Modality influence over yield and yield per hectare, for 2011, 2012 and 2013 vintages, determined using samples from 12 marked clusters per modality. ... 86 Table 28 - Modality influence over yield, leaf area yield ratio and corrected leaf area yield ratio, for 2011, 2012 and 2013 vintages, determined using samples from 12 marked clusters per modality. Average values and standard deviation (between brackets). ... 87
Table 29 - Modality influence over pruning weight and Ravaz index, for 2011, 2012 and 2013 vintages, determined using samples from 12 marked clusters per modality. Average values and standard deviation (between brackets). ... 88 Table 30 - Modality influence over grape ripening - must soluble solids, pH and titratable acidity (TA), for 2011, 2012 and 2013 vintages, determined using 200 berries samples from marked clusters. ... 89 Table 31 - Linear regression parameters between modality and GDD over grape ripening - must soluble solids, pH and titratable acidity (TA), for 2011, 2012 and 2013 vintages, determined using 200 berries samples from marked clusters. ... 90
Table 32 - Modality influence over cluster compactness and Botrytis incidence, for 2011, 2012 and 2013 vintages, determined using samples from 12 marked clusters per modality. Average values and standard deviation (between brackets). ... 91 Table 33 - Modality influence over must quality - berry weight and volume, soluble solids, pH and titratable acidity (TA), probable alcohol and sugar load per berry for 2011, 2012 and 2013 vintages, determined using 200 berries samples from marked clusters. ... 93 Table 34 - Modality influence over wine quality - colour intensity (CI), anthocyanins concentration and per berry, total phenolics index (TPI) and HCl index for 2011, 2012 and 2013 vintages, determined using 200 berries samples from marked clusters. ... 94 Table 35 - Carotenoid and chlorophylls content per berry, for 2011, 2012 and 2013 vintages Average values and standard error (between brackets). ... 108
Table 36 - Carotenoid and chlorophylls content per dry weight of skin, for 2011, 2012 and 2013 vintages. Average values and standard error (between brackets). ... 110 Table 37 - Compounds quantified by SPME-GC-MS method, odour descriptors, odorant series and odour threshold. ... 121 Table 38 - Ester content of the wines per modality, for 2011, 2012 and 2013 vintages. Average concentration values and standard deviation (between brackets). 123 Table 39 - Esters content of the wines per modality, for 2011, 2012 and 2013 vintages. Average chromatographic area values and standard deviation (between brackets). ... 125
Table 40 - Terpene and terpene derivatives content of the wines per modality, for 2011, 2012 and 2013 vintages. Average concentration values and standard deviation (between brackets). ... 127 Table 41 - Terpenes content of the wines per modality, for 2011, 2012 and 2013 vintages. Average chromatographic area values and standard deviation (between brackets). ... 129
Table 42 - Several classes of compounds content of the wines per modality, for 2011, 2012 and 2013 vintages. Average concentration values and standard deviation (between brackets). ... 130 Table 43 - Several classes of compounds content of the wines per modality, for 2011, 2012 and 2013 vintages. Average chromatographic area values and standard deviation (between brackets). ... 131 Table 44 - Odour activity values (OAV) for esters of the wines per modality, for 2011, 2012 and 2013 vintages and for commercially obtained wine references. Average values. ... 133
Table 45 - Odour activity values (OAV) for Terpenes of the wines per modality, for 2011, 2012 and 2013 vintages and for commercially obtained wine references. Average values. ... 134 Table 46 - Odour activity values (OAV) for several classes of compounds of the wines per modality, for 2011, 2012 and 2013 vintages and for commercially obtained wine references. Average values. ... 135
Table 47 - Overall Sensorial analysis for wines of 2011, 2012 and 2013 vintages, and references. Average scores. ... 142
Table 48 - Scores from selected descriptors. Average sensorial analysis scores for wines by modality and vintages, and all Baga commercial wine references. ... 143
Figure list
Figure 1 - World wine consumption, expressed in millions of hectolitres (Source:
OIV, 2017 [1]). ... 2
Figure 2 - Evolution of planted vines area (Source: OIV, 2017 [1]). ... 3
Figure 3 – Grapevine two-year lifecycle, according to Watt et al [14] - adapted for southern hemisphere. ... 12
Figure 4 - Berry growth phases (adapted from James Kennedy) []. ... 18
Figure 5 - „Quinta do Valdoeiro‟ vineyard (Vacariça, Mealhada). Aerial photo from Google maps. ... 44
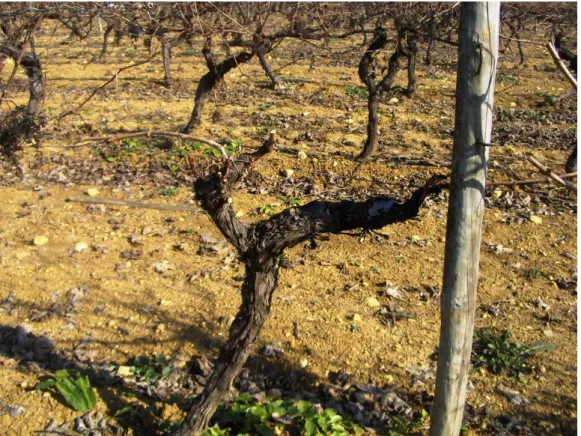
Figure 6 - „Quinta do Valdoeiro‟ vineyard, with Baga in the foreground, with the markings of the experimental plot (Vacariça, Mealhada). ... 45
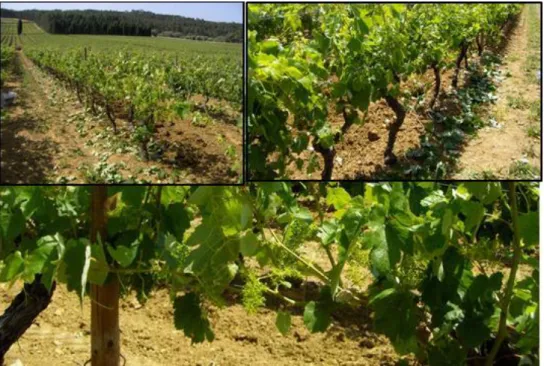
Figure 7 - Baga in Double Guyot, experimental plot (Vacariça, Mealhada). ... 46
Figure 8 - MAD - Manual leaf removal and vines after MAD. ... 53
Figure 9 - MED - Mechanical leaf removal and vines after MED. ... 53
Figure 10 - MBT – Manual bunch thinning and vines after MBT. ... 54
Figure 11 - DMR - Double maturation raisonnée and shoots after DMR. ... 55
Figure 12 - PQA measurement spots. ... 57
Figure 13 - Basal cluster photograph for flower number determination. ... 59
Figure 14 - Ripening assessment. ... 61
Figure 15 - Linear regression between cluster visible flowers of the photograph and the actual number of flowers, used to estimate marked cluster number of flowers. ... 78
Figure 16 - Principal components analysis (PCA) Scores and Loadings Biplot of viticultural variables and modalities (PC1 46%; PC2 17% of explained variance). ... 98
Figure 17 - Principal components analysis (PCA) Scores and Loadings Biplot of viticultural variables and modalities (PC1 46%; PC3 12% of explained variance). ... 99
Figure 18 - Principal components analysis (PCA) Scores and Loadings Biplot of Berry components and modalities (PC1 72%; PC2 13% of explained variance). ... 101
Figure 19 - Principal components analysis (PCA) Scores and Loadings Biplot of Berry components and modalities (PC1 72%; PC3 09% of explained variance). ... 102
Figure 20 - Principal components analysis (PCA) Scores and Loadings Biplot of ripening variables and modalities (PC1 67%; PC2 15% of explained variance)... 104
Figure 21 - Principal components analysis (PCA) Scores and Loadings Biplot of ripening variables and modalities (PC1 67%; PC3 8% of explained variance). ... 105
Figure 22 - Principal components analysis (PCA) Scores and Loadings Biplot of carotenoid content per berry variables and modalities (PC1 60%; PC2 26% of explained variance). ... 114
Figure 23 - Principal components analysis (PCA) Scores and Loadings Biplot of carotenoid content per berry variables and modalities (PC1 60%; PC3 12% of explained variance). ... 115 Figure 24 - Principal components analysis (PCA) Scores and Loadings Biplot of carotenoid concentration variables and modalities (PC1 49%; PC2 39% of explained variance). ... 117 Figure 25 - Principal components analysis (PCA) Scores and Loadings Biplot of carotenoid concentration variables and modalities (PC1 49%; PC3 11% of explained variance). ... 118
Figure 26 - Principal components analysis (PCA) Scores and Loadings Biplot of aromatic compounds concentration variables and modalities (PC1 35%; PC2 16% of explained variance). ... 138 Figure 27 - Principal components analysis (PCA) Scores and Loadings Biplot of aromatic compounds concentration variables and modalities (PC1 35%; PC3 14% of explained variance). ... 140
Figure 28 - Average sensorial analysis scores from selected descriptors, for wines by modality and references. ... 145
Figure 29 - Average sensorial analysis scores, from selected descriptors, for wines by vintage and references. ... 146 Figure 30 - Principal components analysis (PCA) Scores and Loadings Biplot of sensorial evaluation variables and modalities (PC1 33%; PC2 17% of explained variance). ... 148
Figure 31 - Principal components analysis (PCA) Scores and Loadings Biplot of sensorial evaluation variables and modalities (PC1 33%; PC2 16% of explained variance). ... 149 Figure 32 - Principal components analysis (PCA) Scores and Loadings Biplot of impact variables and modalities (PC1 43%; PC2 17% of explained variance). ... 153 Figure 33 - Principal components analysis (PCA) Scores and Loadings Biplot of impact variables and modalities (PC1 43%; PC3 10% of explained variance). ... 154 Figure 34 - Principal components analysis (PCA) Scores and Loadings Biplot of impact variables and modalities (PC1 43%; PC4 7% of explained variance). ... 155
Abbreviations
3MH - 3-mercaptohexanol 3MHA - 3-mercaptohexylacetate 4-EG - 4-ethylguaiacol 4-EP - 4-ethylphenol 4MMP - 4-mercapto-4-methylpentan-2-one 4-MMPOH - 4-mercapto-4-methylpentan-2-ol ABA - Abscisic acidBIO - Bio stimulant modality, Ascophyllum Nodosum CBW - Canopy bottom width
CEPA - 2-Chloroethylphoshonic acid CH - Canopy height
CSA - Canopy surface area CTP - Canopy top width CTR - Control modality
DMR - „Double Maturation Raisonnée‟ modality
DMR30 - „Double Maturation Raisonnée‟ of 30 days modality DOC - Denominação de origem controlada
DOP - Denominação de origem protegida
E-L stage - Eichhorn Lorentz vegetative growth stages ELS - Exposed leaf surface
ETO - Reference evapotranspiration
EU - European Union FVT - Free volatile terpenes GA - Gibberellic acid
GC-MS - Gas chromatography-mass spectrometry GDC - Geneva double curtain
GDD - Growing-degree days ha - Hectare
HCl index - Hydrochloric acid index hL - Hectolitres
HS-SPME - Head-space Solid phase microexctraction IBMP - 2-methoxy-3-isobutylpyrazine
IPMP - 2-methoxy-3-isopropylpyrazine LA - Leaf area
LLN - Leaf layer number LN - Leaf number
MAD - Manual Early Leaf Removal modality
MBT - Manual Bunch Thinning/ Manual Cluster Thinning modality MED - Mechanical Early Leaf Removal modality
MhL - Millions of hectolitres MPa - Mega Pascal
NAA - Alpha-naphtaleneacetic acid OAV - Odour activity value
PAR - Photosynthetically active radiation. PC - Principal component
PCA - Principal component analysis PQA - Point Quadrat Analysis PTI - Potential Fertility Index PVT - Potentially-volatile terpenes r - Linear regression coefficient RDI - Regulated deficit irrigation
SBMP - 2-methoxy-3-sec-butylpyrazine (3-sec-isobutyl 2-methoxypyrazine) SPME - Solid-phase microextraction
T - Temperature TA - Titratable Acidity
TDN - 1,6-trimethyl-1,2-dihydronaphthalene TPB - (E)-1-(2,3,6-trimethylphenyl)buta-1,3-diene TPI - Total Polyphenol index
UV - Ultraviolet radiation
VAZ - Violaxanthin, antheraxanthin, zeaxanthin pool VSP - Vertical shoot positioning
%IC - Percentage of internal clusters %IL - Percentage of interior leaves
Preamble
During the implementation of the work, the evaluation of results and the writing itself, I was continually rushed with doubt about the focus of this dissertation, the guiding principle, the juice that will nourish the knowledge of Baga, Bairrada region and Viticulture.
My closest family‟s life has been linked to the wine throughout my life. Since young age, I kept hearing discomfortable ideas about Bairrada and Baga, like both were united in a “Siamese connection”: harsh, unexplained, undrinkable, retrograde and somehow exciting. These images were being cemented, my “knowledge” kept being nurtured based in third-party thoughts but always unfounded and inexperienced, without having the opportunity to be confronted with the question and being clarified.
During a complete decade, I discovered wine, wine styles, wine regions, grape varieties, vineyards, wineries, techniques and methodologies… and Baga remained unclear and undiscovered. After having accomplished some stages of academic training, with the wine always in the background (a journey made on the contrary, starting discovering the final product and walking backwards on the production chain), I finally decided that I should learn more about the „origin of everything‟: grapevine and grapes. The Universe somehow pushed me to Bairrada, to the “damned” and misunderstood Baga!
It has been a pleasure to work and to meet a grape variety who most seem to reject, seeming like the 'outcast' of Portuguese grape varieties; getting to know a being with closed nature, bad-tempered, capricious, but that is also generous for those who devote time, attention and patience. Fortunately, my relationship with the 'friend' Baga did not ended after this work - I am fortunate to work professionally with Baga, in Bairrada, in vineyards over 60 years old, with other trellising, with other motivations, but always generous.
Finally, I tried to focus not only on numbers to support science but also in individual perception of wine; after all, grape quality and wine quality are not easily or fully explained by numbers and figures or translated into scientific writing.
I Overview
Grape and wine productions play a central role in Western society, today and also in the past. They have an important influence in several aspects of the society, such as economic, social, religious and intellectual.
Both grape and wine productions are economically important, particularly in the Mediterranean basin, and are also money-rewarding agricultural activities (when comparing with other agricultural productions). Beside these aspects, they are not accessible to everyone due to legal restrictions of vine plantation, of wine production and of wine commercialization, and also because they demand extensive knowledge and dedicated care.
Socially, wine is a beverage associated with key events like celebrations and agreement/pact/document signings, traditionally is used as distinguished offer, socially assumed to be associated with gentlemen behaviour, and some vine/wine expressions are popularly used with noble meanings.
Wine plays an important role in religion, frequently entitled „the nectar of the Gods‟ and also as „The blood of Christ‟ for the Christians.
Intellectually, wine is associated with intellectual beings, with reflection about life, with humanity and respect among men.
The great impact of wine in the History of Mankind explains the fact that we can find vines planted in almost every country of the planet.
According to „Organisation Internationale de la Vigne et du Vin‟ (OIV) data from 2017 [1], 267 million hectolitres (MhL) of wine were produced worldwide in 2016 (Table 1), with more than 80% of this volume being produced by only ten countries. Wine consumption worldwide has maintained near to 240 MhL per year, a constant trend since 2009 (Figure 1). Combining both data, it is clear that the problem of wine surplus is a current and global issue and it also highlights the need for an increased and urgent adaptation of the wine industry to the demand preferences. Data also shows that this reduction of global consumption is fairly related to the effects of the 2008 world economic crisis [1]. Finally, another feature of the data is the declining of wine production, and also consumption, in traditional wine producing countries, while it is increasing in the northern European countries and others, such as China and Australia (China is expanding the vine plantings surface, the volumes of wine production and the national consumption of wine are concomitantly increasing).
Table 1 - Wine production for 2012-16 (Source: Adapted from OIV, 2017 [1]).
Apart from the wine consumed, a substantial percentage of the wine produced is used as a by-product for other derivatives‟ wine associated products such as vinegars, distilled beverages, culinary sauces, etc. These data are usually missing in most of the global annual statistics so it is difficult to have a clear and overall vision about the wine production/consumption ratios. Objectively, the hypothesis that these sources of wine consumption would absorb the surplus of wine production in some years cannot be disregarded - this would explain why the global wine production is not dropping sharply as one would predict after successive years of wine surplus scenario.
Nevertheless, this would not happen in all years.
Figure 1 - World wine consumption, expressed in millions of hectolitres (Source: OIV, 2017 [1]).
Concerning the cultivated area with vines (Figure 2), it was over 7.5 million hectares (Mha) worldwide. The area had been increasing since 2011, the year of the lowest
Italy 45.6 54.0 44.2 50.0 50.9 0.9 2 France 41.5 42.1 46.5 47.0 43.5 -3.5 -7 Spain 31.1 45.3 39.5 37.7 39.3 1.7 4 USA 21.7 24.4 23.1 21.7 23.9 2.2 10 Australia 12.3 12.3 11.9 11.9 13.0 1.1 9 China 13.5 11.8 11.6 11.5 11.4 -0.1 -1 South Africa 10.6 11.0 11.5 11.2 10.5 -0.7 -6 Chile 12.6 12.8 10.0 12.9 10.1 -2.7 -21 Argentina 11.8 15.0 15.2 13.4 9.4 -3.9 -29 Germany 9.0 8.4 9.2 8.9 9.0 0.1 1 Portugal 6.3 6.2 6.2 7.0 6.0 -1.0 -15 Russia 6.2 5.3 4.9 5.6 5.6 0.0 0 Romania 3.3 5.1 3.7 3.5 3.3 -0.3 -8 New Zealand 1.9 2.5 3.2 2.3 3.1 0.8 34 Greece 3.1 3.3 2.8 2.5 2.6 0.0 2 Serbia 2.2 2.3 2.3 2.3 2.3 0.0 0 Austria 2.1 2.4 2.0 2.3 2.0 -0.3 -14
World Total (OIV) 258 290 270 276 267 -9 -3
2016 2016/15 Var.
Volume
2016/2015 Var %
value between 2000 and the present; Europe had the biggest relative reduction, almost 10 percentual points but still represents an absolute decrease of 17% in cultivated area - the OIV report [1] noticed that this decrease was the consequence of the abandonment of vineyards. In contrast, Asia has significantly increased its vineyard area. Again, it is difficult to explain the global increase in vineyard area (excluding Europe) when there is a global surplus in wine production.
Figure 2 - Evolution of planted vines area (Source: OIV, 2017 [1]).
Another important feature that should be pointed out is that a substantial proportion of the wine produced globally is from a very limited number of varieties - 10 varieties represent close to 26% of the global planted area [2] (Table 2). The use of these more common and vastly planted grape varieties can bring, in the first years, some commercial impact for a new producer - it will attract the attention of variety-driven wine consumers; but, just after a few years in the business and if nothing other than the grape variety is added to the production (like branding, new products, new varieties, new wine styles, marketing and advertising), the attention brought by the varietal wines tend to abruptly disappear, because the consumer choice was only motivated by a feature that is not exclusive to that particular wine producer - the grape variety. The massive global offering of wine from these ten varieties, combined with a wine surplus scenario, can result in increased difficulties for all sorts of wine producing entities, regardless the country of origin or their size: cooperatives, very large producers, large and medium producers, small producers and boutique wineries.
In order to avoid economical unbalances, single countries and multi-country trade organizations are constantly establishing new regulations for the wine industry, acting specifically in limiting production and tightening quality standards - yield control and
quality assurance are important tools in the legally restricted nonetheless vast wine business world.
Table 2 - Most common grape varieties planted (in hectares, Source: Adapted from IVV, 2015 [2]).
Portugal‟s wine context is similar to the rest of the Europe: according to 2014 data from “Instituto da Vinha e do Vinho” (IVV) [2]
, there were 218 677 ha of vines planted, from each there were 79 573 ha of vines/vineyards with “Denominação de Origem Protegida” (DOP) certification (Table 3), that means “Protected Designation of Origin” or “Protected Geographic Indication”.
Table 3 - Planted vine areas per Portuguese region (Source: Adapted from IVV, 2015 [2]).
There are 26 grape varieties with more than 1000 ha of vines planted each in Portugal, with Aragonez/Tinta Roriz/Tempranillo and Touriga Franca with more than 10 000 ha planted each (Table 4). Although Portugal has a large number of autochthonous varieties and several distinct DOP regions, there is a limited offer of wine producing varieties: the 10 most planted varieties in Portugal combined represent 36% of all vine area planted: Aragonez/Tinta Roriz/Tempranillo, Touriga Franca, Castelão/João de Santarém/Periquita, Fernão Pires/Maria Gomes, Touriga Nacional,
1 Cabernet Sauvignon Red 290 091 220 890 127 678
2 Merlot Red 267 169 211 967 154 752
3 Airen White 252 364 387 978 476 396
4 Tempranillo Red 232 561 32 985 47 429
5 Chardonnay White 198 793 145 344 69 282
6 Syrah Red 185 568 101 516 35 086
7 Garnacha Tinta Red 184 735 213 987 282 997
8 Sauvignon Blanc White 110 138 64 889 44 677
9 Trebbiano Toscano White 109 772 136 572 207 442
10 Pinot Noir Red 86 662 60 099 41 539
Order Grape Variety Colour 2010 (ha) 2000 (ha) 1990 (ha)
DOP Total Minho 15 810 27 432 Tras-os-Montes 417 23 303 Douro 40 378 43 611 Beiras 8 370 52 670 Lisboa 1 074 22 425 Tejo 1 161 15 653 Península de Setúbal 2 154 8 622 Alentejo 10 090 23 188 Algarve 119 1 773 Total 79 573 218 677 Area (ha) Region
Trincadeira/Tinta Amarela/Trincadeira Preta, Baga, Síria/Roupeiro/Códega, Arinto/Pedernã e Syrah/Shiraz.
Table 4 - Most planted varieties in Portugal in 2014 (Source: IVV, 2015 [2]).
Baga represents close to 5000 ha of the planted vineyard area in July 2014, and it is almost limited to the Bairrada and Dão regions. According to IVV reports, Baga planted area in July 2013 was 4811 ha [3], in July 2014 was 4996 ha, and 7105 ha in July 2015
[4] - these features are for a total vineyard area in Portugal, and not only Bairrada
region. If one believes that the vast majority of Baga plantings occur in Bairrada region, this evolution represents an inversion of the apparent decrease of Baga planted area over the last decade in Bairrada (during the 80‟s, Baga represented 80 to 90% of the red varieties planted in Bairrada region [5]).
Portugal‟s overall production of wine is a bit more than 6 000 000 hectolitres (hL) per year (Table 5), divided between 2 227 500 hL of wine with DOP, 725 000 hL of fortified wine, 1 685 000 hL of wine with “Indicação Geográfica Protegida” (IGP) and the rest just wine (close to 1 500 000 hL). Minho, Douro and Alentejo regions are responsible
Aragonez / Tinta Roriz / Tempranillo 15292 7 Touriga Franca 12231 6 Castelão / João de Santarém / Periquita 9287 4 Fernão Pires / Maria Gomes 9126 4 Touriga Nacional 8183 4 Trincadeira / Tinta Amarela / Trincadeira Preta 7632 3 Baga 4996 2 Síria / Roupeiro / Códega 4909 2 Arinto / Pedernã 4244 2 Syrah / Shiraz 3925 2 Loureiro 3820 2 Alicante Bouschet 3710 2 Tinta Barroca 3646 2 Vinhão / Sousão 2953 1 Alvarinho 2224 1 Malvasia Fina / Boal 2094 1 Rufete / Tinta Pinheira 2078 1 Marufo / Mourisco Roxo 2064 1 Malvasia Rei 1897 1 Jaen / Mencia 1826 1 Caladoc 1781 1 Cabernet Sauvignon 1712 1 Rabigato 1553 1 Antão Vaz 1339 1 Trajadura / Treixadura 1171 1 Azal 1 080 0.5
for the major quota of the DOP wine produced, and the central-southern region produces the most important amount of IGP wine produced (Alentejo, Lisboa, Península de Setúbal and Tejo regions). Vinho do Porto is the most important fortified wine with DOP produced in Portugal, accounting for more than 700 000 hL. Interesting information is that Portugal produces less wine without DOP or IGP than wine with DOP and wine with IGP.
Table 5 - Wine production in Portugal in 2014 per region (Source: IVV, 2015 [2]).
Portugal‟s wine production is slowly decreasing (Table 6), the same occurring with Bairrada/Beira Atlântico region. The Bairrada/Beira Atlântico region is responsible for producing 255 333 hL in 2014 vintage, from which 71 787 hL was produced as DOP wine, 28 633 hL as IGP, and the rest as table wine.
Table 6 - Evolution of wine production in Portugal per region 2004-14 (Source: IVV, 2015 [2]).
Comparing Portuguese wine production with other European Union (EU) countries (Table 7) and other countries from the world (Table 8), Portugal produces significantly less wine than Germany, France, Spain and Italy, and also South Africa, China,
Minho 793 417 743 626 0 43 837 0 5 953
Trás-os-Montes 96 615 12 070 0 7 600 1 204 75 741
Douro & Porto 1 516 925 507 497 707 752 42 631 0 259 045
Beira Atlântico 255 333 71 787 0 28 633 34 263 120 649 Terras do Dão 304 824 195 362 0 30 702 4 887 73 873 Terras da Beira 215 783 42 853 0 35 930 0 137 000 Terras de Cister 64 731 21 266 0 1 400 0 42 064 Tejo 500 807 54 860 276 159 846 3 030 282 795 Lisboa 885 742 46 911 477 503 749 757 333 848 Península de Setúbal 407 853 108 522 15 624 190 009 30 93 668 Alentejo 1 127 910 469 652 433 633 255 150 24 419 Algarve 11 676 1 668 0 7 794 0 2 214 Continental Subtotal 6 181 615 2 276 075 724 562 1 685 388 44 321 1 451 271 Madeira 43 136 1 270 39 426 35 0 2 405 Açores 6 595 53 1 219 973 0 4 350 Island Subtotal 499 731 1 323 40 645 1 008 0 6 755 Total 6 231 347 2 277 398 765 207 1 686 396 44 321 1 458 026 Region Wine with indication Wine
of Year/Variety IGP wine
DOP fortified wine DOP wine
Total
Minho 987 715 939 564 937 605 710 625 784 028 866 985 912 176 823 341 655 253 793 417
Trás-os-Montes 225 787 255 798 232 042 98 302 105 075 110 614 119 367 102 005 108 615 96 615
Douro & Porto 1 645 627 1 743 865 1 717 728 1 443 429 1 379 051 1 351 949 1 660 408 1 329 423 1 346 152 1 516 925
Beira Atlântico 377 947 413 322 365 030 255 978 211 669 246 705 297 704 292 596 283 897 255 333 Terras do Dão 376 121 487 491 515 551 240 723 251 863 297 483 355 687 293 537 356 454 304 824 Terras da Beira 364 606 356 079 363 100 125 789 194 365 192 084 224 735 184 759 217 693 215 783 Terras de Cister 77 650 97 046 94 312 37 605 78 831 47 872 61 036 45 959 64 655 64 731 Tejo 845 425 685 319 639 747 669 472 518 989 544 935 630 548 382 276 641 789 500 807 Lisboa 1 294 856 1 177 088 1 195 983 1 056 407 932 736 962 323 1 204 098 826 666 1 097 712 885 742 Península de Setúbal 373 125 338 204 428 488 418 989 337 139 379 371 431 696 308 857 517 797 407 853 Alentejo 825 709 693 364 961 721 930 452 811 690 810 338 1 189 719 969 832 970 124 1 127 910 Algarve 24 107 27 955 31 672 27 587 23 698 23 650 19 190 13 150 12 338 11 676 Continental Subtotal 7 418 676 7 215 095 7 482 979 6 015 360 5 629 135 5 834 310 7 106 363 5 572 402 6 272 479 6 181 615 Madeira 41 213 42 656 49 245 45 591 49 925 45 449 36 782 38 769 49 637 43 136 Açores 21 339 8 493 10 482 12 091 9 500 13 754 4 783 11 192 4 991 6 595 Island Subtotal 62 552 51 149 59 728 57 682 59 426 59 203 41 564 49 961 54 628 49 731 Total 7 481 228 7 266 244 7 542 706 6 073 042 5 688 560 5 893 513 7 148 927 5 622 363 6 327 107 6 231 347 2009/10 2010/11 2011/12 2012/13 2013/14 Region 2004/05 2005/06 2006/07 2007/08 2008/09
Australia, Chile, Argentina, and United States of America - Portugal‟s wine production represents 2% if combining the productions of these countries.
Table 7 - Evolution of wine production in European Union (Source: IVV, 2015 [2]).
In this scenario, combining wine surplus with the small size of the country and its wine production, Portuguese wine companies face the difficult challenge of creating a noticeable place in the global market of wine.
Table 8 - Comparison of Portuguese wine production with other countries (Source: IVV, 2015 [2]).
One alternative to increase Portugal‟s importance in the wine world is to promote the wine as a wine country, rather than promote individual companies - IVV, Viniportugal and DOP boards had only started to walk this path.
One other path that could help to achieve wine companies‟ success is increasing quality and gradually increasing selling price of the Portuguese wines. This purpose is usually accompanied of lowering yields per area of vineyard and increasing viticulture/winemaking knowledge and technical capacity.
Others 1 259 1 143 -9 Slovenia 754 770 2 Croatia 1 424 1 248 -12 Bulgaria 1 246 1 755 41 Austria 2 352 2 392 2 Hungary 3 198 2 666 -17 Greece 3 079 3 343 9 Romenia 6 703 5 242 -22 Portugal 5 894 6 231 6 Germany 9 228 8 409 -9 France 46 743 41 491 -11 Spain 39 232 52 460 34 Italy 50 665 54 029 7 UE Total 171 777 181 179 5 2009/10 (1000hL) 2013/14 (1000hL) 5-Year variation (%) Others 41 692 38 580 -7 Portugal 5 894 6 231 6 Germany 9 228 8 409 -9 South Africa 9 986 10 980 10 China 12 800 11 780 -8 Australia 11 784 12 310 4 Chile 10 093 12 846 27 Argentina 12 135 14 984 23 USA 21 965 23 500 7 France 46 743 41 491 -11 Spain 39 232 52 460 34 Italy 50 665 54 029 7 World Total 272 217 287 600 6 2009/10 (1000hL) 2013/14 (1000hL) 5-Year variation (%)
Bairrada region is one of the oldest wine producing regions of Portugal: wine production in this region goes back to romans time. Several Portuguese Kings took measures to protect the wines from the area which is presently the Bairrada region due to their quality and social-economic importance, even though the vineyard destruction imposed by Marquês de Pombal following the establishment of the Vinho do Porto region. The area of the region spreads from „Minho‟ to „Estremadura‟, and it can be described by its small properties of intensive and multicultural agriculture. The DOP Bairrada region is situated between Águeda and Coimbra, delimitated at North by the Vouga river, at South by the Mondego river, at East by the Caramulo and Buçaco mountains and at west by the Atlantic Ocean. The region is constituted mainly by plains, with vines planted usually below 120 meters‟ altitude; due to the plain and the closeness to the ocean, the climate is temperate with strong maritime influence, with abundant rains and cool temperatures; the winters are long and cool, and the hot days of the summer are smoothen by cool sea breezes. There are several soils profiles that go from the argyle-calcareous to sandy soils, giving different styles of wines - normally fresh, acidic and low alcohol, with fruity and mineral whites, vibrant sparkling wines and highly tannic reds.
The medium to small size properties establish grounds for the presence of large cooperatives and large wine companies - the highly fractioned grape production of the region is bought by the large wine producers, so the main objective of grape producers is to produce more grapes to sell.
In this context, Baga variety rose between all other varieties planted in the region - because is a highly productive variety, it was called in the Bairrada region as „Paga-dívidas‟ (Pays-debts) and „Carrega-burros’ (Burdens-donkeys)[6]. Baga was then the
most important red variety of the Bairrada region. Nowadays, the importance of the variety diminished due to several aspects: the quality of wines produced from Baga cannot be reliably predicted before the harvest, because high yield production is usual, maturation of the fruits is every year a challenge (sometimes incomplete), significant fraction of grapes has clusters of Botrytis infection if rain occurs after veraison, which require tremendous work with canopy management because shoots grow unevenly and horizontally (shoot trimming, leaf removal and fruit/bunch/cluster thinning are frequently needed), and, of course, because of planting of new vineyards. In order to counteract these problems and be successful, substantial investment in labour has to be done by the grape producer, but the quality of the wines continues to be unpredictable until the day of the harvest.
Due to these profit-debilitating problems, Baga vineyards are being to be planted with other grape varieties. This is particularly observed for those vineyards of old age plants, resulting in a region that loses its identity, strongly related with Baga variety.
In a perspective of excessive wine production and world wine surplus, it is important to know its impact according to some aspects: relation to legal problems, production and also with commercial value of the product:
a) Legal production limits imposed by international and national regulators, and also by regional regulators of a particular region/DOP, aim to regulate the total yield per vine area, in order to guaranty an appropriate quality level and also to prevent the fall of commercial price of wines from a specific region. Bairrada region DOP wine is regulated by Portuguese law, and the yield for red wines is limited to 80 hL per ha [7];
b) Yield limits also help to normalize standards‟ levels of production costs because avoid surplus in grape production benefits the regulation of the selling prices of grapes, aiming to create a competitive edge for the grape producers.
c) Yield limits determine a maximum volume of wine to be produced each year in a particular region. Because of the limited volume of wine available, the ratio between supply and demand is sustained (or even the demand increases, in the optimal situation) and, if quality standards are high or increasing gradually, the value of the product also increases - this helps to maintain/increase commercial prices for the wines of the region. These limits also help the producers to manage their production because production (and prices) fluctuations are usually due to climate variations.
Consequently, grape yield are controlled, and if needed, reduced. This is essential for small wine productions (regions and/or small countries).
For a grape producer, what kind of yield control or yield reduction strategies can be implemented?
Yield control strategies can be approximately divided into 3 major groups: long term methods (that relate to vineyard selection and planting); usage of some kind of product/mixture/etc; and soil/canopy management techniques.
These yield control strategies will be explained in further detail in the following chapters. At this point, it is important to emphasize that, adding to the goal of controlling the yield, each of these strategies have other consequences that have to be considered when making the decision - the consequences can be related to viticulture management, regarding the labor allocation and costs, of the plant response during the current vintage and for the subsequent vintages; which can consequently affect grape and wine quality.
Most of viticultural aspects that are influenced by using one of the mentioned strategies/techniques can be measured and sometimes predicted, even if takes several years to perform the measurement; on contrary, the aspects involving fruit and wine quality are difficult to be measured and/or predicted - as there are too many factors that have a determinant influence in wine quality (factors regarding viticulture, biochemistry, chemistry, sensorial, cultural and hedonic perception) some other factors related to wine quality also, are too subjective to be described and measured in an accurate way. Viticulture should be complementary to winemaking and may determine wine producing goals, through being able to pursue the strategies needed to obtain fruits that are able to produce the intended wine; but then, viticulture should also be useful to typify the virtues of the grapes produced in a particular vintage in order to predict the quantity and the qualities of the wines that can be produced with those fruits. Extensive and more complex relationship between viticulture and winemaking should be pursued in order to aid the decisions of the winemakers but also to empower their decisions, that is, to provide enough information to the winemakers in order that render them able to consciously make decisions leading to produce the wines they want.
In view of this local and economic context, the need arose for a study with the following objectives:
Compare the effects of the techniques Manual Early Leaf Removal (MAD), Mechanical Early Leaf Removal (MED), Manual Bunch Thinning/ Manual Cluster Thinning (MBT), and „Double Maturation Raisonnée‟ (DMR) as methods of yield control and to demonstrate their effects on the quality of grapes, musts and wines of Baga variety;
To use new techniques of yield control by means of expeditious means („Double Maturation Raisonnée‟ - DMR) or mechanizable (Mechanical Early Leaf Removal - MED);
To test and to prove the effects of the Early Severe Leaf Removal and the „Double Maturation Raisonnée’ as alternative methods of control of the production, comparing with Manual Bunch Thinning;
To demonstrate the respective effects on quality of musts and wines, produced with Baga variety, produced in the demarcated region of Bairrada;
Chemical and aromatic characterization of wines produced with Baga variety, and to elucidate some aspects related to the aromatic typicality of the Baga variety.
II Yield control techniques and wine quality
2.1 Reproductive cycle of the vine
Vineyard and vine management have always immediate consequences, some predictable, some unclear, and almost all management techniques used currently can carry consequences for several years after being employed. The knowledge of the grapevine yearly cycle can be useful to understand and to predict some of the consequences of vineyard and canopy management techniques.
The grapevine is a perennial plant, specially adapted to temperate climate - it has a vegetative growth active period (from spring to fall), and a resting period, during the winter. After bud burst in the spring, a complex bud is formed in young shoots, in the axil part of each leaf. In the bud is formed three latent buds - primary, secondary and tertiary buds. This bud may also burst within the same growing season, developing as a lateral shoot [8]. During the beginning of the growth period, several leaves primordia develop in each of these buds, while inflorescence primordia develop mainly in the primary bud [9]. By mid-summer, the latent buds enter in a paradormancy stage, in which bud burst is inhibited by factors originated in other plant organs, such as auxins from the apical meristem [10]. Entering fall, the decrease of sunshine hours and ambient temperature induce bud endodormancy, a phase in which bud burst is repressed by factors within the bud [10,11] - it will be required exposure to cold temperatures during a significant period to occur the bud evolution through the dormancy cycle and eventually be released from endodormancy [10,12]. Once the low temperature necessities are fulfilled, buds become capable of burst under the adequate conditions - buds can go through ecodormancy stage, as long as the environmental conditions inhibit bud burst because of being inadequate for supporting the plant growth [11].
The reproductive cycle of Vitis vinifera is an intricate complex process, covering over two years, deeply influenced by environmental conditions and cultural practices. During the flower formation (a process dependent of numerous factors [13]), four phases can be defined as crucial: induction, initiation and early differentiation (occurring during the first year), and differentiation after bud break (occurring in the second year) [14] (Figure 3).
During the first year, induction occurs, which means the formation of the reproductive primordia. Stems and inflorescences have a common primordia origin and successful destine depends on hormonal balance cytokinins and gibberellins - cytokinins favour the transition to flower. After the induction of the primordia of
inflorescence, stems and shoot, meristems that will convert into flower in the second year begin to develop, although not all will be present in the latent bud.
Figure 3 – Grapevine two-year lifecycle, according to Watt et al [14]
- adapted for southern hemisphere.
The main factors regulating the fertility of the buds are light exposure [15,16,17], temperature (between 20 and 35º C) and carbohydrates availability. The absence of any kind of stress [18,19,20] and precipitation will also help to a successful initiation.
During growth, the dormant buds predominantly obtain carbohydrates from the leaves of the same side of the shoot [21]. There is a lack of competition between initiation and inflorescence differentiation in dormant buds [22,23], with the development of the flowers already open before the fruit set; on the other hand, there is evidence of competition between vegetative growth and flowering process [24]. Thus, a decrease in photosynthesis during flowering can produce negative impact on the fertility of the bud, although can also be related with the carbohydrates reserves in the perennial parts of the plant [25,26].
The formation and differentiation of the different parts of the flower begins after bud break in the second year. Light exposure, temperature and carbohydrates availability are key factors that influence bloom (same as for induction, initiation and differentiation of the first year), and carbohydrate availability is accepted to be the start trigger [15,16,17]. Low temperature and humidity combination can be negative for bloom, and can result in poor pollination and fruit set. It was also referred that rain periods before and during flowering can cause flowers to drop [27], before even opening. In theory, the
carbohydrates needed for flowering could come from the reserves of the perennial parts and from photosynthesis, although being widely accepted that the main source of carbohydrates for flowering is photosynthesis [28]. Some authors refer that leaf removal close to flowering period could cause abortion of flowers [25] and the decrease of fruit set. Other authors refer that an imbalance of macro and micronutrients can also produce negative impact in flowering and fruit set [29,30,31,32,33].
The transformation of the flower into a fruit, or fruit set, varies depending of the variety and clone. When flowering occurs under normal conditions, the decrease of fruit set is usually due to deficient nutrition of the flower and the newly formed fruit, not having enough energy to guaranty regular fruit development [34,35,36]. The occurrence of any irregular environmental condition or the usage of a cultural technique that lowers photosynthesis and/or sugar available in the plant will cause the decrease of fruit set.
After flower fecundation, fruit set and fruit development begins with a cell multiplication phase (increase in cell number by mitosis), which takes place during 2 to 3 weeks. Afterwards, cell multiplication ends and cell enlargement stage initiates, throughout approximately 4 weeks. At this point, cell number of pericarp is already definitive and so the berry size is dependent of the elasticity of the cell walls (and the cell number) [37]. If some irregular environmental condition or a cultural technique is performed that lowers photosynthesis and/or sugar available in the plant, a decrease of berry size will be caused.
2.2 Microclimate and canopy management
The importance of microclimate in viticulture was widely studied, like by Smart [38] among others, explored the effects of environmental conditions near and close to the clusters and leaves. Microclimate depends predominantly on leaf density and on the arrangement of leaves and clusters, which is critical to the quantity and quality of the light that reaches the plant, the leaves and the clusters, and also for the temperature and humidity surrounding them [39].
The sanitary condition of the grapes is a crucial element for their quality. For varieties with high leaf density, leaf transpiration can lead to the increase of humidity close to leaves and clusters and conditions prone to disease incidence; if the canopy is open and porous, ventilation is stimulated and more intense, consequently reducing humidity, decreasing the presence of fungal infections such as Botrytis cinerea [39,40,41].
Several authors [42,43,44,45,46,47] associate higher light exposure of the clusters with improving the quality of the grapes, referring higher content of sugar, polyphenols and anthocyanins, and lower malic acid concentration and titratable acidity.
In cooler climates, higher concentration of anthocyanins (related with colour development) is associated with increased cluster exposure to sunlight [48,49,50]; in warm regions, higher exposure can be extreme, causing berry skin sunburn [50,51,52] and lower colour [50,53,54]; sunlight exposure and concomitant increased temperatures were also described as key factors stimulating the degradation of malic acid [55,56] and it was also observed a greater assimilation of carbon dioxide in the synthesis of tartaric acid in berries exposed to sunlight, compared with berries under shading [57].
Grape phenolics are often mentioned as quality indicators specially for red varieties
[58,59,60]. The influence of temperature and light on polyphenols synthesis and
accumulation is a complex phenomenon because the metabolic pathways of these compounds are sensitive to both factors [52] and it is not simple to study these factors independently. In general, it is established that an increase in light exposure favours higher concentrations of berry polyphenols, specially flavonoids (anthocyanins and flavonols, mainly [52,53,54,61]). Moreover, negligible flavonol contents were found in berries that were not exposed to light [62].
From several studies designed to study the effects of light and temperature on anthocyanins accumulation [50,52,54,61], it was reported that the normal canopy conditions allow clusters to obtain sufficient light, with moderate intensity, not being a limiting factor; however temperature seems to be a limiting factor [47]. The temperature range of 17 to 26º C would be suited for the enzymes involved in the biosynthetic pathway [63]; 20 to 30º C for Cabernet Sauvignon [64] and for Merlot [52]. Temperatures around 35º C and high light exposure may lead to insufficient colour accumulation because of the inhibition of the anthocyanin synthesis and/or due to the increased degradation rate [54]. It was also found that the temperature range effect over the synthesis of anthocyanins depends on the variety [65].
Canopy might be defined as the leaf and shoot system of the vine [66]; it is described by dimensions of the boundaries in space (width, height, length, etc.) and also by shoot system (usually leaf area). Canopies can be continuous (the foliage from adjacent vines of the row combines, having no large gaps) or discontinuous (canopies are separated from vine to vine).
Canopies can be divided (one vine or adjacent vines are divided into discrete foliage walls) or dense (high leaf area within the volume bounded by canopy surfaces) - high
value of the ratio leaf area/canopy surface area (LA/CSA) [67], or of leaf layer number (LLN) or shoot density (shoots/m canopy) [68].
„Canopy management‟ includes a range of techniques which can be used in vines to alter the position or amount of leaves, shoots and fruits in space, to achieve some desired arrangement (i.e. canopy microclimate): winter and summer pruning, shoot positioning, leaf removal (principal and lateral leaf removal), shoot vigour control (suckering, shoot trimming, top trimming) and fruit thinning. Canopy management techniques can be used to improve production and/or wine quality, reduce disease incidence, facilitate labour and mechanisation. Open canopies also lead to more efficient distribution of agricultural chemicals [69].
Some basic principles of canopy management can be mentioned [38]:
- exposed leaf surface (ELS) should be healthy and efficient through all vegetative season;
- broad and well exposed ELS are desirable;
- keep cluster light microclimate suitable for the vineyard region; - find balance between ELS and yield;
2.3 Wine quality and grape composition
What is wine quality?
Can basic, premium and ultra-premium wines be differentiated, chemically and by taste? Will they have the same quality standards or composition?
Do young and aged wines have the same qualities?
Does the quality standard has to be universal, or is it individual?
Are there some individual molecules that are responsible for highlighting an individual wine as high quality, or young wine, or as a cheap wine?
And, again, can we define „quality‟?
The „quality‟ may be defined as “A distinctive attribute or characteristic possessed by someone or something” [70]; this definition is originated from Latin „qualitas’, meaning “of
what kind, of such a kind”. Clearly, „quality‟ means the intrinsic attributes of someone or something, without classifying if those attributes are positive or negative. There is another definition, more common, for „quality‟ - “The standard of something as measured against other things of a similar kind; the degree of excellence of something”
[71]
. Using this definition of quality, the subject is classifying the attributes as positive so „quality wine‟ means that it is a very good wine when compared with other wines. The problem with the use of this terminology is that the attributes used to define if the wine has quality or not, are subjective, individual and not identified - each individual has a set of attributes to characterize a wine as good or not, and each individual experiences in a unique way a particular wine, so there are distinct and individual definitions for a single attribute due to physiological and neural abilities, cultural and experience learning and individual hedonic preferences.
Quality definition should be characterized by identifiable and measurable attributes, related to compound concentrations, consumer preferences, sensorial description/analysis or commercial value. For example, wine chemical composition can be a starting point to define wine quality, but it will not be enough to describe this quality. After clearly defining what does one mean as „wine quality‟, the features that contribute positively or negatively to wine quality can be found, identified and related with the consumer perception of the wine. Perceived wine quality and their related compounds can be dependent of many aspects of the wine production, from grape composition on the moment of picking and varietal and vineyard characteristics, harvest conditions, fermentation conditions and winery techniques and maturation and conservation of the final wine.
![Table 1 - Wine production for 2012-16 (Source: Adapted from OIV, 2017 [1] ).](https://thumb-eu.123doks.com/thumbv2/123dok_br/19172226.941706/22.892.165.752.193.517/table-wine-production-source-adapted-oiv.webp)
![Figure 3 – Grapevine two-year lifecycle, according to Watt et al [14] - adapted for southern hemisphere](https://thumb-eu.123doks.com/thumbv2/123dok_br/19172226.941706/32.892.230.686.191.580/figure-grapevine-lifecycle-according-watt-adapted-southern-hemisphere.webp)
![Figure 4 - Berry growth phases (adapted from James Kennedy) [74] .](https://thumb-eu.123doks.com/thumbv2/123dok_br/19172226.941706/38.892.156.761.255.739/figure-berry-growth-phases-adapted-james-kennedy.webp)