Phylogenetic position of Placozoa based on large subunit (LSU)
and small subunit (SSU) rRNA genes
Fernanda Britto da Silva
1, Valéria C. Muschner
2and Sandro L. Bonatto
1 1Centro de Biologia Genômica e Molecular, Faculdade de Biociências, Pontifícia Universidade Católica
do Rio Grande do Sul, Porto Alegre, RS, Brazil.
2
Departamento de Genética, Instituto de Biociências, Universidade Federal do Rio Grande do Sul, Porto
Alegre, RS, Brazil.
Abstract
The phylum Placozoa, represented by its single speciesTrichoplax adhaerens, has always been considered one of the most basal animal clades due to its low morphological complexity. However, despite its importance, the phylo-genetic position of the Placozoa remains uncertain, as does the relationships between the basal metazoans. We se-quenced the nearly complete large subunit (LSU) of theT. adhaerens rRNA gene together with the small subunit (SSU) rRNA and used several methods to infer the phylogenetic position of Placozoa and the relationships between the basal animal phyla. The phylogenetic trees obtained from the LSU, SSU and SSU + LSU datasets support monophyly of all basal metazoan phyla, except the Porifera. However, the relationships between all these phyla were not consistently resolved due to a strong conflict between the LSU and SSU phylogenetic signals. The hypotheses that Placozoa is a derived Cnidaria or the most basal metazoan were not supported by our data. Moreover, our analy-ses suggests that Placozoa is most likely the sister group of Cnidaria and/or Bilateria.
Key words: Trichoplax adhaerens, Placozoa, animal basal phylogeny, Metazoa relationship, rRNA genes. Received: December 14, 2005; Accepted: July 17, 2006.
The phylogenetic relationships between the major groups of animals is one of the most challenging problems in evolutionary biology, mainly due to the difficulty in find-ing homologous characters for these groups (Adoutteet al., 1999). In the last decade molecular studies have contrib-uted greatly to addressing some of these questions, but these efforts have concentrated on the relationships among the Bilateria groups. Unfortunately, the initial diversifica-tion of Metazoa remains largely unknown (Bridgeet al., 1995; Kimet al., 1999; Borchielliniet al., 2001) but it is es-sential to elucidate the relationships among the basal metazoan phyla in order to understand the main evolution-ary steps which gave rise to the major animal bodyplans. One of the most enigmatic and little known basal animals is the phylum Placozoa, currently represented by the single speciesTrichoplax adhaerens(but see Voigtet al., 2004). Placozoans were firstly described by Schulze (1883), being one of the morphologically most simple multicellular ani-mal groups (Grell and Ruthmann, 1991; Ender and Schierwater, 2003). They lack a muscular system and nerve
cells (but may have presynaptic mediators, Shuchert, 1993) as well as any organ and are histologically very simple, with only four kinds of somatic cells (Grell and Ruthmann, 1991; but see also Martinelli and Spring, 2003). At approxi-mately 40 Mb the Placozoa genome is the smallest animal genome yet known (Ruthman, 1977).
Despite the increasing interest in the Placozoa, its phylogenetic position within the Metazoa remains highly controversial (Halanych, 2004). Its overall simplicity sug-gests that it may be one of the most basal animal groups, or even the most basal group (Grell and Ruthmann, 1991). Several molecular studies tried to elucidate the evolution-ary relationships of the Placozoa, most studies having used the small subunit (SSU) rRNA gene alone, or in conjunc-tion with other data, such as morphology. The main hypoth-eses presented by these studies are that the Placozoa is a sister group of Ctenophora + Cnidaria (Bridgeet al., 1995), Porifera + Ctenophora (Haneltet al., 1996), Ctenophora (Odorico and Miller, 1997) or Cnidaria (Kimet al., 1999; Borchielliniet al., 2001; Glenneret al., 2004). Bridgeet al.
(1995), also based on 18S rDNA sequence data, suggested that Placozoa is positioned within the Cnidaria, as a sister group of Cubozoa, an hypothesis which implies that the simplicity of this animal is a derived condition (Collins,
www.sbg.org.br
Send correspondence to Sandro L. Bonatto. Centro de Biologia Genômica e Molecular, Faculdade de Biociências, Pontifícia Uni-versidade Católica do Rio Grande do Sul, Av. Ipiranga 6681, 90619-900 Porto Alegre, RS, Brazil. Email: [email protected].
1998). However, this phylogenetic position was not sup-ported by Ender and Schierwater (2003) who analyzed the mitochondrial 16S gene and the mitochondrial genome structure of the Placozoa and four groups of Cnidaria and showed that Placozoa has a circular mitochondrial genome like the majority of other animals which is different from the linear genomes found in Cnidaria Medusozoa. A close relationship between Placozoa and Bilateria (and of both of these with Cnidaria) has also been suggested by some stud-ies (Collins, 1998; Collins, 2002; Anderson and Swofford, 2004). Unfortunately, all these studies were very limited as they used a partial representation of important basal metazoan taxa and/or a single gene. Poor taxon sampling has also been a major limitation in all recent studies that used new alternative genes, such as elongation factor-1 al-pha, actin and the homeobox genes, brachyury and Tbx/2/3 (Martinelli and Spring, 2003; 2004; 2005).
One of the most complete molecular studies of the basal diversification of the Metazoa was made by Medina
et al.(2001) who compared the SSU and the large subunit (LSU) rRNA genes from 23 groups including Fungi, Choanoflagellida, Mesomycetozoa, Porifera, Ctenophora, Cnidaria and representative Bilateria, but not the Placozoa. These authors confirmed the monophyly of the Metazoa, Cnidaria, Ctenophora and Bilateria but not of the Porifera, which was split into two different clades. However, the re-lationships among most of these phyla were not resolved with a high level of confidence.
Here we present a nearly complete sequence of theT. adhaerensLSU gene (submitted to GenBank under acces-sion number AY303975) and, including the LSU and SSU data from Medinaet al. (2001) and data from the basal bilaterian acoelomorph flatwormParatomella rubra (Tel-fordet al.2003), try to infer more accurately the phylogen-etic position of Placozoa.
We cultured a lineage of the placozoanTrichoplaxin glass Petri dishes in 33% salinity artificial seawater (RED SEA®) at a constant temperature of 19 °C and a light/dark cycle of 12:12 h. Every two weeks we replaced the seawater and fed the T. adhaerens cultures with the green algae
Pyrenomonas (Cryptophyta) and Dunaliella
(Chlorophyta). Seven individual T. adhaerens were col-lected and their DNA extracted using phenol-chloroform as described by Sambrook and Russel (2001). Amplifications were done by long PCR with the following conditions: 94 °C for 1 min, 35 X (94 °C for 30 s; 45 °C for 1 min; 68 °C for 6 min), 68 °C for 10 min, in a total volume of 25µL con-taining Elongase Enzyme Mix (Invitrogen, Carlsbad, CA, USA). The nuclear LSU and SSU rRNA genes were ampli-fied using the set of primers described by Medinaet al.
(2001) and Medlinet al.(1988), respectively. The LSU was sequenced almost completely but only about 500 bp from both extremities of the SSU gene was sequenced to com-pare with the Placozoa SSU sequences available in GenBank. As our partial sequences were identical with
GenBank sequence U65478, we used this sequence in all the analyses. The PCR products were sequenced with the ET-Terminator cycle sequencing kit (Amershan Biosci-ences, Piscataway, USA) and read in a MegaBACE 1000 sequencer. All chromatograms were manually checked. We used the Clustal X program (Thompsonet al.1997) with default options to align the additional sequences to the SSU and LSU alignments presented in Medinaet al.(2001) as kindly provided by M. Medina (Joint Genome Institute, CA, USA). The same regions that could not be satisfacto-rily aligned and were excluded by Medinaet al. (2001) were also excluded here. Our analyses were done consider-ing three datasets, the SSU and LSU individual alignments and the SSU + LSU concatenated alignment.
Phylogenetic analyses of the three datasets were per-formed using maximum likelihood (ML) and maximum parsimony (MP) with the PAUP* 4.0b10 program (Swofford, 2002), using, when appropriate, the models of nucleotide substitution as suggested by the Modeltest V 3.06 program (Posada and Crandall, 1998). For the MP analyses both equally weighted and 2:1 weighting for transversion to transition were used, as recommended by Medinaet al.(2001). Bootstrap statistical support was per-formed for both ML and MP with 200 replications of heu-ristic search and simple taxon addition and for MP Bremer support was also estimated using the SEPAL 1.1 program (Salisbury, 1999). Additional ML analyses were done us-ing the PhyML V 2.4.3 program (Guindon and Gascuel, 2003) and the MetaPIGA V 1.02 program (Lemmon and Milinkovitch, 2002) with settings as suggested in the pro-gram manuals, the HKY85 model was used in the MetaPIGA program because this was the most general model implemented in this program. Bayesian inference (BI) phylogenetic analyses were performed with the MrBayes 3.0 program (Huelsenbeck and Ronquist, 2003) using four multiple runs for each gene from different
start-ing seeds, the default settings and the General
andParatomella rubrato determine the influence of the relatively more elevated rate of substitution of these genes in these species.
To test the key hypotheses for the phylogenetic place-ment of the Placozoa put forth in the literature, we used the Kishino-Hasegawa test as implemented in PAUP*. As these hypotheses were defineda prioriit was unnecessary to use the modified Shimodaira-Hasegawa test. We also used the approximately unbiased test (au) p-values as esti-mated by the Consel V 0.1f program (Shimodaira and Hasegawa, 2001). The hypotheses tested were Placozoa as a sister group of Bilateria, Cnidaria, Bilateria + Cnidaria, Ctenophora, and Metazoa. After our LSU placozoans se-quence had been submitted to GenBank, Voigtet al.(2004) published six additional almost completeT. adhaerens28S sequences. Additional exploratory analyses with MP (with PAUP*) were done including the two most divergent of these sequences, H1 and H8, to test the influence of these extra sequences on our results (not shown).
We obtained a nearly complete (2,946 bp) sequence of theT. adhaerensLSU gene, the alignment of the primary sequence and the secondary structure predicted by compar-ison with known gene structures support the hypothesis that this is the functional LSU gene of this species. The main characteristics of the SSU, LSU, and SSU + LSU gene alignments used here (available on request), with the am-biguously aligned regions excluded, are presented in Table 1. Considering both genes together, there can be as many as about four thousand positions, of which about 47% may be variable. The best substitution model as estimated by Modeltest was Tamura-Nei with invariant sites and gamma parameter (TrN + I + G) for all three datasets. The Simulate program, in the PHASE package, chose the RNA7A + dG4
+ I (see program manual) as the most likely evolution model.
As expected, since the placozoans sequences includ-ing H1 and H8 (Voigtet al., 2004) were not very divergent considering the distances between phyla the resultant phylogenetic trees were identical to those estimated with a single placozoans sequence. Therefore, since most of our phylogenetic analyses were very time consuming and it was thus important to keep the number of sequences as small as possible, we presented the results with our LSU se-quence only.
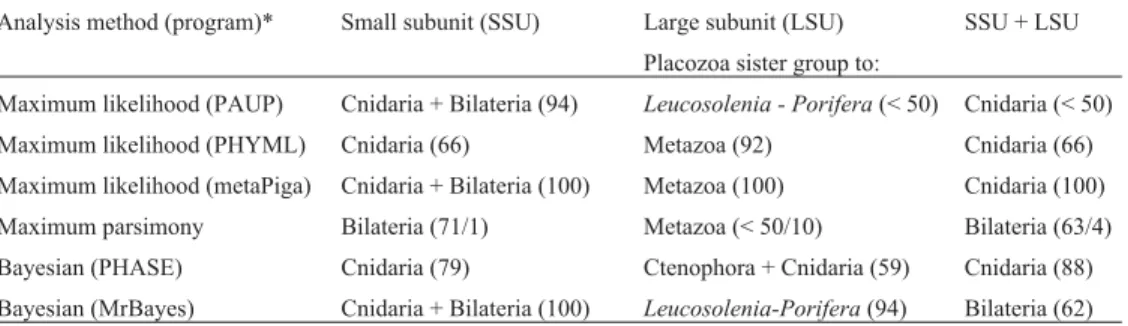
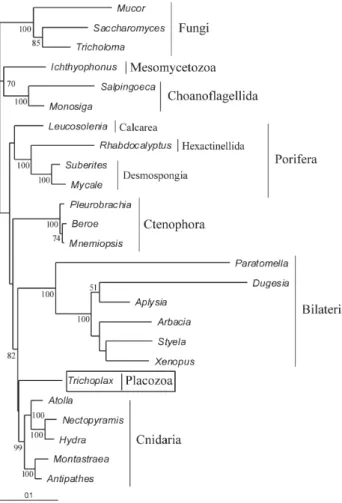
Table 2 shows the sister groups of Placozoa in all phylogenetic analyses carried out by us and Figure 1 presents the ML tree constructed from the SSU + LSU concatenated genes using PAUP* (all other trees can be obtained from the authors). The relationships among the metazoan phyla differ significantly in the SSU and LSU gene trees, while for each dataset the trees were usually similar for the different meth-ods (Table 2). The SSU + LSU trees were usually more simi-lar to the SSU than to the LSU tree, although the latter presented more informative characters (Table 1). In general, the SSU and SSU + LSU trees showed the Placozoa as the sister group of Cnidaria and/or Bilateria, and LSU as a sister group of Metazoa, Leucosolenia (Porifera), or Cnidaria + Ctenophora. However, in none of the phylogenetic methods the position of the Placozoa was the same for all three data sets (SSU, LSU and SSU + LSU) (Table 2).
Interestingly, this incongruence was true even for dif-ferent implementations (programs) of the same basic meth-ods (e.g., mL in PAUP* and PhyML or BI in MrBayes and PHASE). Branch support varied widely among methods and datasets, from high (100) to very low (< 50) support, with low correlation among datasets or methods. Removing the relatively much faster evolving sequences ofD. tigrina
Table 1- Basic statistics of the data sets.
Dataset Full length (bp) Conserved sites Variable characters Parsimony informative sites Gamma shape parameter
Small subunit (SSU) 1594 844 750 500 0.5702
Large subunit (LSU) 2408 1273 1135 790 0.5346
SSU + LSU 4002 2117 1885 1290 0.5410
Table 2- Placozoa sister group in each analysis. Support values are shown in parentheses: posterior probability values for BI, bootstrap percent values for mL, and bootstrap percent values and Bremer support for MP.
Analysis method (program)* Small subunit (SSU) Large subunit (LSU) SSU + LSU
Placozoa sister group to:
Maximum likelihood (PAUP) Cnidaria + Bilateria (94) Leucosolenia - Porifera(< 50) Cnidaria (< 50)
Maximum likelihood (PHYML) Cnidaria (66) Metazoa (92) Cnidaria (66)
Maximum likelihood (metaPiga) Cnidaria + Bilateria (100) Metazoa (100) Cnidaria (100)
Maximum parsimony Bilateria (71/1) Metazoa (< 50/10) Bilateria (63/4)
Bayesian (PHASE) Cnidaria (79) Ctenophora + Cnidaria (59) Cnidaria (88)
Bayesian (MrBayes) Cnidaria + Bilateria (100) Leucosolenia-Porifera(94) Bilateria (62)
and/orP. rubrahad no substantive impact on the results of the phylogenetic analysis (results not shown).
The Kishino-Hasegawa and Consel tests (Table 3) only rejected a few of thea priorihypotheses for the phylo-genetic position of Placozoa, such as its position as the most basal metazoan phyla or as a sister group to Ctenophora.
Overall, our results were similar to those of Medinaet al.(2001), corroborating the monophyly of the Bilateria, Cnidaria, Ctenophora and Metazoa, and suggesting the paraphyly of the Porifera, due to the unstable position of the Calcarea spongeLeucosolenia.
The phylogenetic position of Placozoa varied consid-erably among the trees inferred from the different datasets and methods. The major conflict was between the SSU and LSU trees, which always disagreed in at least one relation-ship considering the same method. The basal nodes of the Metazoa usually presented low support values, despite the relatively high number of sites used. These results were similar to those of Rokaset al.(2003), who could not re-solve the basal Metazoan tree using combined protein datasets (α-tubulin,β-tubulin, EF-2 and HSP90), probably due to conflicting phylogenetic signals from individual
genes. A likely cause for this difference could be the action of purifying selection on these highly conserved genes. A similar explanation could be postulated to explain the con-flict between our SSU and LSU datasets.
Nevertheless, based on the frequency of occurrence of some relationships (Table 2), the Placozoa seemed more closely related to the Cnidaria and/or the Bilateria clade. The phylum Cnidaria was the most frequent sister group of the Placozoa, based mainly on the SSU and SSU + LSU trees but, interestingly, this relationship never occurred in the LSU trees (Table 2). We found that in several trees Cnidaria + Bilateria or Bilateria alone also emerged as sis-ter groups of Placozoa. Previous studies support three rela-tionships of the Placozoa described above (see introduc-tion) and we suggest that the sister group of Placozoa is either Cnidaria or Bilateria. On the other hand, our results suggest the rejection of some hypotheses regarding the re-lationship of the Placozoa, although the Kishino-Hasegawa and the Consel tests significantly rejected only few of thea priorihypotheses (Table 3). For example, the suggestion by Grell and Ruthmann (1991) that the Placozoa may be the most “primitive” animal,i.e.a sister group to the rest of the Metazoa, received low support from our results, with only the LSU dataset supporting this hypothesis. Also, only very weak support was found for any close relationship between Placozoa and Porifera, although in two LSU trees the Pla-cozoa grouped with the Calcarea spongeLeucosolenia. In addition, no support was found for Placozoa as the sister group of Ctenophora or as a secondarily reduced Cnidaria as suggested by Bridgeet al., 1995.
Our main results indicating that Placozoa and Cnidaria, or Placozoa and Cnidaria + Bilateria, are sister groups suggest that the very simple body architecture of Placozoa is misleading in relation to the phylogenetic posi-tion of Placozoa and that this group is likely to be the result of secondarily simplification from a more complex ances-tor. The phylogenetic relationships described by us were very similar to those found by Collinset al., (1998), which suggests that several similarities shared by Bilateria and Ctenophora should have evolved independently or were lost in Cnidaria and Placozoa. Placozoa and Cnidaria share Figure 1- Maximum likelihood large subunit (LSU) + small subunit
(SSU) tree. Bootstrap values (%) are shown at the nodes. Nodes without numbers indicate values below 50.
Table 3- Maximum likelihood tests ofa prioriphylogenetic hypotheses.
Hypotheses Kishino-Hasegawa test/Consel test1
Placozoa sister group to:
Small subunit (SSU)
Large subunit (LSU)
SSU + LSU
Bilateria 0.9316/0.515 0.3262/0.237 0.9028/0.559
Cnidaria 0.9416/0.532 0.4001/0.296 1.000/0.695
Ctenophora 0.0769/0.036* 0.4007/0.273 0.0721/0.036*
Cnidaria + Bilateria 1.000/0.576 0.1351/0.077 0.6182/0.343
Metazoa 0.0003*/0.002* 0.8278/0.544 0.0618/0.034*
1p-value of the approximately unbiased test.
presynaptic mediators that react with antibodies against the neuropeptide RFamide (Shuchert, 1993), supporting their close relationship. Moreover, the relationship Placozoa + Bilateria with bilaterianP. rubrabasal, as suggested by our data, may help to explain the histological similarity be-tween Placozoa, which posses three cell layers with an interspace like a mesenchyme (Grell and Ruthmann, 1991) and the acoelomorph flatworm that possess a central syncytium (Collinset al., 1998).
We suggest that the Placozoa is not the most basal Metazoa but is probably the sister group of Cnidaria and/or Bilateria. Although we have used a large dataset and a very diverse set of phylogenetic inference methods, as with other studies (e.g.Medinaet al.2001, Rokaset al., 2003), the relationships among most of the basal Metazoan phyla, including Placozoa, is still unresolved. Our results strengthen the scenario of a very rapid radiation for the ini-tial diversification of the Metazoa and a genomic approach might be necessary to resolve this fascinating issue.
Acknowledgments
We thank Dr. Günther Steinbrück (Tübingen Univer-sity) for sending us the culture ofTrichoplax adhaerens, Dr. Monica Medina (DOE Joint Genome Institute) for kindly providing us with their alignments and Felipe G. Grazziotin for helping in some analyses. We thank an anon-ymous referee for helpful comments and suggestions re-garding a previous version of this paper. Financial support was partially provided by The Brazilian agencies Conselho Nacional de Desenvolvimento Científico e Tecnológico (CNPq) and Fundação de Amparo à Pesquisa do Estado do Rio Grande do Sul (FAPERGS).
References
Adoutte A, Balavoine G, Lartillot N and Rosa R (1999) Animal evolution: The end of the intermediate taxa? Trends Genet 15:104-108.
Anderson FE and Swofford DL (2004) Should we be worried about long-branch attraction in real data sets? Investigations using metazoan 18S rDNA. Mol Phylogenet Evol 33:440-451.
Borchiellini C, Manuel M, Alivon E, Boury-Esnault N, Vacelet J and Le Parco Y (2001) Sponge paraphyly and the origin of Metazoa. J Evol Biol 14:171-179.
Bridge D, Cunningham CW, DeSalle R and Buss LW (1995) Class-level relationships in the phylum Cnidaria: Molecular and morphological evidence. Mol Biol Evol 12:679-689. Collins AG (1998) Evaluating multiple alternative hypotheses for
the origin of Bilateria: An analysis of 18S rRNA molecular evidence. Proc Natl Acad Sci USA 95:15458-15463. Collins AG (2002) Phylogeny of medusozoa and the evolution of
cnidarian life cycles. J Evol Biol 15:418-432.
Ender A and Schierwater B (2003) Placozoa are not derived cni-darians: Evidence from molecular morphology. Mol Biol Evol 20:130-134.
Glenner H, Hansen AJ, Sorensen MV, Ronquist F, Huelsenbeck JP and Willerslev E (2004) Bayesian inference of the meta-zoan phylogeny: A combined molecular and morphological approach. Curr Biol 14:1644-1649.
Grell KG and Ruthmann A (1991) Placozoa. In: Harrison FW and Westfall JA (ed), Microscopic Anatomy of Invertebrates. Wiley-Liss, New York, pp 13-27.
Guindon S and Gascuel O (2003) A simple, fast, and accurate al-gorithm to estimate large phylogenies by maximum likeli-hood. Syst Biol 52:696-704.
Halanych KM (2004) The new view of animal phylgeny. Annu Rev Ecol Evol Syst 35:229-256.
Hanelt B, Schyndel DV, Adema CM, Lewis LA and Loker ES (1996) The phylogenetic position ofRhopalura ophiocomae
(Orthonectida) based on 18S ribosomal DNA sequence anal-ysis. Mol Biol Evol 13:1187-1191.
Hudelot C, Gowri-Shankar V, Jow H, Rattray M and Higgs PG (2003) RNA-based phylogenetic methods: Application to mammalian mitochondrial RNA sequences. Mol Phylo-genet Evol 28:241-252.
Huelsenbeck JP and Ronquist F (2003) MrBayes 3: Bayesian phylogenetic inference under mixed models. Bioinformatics 19:1572-1574.
Kim J, Kim W and Cunningham CW (1999) A new perspective on lower metazoan relationships from 18S rDNA sequences. Mol Biol Evol 16:423-427.
Lemmon AR and Milinkovitch MC (2002) The metapopulation genetic algorithm: An efficient solution for the problem of large phylogeny estimation. Proc Natl Acad Sci USA 99:10516-10521.
Martinelli C and Spring J (2003) Distinct expression patterns of the two T-box homologues Brachyury and Tbx2/3 in the placozoan Trichoplax adhaerens. Dev Genes Evol. 213:492-499.
Martinelli C and Spring J (2004) Expression pattern of the homeo-box geneNotin the basal metazoanTrichoplax adhaerens. Gene Expr Patterns 4:443-447.
Martinelli C and Spring J (2005) T-box and homeobox genes from the ctenophore Pleurobrachia pileus: Comparison of
Brachyury, Tbx2/3and Tlx in basal metazoans and bila-terians. FEBS Letters 579:5024-5028.
Medina M, Collins AG, Silberman JD and Sogin ML (2001) Eval-uating hypotheses of basal animal phylogeny using com-plete sequences of large and small subunit rRNA. Proc Natl Acad Sci USA 98:9707-9712.
Medlin L, Elwood HJ, Stickel S and Sogin ML (1998) The charac-terization of enzymatically amplified eukaryotic 16S-like rRNA-coding regions. Gene 71:491-499.
Odorico DM and Miller DJ (1997) Internal and external relation-ships of the Cnidaria: Implications of primary and predicted secondary structure of the 5’-end of the 23S-like rDNA. Proc R Soc Lond B Biol Sci 264:77-82.
Posada D and Crandall KA (1998) MODELTEST: Testing the model of DNA substitution. Bioinformatics 14:817-818. Rokas A, King N, Finnerty J and Carroll SB (2003) Conflicting
phylogenetic signals at the base of the metazoan tree. Evol Dev 4:346-359.
Salisbury BA (1999) Strongest evidence: Maximum apparent phylogenetic signal as a new cladistic optimality criterion. Cladistics 15:137-149.
Sambrook J and Russell DW (2001) Molecular Cloning. A Labo-ratory Manual. Cold Spring Harbor, New York, 999 pp.
Shimodaira H and Hasegawa M (2001) Consel: For assessing the confidence of phylogenetic tree selection. Bioinformatics 17:1246-1247.
Shuchert P (1993)Trichoplax adhaerens(Phylum Placozoa) has cells that react with antibodies against the neuropeptide R famide. Acta Zoologica 74:115-117.
Schulze FE (1883)Trichoplax adhaerens, nov. gen., nov. spec. Zool Anz 6:92-97.
Swofford DL (2002) PAUP*. Phylogenetic Analysis Using Parsi-mony (*And Other Methods). Version 4.0b10. Sinauer As-sociates, Sunderland, Massachusetts.
Telford MJ, Lockyer AE, Cartwright-Finch C and Littlewood DTJ (2003) Combined large and small subunit ribosomal RNA phylogenies support a basal position of the acoelo-morph flatworms. Proc R Soc Lond B Biol Sci 270:1077-1083.
Thompson JD, Gibson TJ, Plewniak F, Jeanmougin F and Higgins DG (1997) The ClustalX windows interface: Flexible strate-gies for multiple sequence alignment aided by quality analy-sis tools. Nucleic Acids Research 24:4876-4882.
Voigt O, Collins AG, Pearse VB, Perase JS, Ender A and Hadrys H (2004) Placozoa-no longer a phylum of one. Curr Biol 22:R944-R945.