Fear and loathing in Las Vegas: Evidence from blackjack tables
Bruce I. Carlin
∗UCLA
David T. Robinson
Duke University
Abstract
This paper uses proprietary data from a blackjack table in Las Vegas to analyze how the expectation of regret affects peoples’ decisions during gambles. Even among a group of people who choose to participate in a risk-taking activity, we find strong evidence of an economically significant omission bias: 80% of the mistakes at the table are caused by playing too conservatively, resulting in substantial monetary losses. This behavior is equally prevalent among large-stakes gamblers and does not change in the face of more complicated strategic decisions.
Keywords: blackjack, gambling, omission bias, decision making.
1
Introduction
Much of modern economics is built on the premise that people maximize their expected utility for wealth when making decisions under uncertainty. In contrast, psychol-ogists argue that people often act not so much to maxi-mize their expected utility, but instead to minimaxi-mize their expected regret — that is, people make choices to min-imize their expected feeling of remorse when an action turns out badly compared to other alternatives (e.g., Kah-neman and Tversky, 1982). In some decision environ-ments, this can lead people to suboptimally favor inaction over action, inducing what is known as the omission bias (e.g., Ritov and Baron, 1990; Spranca et al., 1991).1
Inaction plays a salient role in a wide range of deci-sions. For example, people are reticent to vaccinate chil-dren with a potentially lethal vaccine, even when this risk pales in comparison to the incidence of death caused by the primary disease (Ritov & Baron, 1990; Asch et al., 1994). A staggering number of US households fail to rebalance their stock portfolios when it is optimal to do so (Campbell, 2006; Campbell, Calvet, & Sodini, 2009). Many US workers under-participate in their retirement plans, despite the presence of employer-matching pro-grams (Benartzi & Thaler, 2004). Shoppers are often re-luctant to make purchases when discounts are randomly offered in the market (Simonson, 1992).
Calibrating the impact of expected regret and the
omis-∗We thank Dan Ariely, Jonathan Baron, Shlomo Benartzi, Tony
Bernardo, Mark Grinblatt, Steve Heston, Rick Larrick, Cade Massey, Jeff Pontiff, Ed Rice, Andrei Shleifer, Richard Thaler, and seminar par-ticipants at the University of Pittsburgh for helpful comments. Any er-rors are our own.
1See also Landman (1987), Ritov and Baron (1992, 1995) and Baron
and Ritov (1994). Note that our use of the term “omission bias” does not distinguish omission bias from “default bias” (Johnson & Goldstein, 2003).
sion bias is challenging outside of an experimental setting because it requires parameterizing a complex set of be-liefs and controlling for risk aversion. In this paper, we study expected regret and the omission bias by analyzing actual play at a Blackjack table in Las Vegas. Blackjack has two important features that make it attractive for this purpose. First, setting aside the issue of card counting, it is easy to categorize optimal play in every conceivable situation and document departures from optimal play in an unambiguous way. This is because there is a well-publicized solution to the game, known as the Basic Strat-egy, that has been widely accessible to card players since the 1950s. Indeed, many card playing guides offer steps for learning the basic strategy. Second, and more impor-tantly, blackjack players place bets in the game before they make strategic decisions. Therefore, in all but a few situations, the bet is essentially a sunk cost once play be-gins, and the optimal strategy is independent of a player’s level of risk aversion.2 This fact allows us to identify the role of regret avoidance and inaction, independent of risk aversion.
The data consist of over 4,300 hands played in over 1,300 rounds of actual play in a Las Vegas casino. The data for our study were obtained from a pilot study of the Bally MP-21 Card and Chip Recognition System, originally designed by Mindplay Intelligent Games. The MP-21 system is optically based and tracks all bets and choices during play, capturing data in a covert and non-intrusive way. This allows us to record essential features of the game in a manner that leaves the natural play of the game is unaltered.
2This is true for the majority of decisions in the game, but as we
dis-cuss in detail below, it is not true when a player doubles down or splits a hand. In that case, the bet size is increased so we cannot disentangle risk aversion from other biases. We make this distinction in our empirical analysis.
Using this novel data source, we find strong evidence that an omission bias is present in the ex ante choices that card players make. When blackjack players make mis-takes, they are four times more likely to make the error of failing to act than they are to make the error of tak-ing an unnecessary (i.e., suboptimal) action. The relevant null hypothesis of zero omission bias would have errors of commission and omission occurring in proportion to how often players were optimally required to stand or take a card under the basic strategy. Even if we focus on areas of the strategy space that heavily favor action as an optimal strategy (leading to a high number of passive mistakes under the null), we can reject the null of zero omission bias with a high degree of confidence.
The economic magnitude of the omission bias is large. In aggregate, players in single-hand deals who followed the basic strategy won 48.1% of the time, very close to the theoretical win rate reported in Blackjack guides. De-viators won only 36.6% of the time, which is statistically significantly lower. A total of about $123,000 changed hands during the pilot study. Players that followed the basic strategy won a total of over $60,000, while they lost only about $56,000 following the basic strategy. In con-trast, only $3,000 was won, and over $6,000 lost in hands that deviated from the basic strategy. Of these, passive mistakes lost over $2 for every dollar won, while aggres-sive mistakes lost only about $1.50 for every dollar won. Therefore, passive mistakes are not only more common, they are more costly.
We consider alternative explanations (other than omis-sion bias) for the choices that we observe. The first ex-planation is that card counters are responsible for the de-viations from basic strategy. To explore this possibility, we systematically examine deviations from basic strat-egy and find no evidence that the deviations vary with the count in a manner prescribed by card counting strategies.3
We should also note that this is probably an unlikely ex-planation since the win rates among basic strategy devia-tors are so low and the economic losses are so high.
The second is that limited cognitive ability is driving our results. Indeed, it may be that some players find it difficult to remember the optimal choice in all situations. To control for this, we account for the strategic difficulty of certain situations (e.g., playing hands with soft versus hard totals). The idea here is that, if cognitive limitations make omission bias more prevalent, then it should be more pronounced among more difficult hands. We find, though, that the omission bias is not more pronounced among hands in which higher order thinking is required.4
3For brevity, this analysis is omitted from the paper but is available
from the authors.
4As we note, passive mistakes are more costly than active mistakes.
If limited cognition were indeed at the heart of our findings, we would expect people to spend more of their cognitive resources avoiding the
The third possible explanation is that players derive utility from continued play, and are thus reluctant to take an additional card if doing so might exclude them from participating in the rest of the round. To test this possibil-ity we account for the position of the player at the table and the number of players seated at the table. At large tables, we find no evidence that passive mistakes cluster disproportionately more among those who are high in the seat order at the table. Admittedly this does not com-pletely rule out the consideration of staying live in the hand; however, staying live does represent another source of expected regret. Indeed, if people were willing to sac-rifice expected winnings because they would feel remorse if they did not continue on in the game when they busted, this would further support our argument that expected re-gret impacts strategic decisions.
The analysis in this paper replicates and extends work by Keren and Wagenaar (1985), who used the game of Blackjack as a laboratory for understanding player’s atti-tudes about the game. They observed the complete his-tory of play of 112 subjects in an Amsterdam casino and conducted personal interviews of many of the players to learn their self-perceptions of how they make decisions. While they collected a rich data set and provided many insights, our analysis is distinct in that we focus on the omission bias and alternative explanations of this result.5
The casino is indeed an opportune place to study other aspects of human behavior and decision making. Sun-dali and Croson (2006) studied the hot hand bias and the gambler’s fallacy by analyzing videotapes of individuals who play roulette in a casino in Reno, Nevada. Public entertainment has also been a convenient venue of study, though in many instances it is difficult to disentangle re-gret avoidance from risk aversion or cognitive limitations. For example, Tenorio and Cason (2002) derive the sub-game perfect Nash equilibrium for a sub-game segment on the television show “The Price is Right” and document systematic deviations from the optimal strategy. The deviations are indeed consistent with an omission bias, risk aversion, and cognitive limitations, but determining which one is responsible for the observed behavior is gen-erally difficult.6
The rest of the paper is organized as follows. In Sec-tion 2, we review the rules of blackjack, discuss the Basic Strategy, and describe the data that were collected and used in the analysis. In Section 3, we explore the main findings. Section 4 provides some concluding remarks.
more expensive mistakes. This is clearly not what we find in the data.
5Keren and Wagenaar reported the basic result on p. 138 and
spec-ulated about its sources but obviously did not relate it to subsequent literature on omission bias.
6See also analysis of “Card Sharks” by Gertner (1993), “Jeopardy!”
2
The game of blackjack
In this section, we review the rules of Blackjack that were used in the particular casino in which the data were gath-ered. Then, given these specific rules we outline the op-timal strategy of play (Basic Strategy) and discuss how this gives rise to a number of variables that we use in our analysis.
2.1
Rules of play
2.1.1 Basic setup
A Blackjack table consists of one dealer and from one to six players. In our data, there are 111 rounds involving only a single player, and 57 hands involving exactly six players. Two-, three-, and four-player rounds each occur a little more than 300 times in our data, and there are 223 five-player rounds. In total, we have 4,394 hands played in 1,393 rounds.
During each round, the dealer deals from a pack con-sisting of six standard 52-card decks. As such, there are 24 aces, 72 face cards, and 24 of each of the numbered cards (2 through 10) in play. The numbered cards are worth their face value, the face cards are worth 10 each, and each ace is worth 1 or 11 at the discretion of the player. The entire pack is shuffled and a player is ran-domly chosen to insert a red plastic card within the deck, cutting the deck. The dealer then places the red card to-ward the bottom of the deck and play begins. During subsequent play, cards are dealt from the top until the red card is shown. When the red card is reached during a round, then that round of play completes without inter-ruption, the deck is reshuffled and the cycle begins again. Before any cards are dealt, each player places an initial bet. In our data, bet sizes range from $5 (occurring 381 times) to $1100 (occurring 10 times). The most common bet in our data is a $10 bet, which occurs 1,974 times.
After the initial bets have been placed, the dealer be-gins by dealing each player at the table (including him-self) one card face up, each in turn. This is followed by a second card face up for each of the players in turn, but the dealer’s second card is dealt face down. The dealer’s face-down card is referred to as the hole card. At this point, each player may choose between a variety of choices, as described below.
2.1.2 Players’ behavior
The object of the game for each player is to obtain a total greater than the total of the dealer’s cards in the game, but less than or equal to 21. If a player wishes to add cards, he or she may successively request an additional card from the dealer, which is dealt face-up for the other players to see. Each player may continue to take a hit as
long as the player’s total does not exceed 21, at which point the player “busts” and automatically loses the bet (even if the dealer eventually busts as well). Of course, the players (excluding the dealer) are not required to in-crease the number of cards in their hand (i.e., take a hit) and may opt to “stand” with any hand that totals less than or equal to 21.
Each player’s turn is exhausted before the next player has an opportunity to take a card, and the play moves around the table until all players have had the opportunity to make their decisions.
This sequence of action — bets placed first, followed by cards dealt — is one of the key features that make the game of Blackjack such an attractive setting for exploring regret. In the course of play described above, there is no scope for risk aversion to factor into a player’s strategy, since, at the time the player chooses a course of action, the bet is fixed. Thus, the best that the player can do is to maximize the odds that he or she receives a payout conditional on the fixed bet.
There are, however, some instances in which a player can alter an initial bet after the cards have been dealt. Af-ter the player is dealt two cards, he or she may opt to “double down” and receive one more card. If the player chooses to exercise this option, the bet is doubled and the player must stand after receiving the extra card. Dealer play and settlement is unchanged.
The second instance occurs when a player is dealt two cards of the same value (for example, two eights). Then the player has the option to split the pair, receive another card for each, and form two separate hands. The initial bet goes with one set, and a second bet of equal size is added to the other. The player plays each hand accord-ing to the rules already mentioned. Settlement and dealer play is unchanged, except that all naturals (see below) are treated as a normal 21 and do not payoff at 1.5 times the bet. A player splitting any pair except aces may opt to double down on either or both of the split hands.
Two other options that may exist in many casinos are the option to buy insurance and the option to surrender the hand. In the game that was played at the table at which the data were collected, there was no option to surrender the hand and there was no instance in which any of the players bought insurance. Therefore, rather than describe these options in detail here, we refer the reader to a stan-dard book on Blackjack (e.g., Tamburin, 1994).
2.1.3 Dealer’s play
strat-egy that deviate from one another. That is, there is no scope for appealing to a particular belief structure to de-termine whether a particular course of play was appropri-ate or not. The dealer effectively acts as an automaton, behaving as follows.
Once all of the players have made their decisions re-garding play, the dealer turns over their hole card. If the sum of the two cards is 17 or greater, the dealer stands without taking a card. If the sum of the two cards is less than or equal to 16, the dealer must take another card (take a hit). The dealer continues to take cards until the total exceeds 16. In the version of the game played in our data, dealers do not have the option to take more cards when their cards total 17 or greater with an ace counting as 11. That is, dealers may not hit on “soft 17.”
If the dealer’s total is between 17 and 21, the dealer compares his or her hands with the players who are still in the game (i.e., the players who did not bust). However, if the hand total exceeds 21, the dealer busts and loses to players who have totals of 21 or less.
This structure of play between the dealer and the play-ers creates a situation that is naturally conducive to study-ing the impact of regret on decisions under uncertainty. Since any player who busts is excluded from the settle-ment if the dealer later busts, this creates a natural heuris-tic that favors errors of omission. Namely, a player who is affected by regret is concerned with two scenarios ex post: the first is that the player took an extra card, busted, and then later learned that the dealer busted; the second is that the player stood too soon and learned that the dealer won. An omission bias associates lower regret with the latter outcome, since it was not caused by the willful ac-tion of the player (i.e., to take another card).
2.1.4 Settlement
As mentioned above, if a player’s total exceeds 21, the player automatically loses the initial bet. If the total is less or equal to 21 and exceeds the dealer’s total, the player wins and receives the initial bet plus an amount equal to the initial bet. If a player’s total is less than the dealer’s total, the player loses the initial bet. Finally, if the dealer and the player have equally strong hands (equal to-tals not exceeding 21), the hand is called a “push” and no money exchanges hands.
If a player receives an ace and either a face card or a ten (totaling 21) on the initial deal, he or she has a “black-jack” (a.k.a. a natural). As long as the dealer does not have a natural as well, the player receives a net payout from the dealer of 1.5 times the initial bet. Otherwise, the hand is a push. Note that acquiring more than two cards that total 21 does not constitute a natural.
From the structure of settlement, it is clear that there is no direct strategic interaction between the players — the
rules of the game do not pit one player against another, and one player’s victory does not preclude another player from also winning (except by affecting the cards that are available to draw). That is, holding constant the sequence of cards that were dealt, whether Player 1 wins or loses has no effect on the size of Player 2’s payoff. Moreover, it is never desirable to attempt to starve another player of a card, since this behavior has no impact on a player’s pay-off. A player’s payoff is determined only by the player’s own choices to take a hit or stand based on the cards that were dealt and the (common) knowledge of the dealer’s hand. This simple game structure makes it easy to at-tribute the observed patterns of play to the omission bias described above.
2.2
The basic strategy
Given the rules of the game as laid out above, there ex-ists a reasonably simple algorithm for maximizing one’s expected return given the cards a player is dealt and the knowledge of the dealer’s face-up card. This is known as the Basic Strategy. The strategy is basic in the sense that is does not require any attempt to recall the cards that have been played since the previous shuffle.
In this section, we describe the optimal play for Black-jack, given the rules listed in Section 2.1 and the absence of card counting. The optimal strategy for a one-deck game was first published by Baldwin, Cantey, Maisel, and McDermott (1956) and has since been extended to multi-ple decks and card-counting schemes (e.g. Thorp, 1962; Wong, 1994; Griffin 1999).
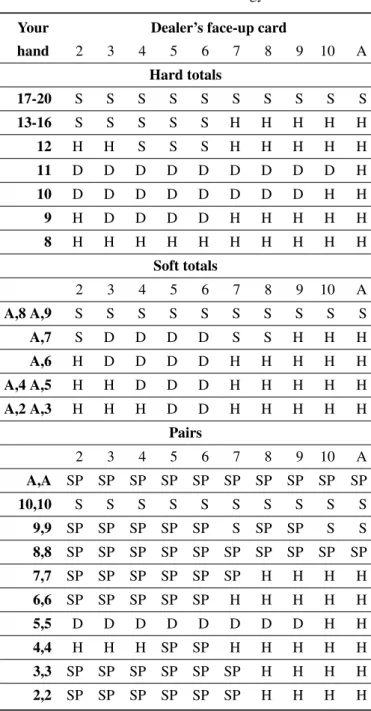
Table 1 describes the optimal strategy for the game we are considering. Each panel describes one strategic situ-ation for the player in question. The top panel describes optimal play when a player has a hard total: i.e., when the player is not dealt an ace or a pair, and therefore has no possibility to split the hand or to otherwise reclassify the value of the ace after receiving another card. Although the exact prescriptions of the Basic Strategy for hard to-tals are somewhat more complicated than this, the bulk of the Basic Strategy for hard totals can be communicated by four simple rules. The first is to never take a hit on a hand totaling seventeen or higher. The second is to never stand when the dealer shows seven or higher (provided the player’s total is sixteen or below). The third is never to stand below twelve. The fourth is never to take a hit when the dealer shows two through six.
Table 1: The basic strategy.
Your Dealer’s face-up card
hand 2 3 4 5 6 7 8 9 10 A
Hard totals
17-20 S S S S S S S S S S
13-16 S S S S S H H H H H
12 H H S S S H H H H H
11 D D D D D D D D D H
10 D D D D D D D D H H
9 H D D D D H H H H H
8 H H H H H H H H H H
Soft totals
2 3 4 5 6 7 8 9 10 A
A,8 A,9 S S S S S S S S S S
A,7 S D D D D S S H H H
A,6 H D D D D H H H H H
A,4 A,5 H H D D D H H H H H
A,2 A,3 H H H D D H H H H H
Pairs
2 3 4 5 6 7 8 9 10 A
A,A SP SP SP SP SP SP SP SP SP SP
10,10 S S S S S S S S S S
9,9 SP SP SP SP SP S SP SP S S
8,8 SP SP SP SP SP SP SP SP SP SP
7,7 SP SP SP SP SP SP H H H H
6,6 SP SP SP SP SP H H H H H
5,5 D D D D D D D D H H
4,4 H H H SP SP H H H H H
3,3 SP SP SP SP SP SP H H H H
2,2 SP SP SP SP SP SP H H H H
Basic strategy table for 3 or more decks, dealer stands on soft 17, double on any 2 cards, double after split allowed except on aces, and blackjack pays 3:2. Key: S = Stand, H = Hit, D = Double, SP = Split.
hands more complex. We will use this fact later to rule out cognitive limitation as an alternative explanation for the behavior that we observe.
The optimality of standing versus doubling down ver-sus taking a hit also depends on the relative value of this option as compared to the dealer’s likely strategy. With pairs, optimal play likewise requires the player to weigh
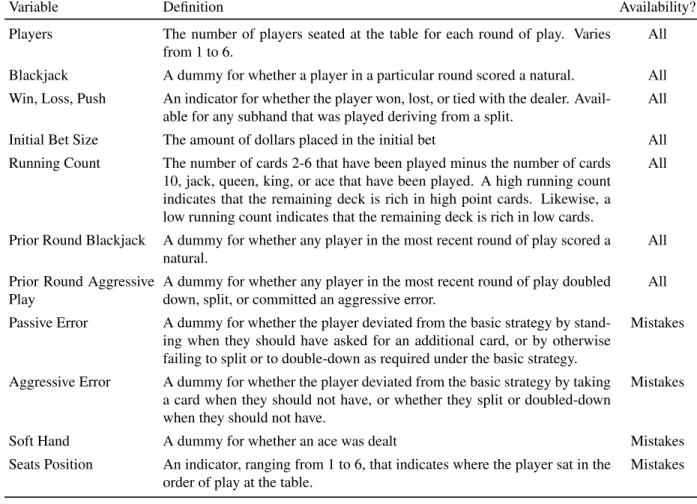
Table 2: Variables used in the analysis.
Variable Definition Availability?
Players The number of players seated at the table for each round of play. Varies from 1 to 6.
All
Blackjack A dummy for whether a player in a particular round scored a natural. All Win, Loss, Push An indicator for whether the player won, lost, or tied with the dealer.
Avail-able for any subhand that was played deriving from a split.
All
Initial Bet Size The amount of dollars placed in the initial bet All Running Count The number of cards 2-6 that have been played minus the number of cards
10, jack, queen, king, or ace that have been played. A high running count indicates that the remaining deck is rich in high point cards. Likewise, a low running count indicates that the remaining deck is rich in low cards.
All
Prior Round Blackjack A dummy for whether any player in the most recent round of play scored a natural.
All
Prior Round Aggressive Play
A dummy for whether any player in the most recent round of play doubled down, split, or committed an aggressive error.
All
Passive Error A dummy for whether the player deviated from the basic strategy by stand-ing when they should have asked for an additional card, or by otherwise failing to split or to double-down as required under the basic strategy.
Mistakes
Aggressive Error A dummy for whether the player deviated from the basic strategy by taking a card when they should not have, or whether they split or doubled-down when they should not have.
Mistakes
Soft Hand A dummy for whether an ace was dealt Mistakes Seats Position An indicator, ranging from 1 to 6, that indicates where the player sat in the
order of play at the table.
Mistakes
This table describes the variables that are provided in the data as well as the ones that we are able to construct. The column “Availability” indicates whether a variable is available for all hands, or rather for errors only.
that provides a proxy for players’ skill and/or memory. We discuss these and other variables below.
2.3
Our data
The data consist of 4,394 Blackjack hands played accord-ing to the rules defined in Section 2.1 duraccord-ing a pilot test of the MP-21 Card and Chip Recognition System designed by Mindplay Intelligent Games.7 The data that we ob-tained are proprietary and provide only a partial glimpse into the actions of the players who participated during the study. We were given a unique identification number for each round played at the table and the number of players at the table. We also have specific information about how the players at the table played the game, but we cannot follow particular players through time because we were not given identifiers such as names or codes that would allow us to evaluate the play of particular individuals.
7We excluded 156 hands from the initial data set that were
inter-rupted during play. Including these hands has no effect on our analysis.
Table 2 provides a complete list of the variables that we can glean from the data. For each player, we know the size of the initial bet, whether the player doubled down or split, and whether the player won, lost, or pushed. In cases where hands were split, we know the outcome of each hand. We also know whether they deviated from the basic strategy, and the nature of the deviation if it occurred. Specifically, we know the cards that the de-viator held, the dealer’s face-up card, and the incorrect action that the deviator took. In addition, we also know the running count at the beginning of each round.8
Im-portantly, however, we do not know the cards played by each player: we know a particular sequence of play only when it resulted in a deviation from the basic strategy.
Since we do not have unique player identifiers, we do not have any information on player demographics. With-out player identifiers, it is impossible to track an
individ-8The running count is usually calculated as the number of low cards
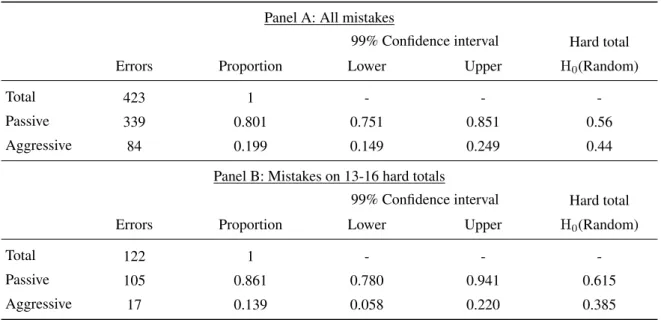
Table 3: Calibrating the null hypothesis: This table reports the mean rate of passive and aggressive errors among the 423 hands in which a player deviated from the basic strategy and compares those proportions to what would be expected by chance alone. Lower and Upper 99% confidence intervals are the lower and upper bounds on the 99% confidence intervals around the proportions listed. The column labeled “Hard TotalH0(Random)” reports the
proportion of passive and aggressive mistakes that would occur if mistakes were equiproportional at each node of the hard totals region of the basic strategy diagram presented in Table 1. In Panel A, all 423 errors in the data are considered. In Panel B, we focus only on the errors where the player had a 13-16 and held a hard total. Thus, in Panel B, the Hard Total null is adjusted to reflect only the odds in that portion of the basic strategy table: 20 possible nodes at which standing is optimal, versus the 32 possible nodes at which taking a card is optimal.
Panel A: All mistakes
99% Confidence interval Hard total Errors Proportion Lower Upper H0(Random)
Total 423 1 - -
-Passive 339 0.801 0.751 0.851 0.56
Aggressive 84 0.199 0.149 0.249 0.44
Panel B: Mistakes on 13-16 hard totals
99% Confidence interval Hard total Errors Proportion Lower Upper H0(Random)
Total 122 1 - -
-Passive 105 0.861 0.780 0.941 0.615
Aggressive 17 0.139 0.058 0.220 0.385
ual’s play from one round to the next. Therefore we fo-cus instead on whether particular types of play occurred in a particular round. This weakens our ability to iden-tify either rebound or contagion, since we cannot be sure that a particular player did not leave the table, nor can we know if new players arrived. At the same time, it is com-monplace for would-be players to observe play at a table before taking a seat. Thus, it is reasonable to assume that all players seated are at least partly aware of recent play at the table when a round begins.
Finally, although we have the running count, we do not know when the pack is re-shuffled. This makes a precise calculation of the true count from the running count impossible. (The true count is the running count di-vided by the number of decks remaining before the shoe is reshuffled.) The sine qua non for identifying card coun-ters would be to look for variation in bet size that varied strategically with the true count. In unreported analysis, we have verified that two tell-tale signs of card coun-ters are absent: first, variation in initial bet size is not explained by time varying features of play at the table; second, deviations from the basic strategy do not covary with the running count in a manner prescribed by card counting strategies (e.g., Baldwin et al, 1956, or Wong,
1994). Finally, as we note in the introduction, players who deviate from the basic strategy lose far more often than players who follow the basic strategy, which is un-likely to be consistent with the presence of card counters.
3
The omission bias
3.1
How often
should
passive mistakes
oc-cur?
Table 3 answers this question in two ways. First, we put 99% confidence intervals around the sample propor-tions obtained in our data. These indicate that we can re-ject with 99% confidence any null hypothesis that corre-sponds to a 25:75 or higher proportion of active to passive errors. Indeed, if we focus on the hard totals section of the basic strategy table, we see that aggressive mistakes would account for approximately 44% of all mistakes if their occurrence only depended on the relative frequency of nodes at which optimal play requires standing or tak-ing card. This implies a 44:56 ratio of active to passive errors, which is well outside the 99% confidence interval for the proportions we observe.
Alternatively, we can focus on the hard total region of the table where a player holds between 13 and 16. This region is a natural region to focus attention because it ac-counts for about 1/3 of all errors, and the optimal strategy is simply hit or stand depending on the dealer’s up card. In this region, there are 20 cells that require standing, and 32 cells that require taking a card (7 through ace includes eight cards, including the jack, queen and king).
Aggressive errors should, therefore, account for about 38.5% of all errors in the region if they were driven purely by chance. We see that in the data they only account for about 14% of errors. A 99% confidence interval around this proportion spans from 5.8% to 22%, well below the 38.5% that would be suggested by chance alone.
Thus, our main result is not only that passive errors are four times more likely than aggressive errors, but that this is strong evidence of omission bias. It is easy to reject the null hypothesis that the high proportion of passive errors we see in the data is driven purely by the relatively low odds of being asked to make a passive choice optimally.
3.2
A closer look at omission bias
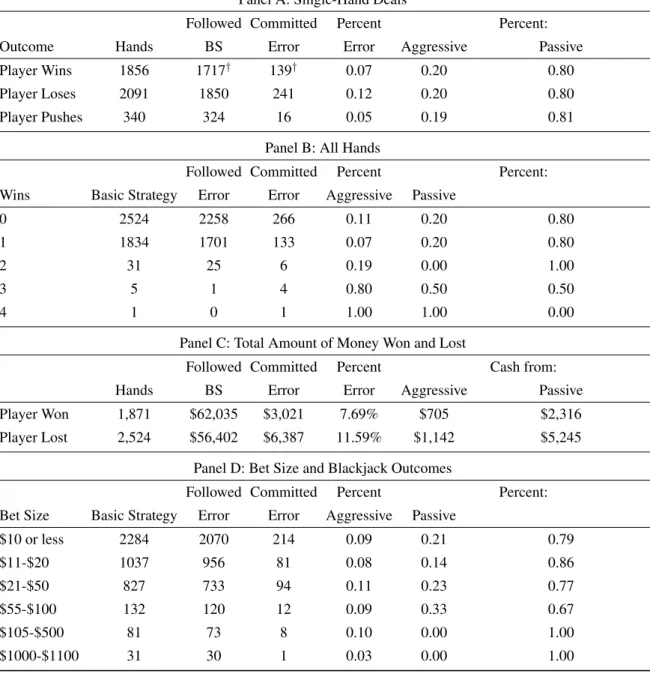
Table 4 expands on this result by analyzing the mistakes in greater detail. In Panel A, we focus on single-hand deals: that is, deals in which players did not split their hand into two or more hands. It shows that 1,856 hands out of a total of 4,287 single-hand deals resulted in wins. Among players who followed the basic strategy, the win-ning percentage is 48.1%, which is statistically much higher than the 37% experienced by those who deviated from the basic strategy (the associated t-statistic for the difference in means is over 4 in absolute value).
Panel A also illustrates the first-order result: approxi-mately 80% of all deviations from the Basic Strategy in-volve passive mistakes; ones in which the player should have taken an extra card and did not, ones in which the player should have split or doubled down but did not. Only one mistake in five involves players behaving overly aggressively. In panel B we no longer restrict attention to single-hand deals, but also include deals in which the
player (rightly or wrongly) split. In a handful of cases, the player splits more than twice, but in general the ba-sic fact that passive errors are much more common than aggressive errors holds regardless of the number of hands played (or won).
Panel C illustrates the economic consequences of win-ning, losing, and deviating from the basic strategy. Of the 1,872 winning hands, all but a little over 7% followed the basic strategy. $62,035 was won by players following the basic strategy, while $56,402 were lost in the 2,104 los-ing hands that followed the basic strategy. Thus, the ratio of monetary losses to wins is 0.9. In contrast, the 7% of hands that won while deviating from the basic strategy won a total of $3,021. About 12% of losing hands devi-ated from the basic strategy, losing a total of $6,387. This is a loss-to-win ratio of 2.11. Or to put it slightly differ-ently, those who followed the basic strategy won about $1.23 per hand for every dollar lost per hand. In con-strast, deviators won about 80 cents per hand for every dollar per hand lost.
3.3
What about alternative explanations
for the omission bias?
The remainder of Table 4 demonstrates that this basic fea-ture of the data is robust to a variety of alternative expla-nations for the omission bias.
One possible explanation for the omission bias is that it stems from bounded rationality. That is, could the omis-sion bias be driven by hands that are in some sense harder to play because they involve a more subtle understanding of the optimal strategy? To examine this possibility, we also considered whether the omission bias is more severe among soft hands — hands in which the player is dealt an ace, which can either be played as a high card (for a value of 11) or a low card (for a value of 1). There is no statistically discerning difference in the frequency of basic strategy deviations between hard and soft hands.
Table 4: A closer look at blackjack mistakes. Panel A: Single-Hand Deals
Followed Committed Percent Percent: Outcome Hands BS Error Error Aggressive Passive Player Wins 1856 1717† 139† 0.07 0.20 0.80
Player Loses 2091 1850 241 0.12 0.20 0.80 Player Pushes 340 324 16 0.05 0.19 0.81
Panel B: All Hands
Followed Committed Percent Percent: Wins Basic Strategy Error Error Aggressive Passive
0 2524 2258 266 0.11 0.20 0.80
1 1834 1701 133 0.07 0.20 0.80
2 31 25 6 0.19 0.00 1.00
3 5 1 4 0.80 0.50 0.50
4 1 0 1 1.00 1.00 0.00
Panel C: Total Amount of Money Won and Lost
Followed Committed Percent Cash from: Hands BS Error Error Aggressive Passive Player Won 1,871 $62,035 $3,021 7.69% $705 $2,316 Player Lost 2,524 $56,402 $6,387 11.59% $1,142 $5,245
Panel D: Bet Size and Blackjack Outcomes
Followed Committed Percent Percent: Bet Size Basic Strategy Error Error Aggressive Passive
$10 or less 2284 2070 214 0.09 0.21 0.79
$11-$20 1037 956 81 0.08 0.14 0.86
$21-$50 827 733 94 0.11 0.23 0.77
$55-$100 132 120 12 0.09 0.33 0.67
$105-$500 81 73 8 0.10 0.00 1.00
$1000-$1100 31 30 1 0.03 0.00 1.00
†Note: Players that follow the basic strategy in our data win 48.1% of the time, and deviators win 36.6% of the time. The win rate among basic strategy followers in our data is very close to that observed widely in Blackjack manuals, for example Baldwin et al (1956).
The second variant, however, provides a viable expla-nation for omission bias. It suggests that players may prefer sins of omission to sins of commission if they de-rive utility from being seated in active play at the table throughout the entirety of the round. That is, players may favor omission bias if they simply wish to be in play when the dealer plays his hand.
To test for this possibility, we begin in Table 5 by an-alyzing the distribution of passive and aggressive errors
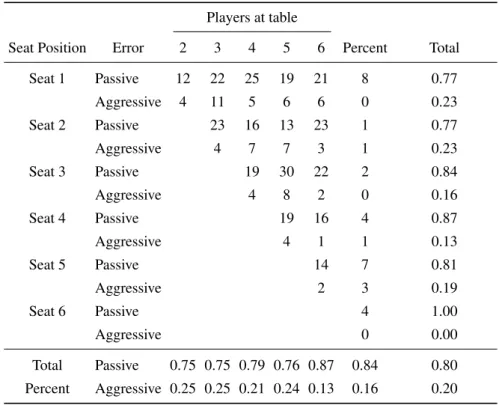
Table 5: Do passive mistakes reflect anticipation?: Seat position evidence
Players at table
Seat Position Error 2 3 4 5 6 Percent Total
Seat 1 Passive 12 22 25 19 21 8 0.77 Aggressive 4 11 5 6 6 0 0.23 Seat 2 Passive 23 16 13 23 1 0.77 Aggressive 4 7 7 3 1 0.23 Seat 3 Passive 19 30 22 2 0.84 Aggressive 4 8 2 0 0.16
Seat 4 Passive 19 16 4 0.87
Aggressive 4 1 1 0.13
Seat 5 Passive 14 7 0.81
Aggressive 2 3 0.19
Seat 6 Passive 4 1.00
Aggressive 0 0.00
Total Passive 0.75 0.75 0.79 0.76 0.87 0.84 0.80 Percent Aggressive 0.25 0.25 0.21 0.24 0.13 0.16 0.20
Notes: The top number is the sum total of passive errors that occurred in Seat Position X at a table with Y players at the table. The bottom number is the sum of aggressive errors.
bias, then we would expect to see passive errors cluster disproportionately among low seat positions, since these players would face the longest time to wait before learn-ing the ultimate outcome of the game. But we do not. As the right-most column of Table 5 shows, the distribution of passive and aggressive errors is roughly uniform across seat positions.
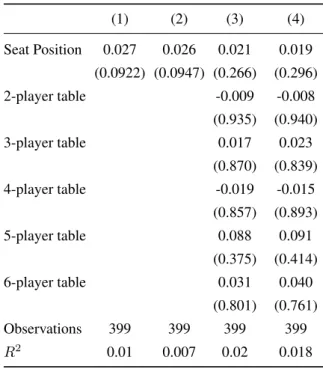
Rather than assuming that anticipation varies across players at a particular table, it may be the case that av-erage anticipation is higher at a larger table. The bot-tom row of Table 5 provides some evidence in favor of this hypothesis, since it shows that large tables contain more passive errors than small tables. Of course, since in some sense each seat represents a draw from a bernoulli distribution of passive/aggressive errors, this simply may reflect a mechanical relation between table size and omis-sion bias. Nevertheless, we extend our analysis in Table 6 by attempting to predict passive errors by seat position alone. In the first two columns we model passive errors as a function of the seat order. Model 1 is a probit speci-fication, while model 2 is a linear probability model. The second two columns predict passive errors with seat posi-tion using dummies for table size. By including table-size dummies, the point estimate on seat position is identified
only by variation in seat position within tables of a cer-tain size. Again, model 3 is a probit specification, while model 4 is a linear probability model. Table 6 contains no evidence that seat position predicts passive mistakes. The models reported in this table are robust to including dum-mies for seat position, including a dummy for whether the person making the mistake was seated just before the dealer.
Of course, as we discussed in the introduction, we can-not entirely rule out “staying live” in the hand as an ex-planation for the behavior that we observed. That is, peo-ple may be willing to sacrifice the expected value of their hand to minimize the regret that they might experience if they bust and miss the experience of continued play. Since this is indeed an additional source of expected re-gret, this would further support our argument that antici-pated regret and omission bias affect strategic decisions.
4
Concluding Remarks
com-Table 6: Predicting passive mistakes with seat position.
(1) (2) (3) (4)
Seat Position 0.027 0.026 0.021 0.019 (0.0922) (0.0947) (0.266) (0.296) 2-player table -0.009 -0.008
(0.935) (0.940) 3-player table 0.017 0.023
(0.870) (0.839) 4-player table -0.019 -0.015
(0.857) (0.893) 5-player table 0.088 0.091
(0.375) (0.414) 6-player table 0.031 0.040
(0.801) (0.761) Observations 399 399 399 399
R2
0.01 0.007 0.02 0.018
Notes: Observations are included only if they are devi-ations from the basic strategy. The dependent variable in each regression is a dummy for whether the mistake was passive. Seat position is a variable that takes on values 1 through 6 depending on where the person sat at the table, with seat 1 being the furthest seat from the dealer in a n-hand round. Variables labelled “x-player table” are fixed effects for table size, which in turn identify the seat position variable by variation within tables of the same size, rather than across tables of dif-ferent sizes. Columns (1) and (3) are probit specifi-cations in which coefficients are reported as marginal probabilities. Columns (2) and (4) are linear probabil-ity model specifications. The constant terms estimated in Columns (2) and (4) are not statistically distinguish-able from 0.80.
mission. This profound omission bias occurs in spite of the fact that real economic agents are making real deci-sions with their own money, reaping the rewards of skill and good luck, suffering the costs of bad luck and mis-takes.
Perhaps few decisions of economic consequence are made at a Blackjack table. Nevertheless, the underlying mechanism here — choosing between acting or not acting in an economic environment with uncertain payoffs — is present in many economic problems, such as planning for retirement, searching for a job, or starting a business. In-deed, the findings from our field study are striking when one considers that Blackjack players are not a random
sample of economic agents: they have self-selected into the game of Blackjack based on their willingness — in-deed, desire — to bear risk. The conservatism that we identify at a Blackjack table is all the more severe when we consider this self-selection issue. And of course, un-like Blackjack, everyday economic problems that involve the decision to act typically also involve risk, ambiguity and other behavioral factors. Exploring the broader eco-nomic implications of omission bias in more complicated settings where multiple biases interact remains an impor-tant question for future research.
References
Asch, D., Baron, J., Hershey, J., Kunreuther, H., Meszaros, J., Ritov, I., & Spranca, M. (1994). Omis-sion bias and pertussis vaccination. Medical Decision Making, 14, 188–123.
Baldwin, R., Cantey, W., Maisel, H., & McDermott, J. (1956). The optimum strategy in blackjack.Journal of the American Statistical Association, 51, 429–439. Baron, J., & Ritov, I. (1994). Reference points and
omis-sion bias. Organizational Behavior and Human Deci-sion Processes, 59, 475–498.
Bernartzi, S. & Thaler, R. (2004). Save more tomorrow: Using behavorial economics to increase employee sav-ings.Journal of Political Economy, 112, S164–S187. Berk, J., Hughson, E., & Vandezande, K. (1996). The
price is right, but are the bids? An investigation of rational decision theory. American Economic Review, 86, 954–970.
Campbell, J. (2006). Household finance. Journal of Fi-nance, 61, 1553–1604.
Campbell, J., Calvet, L., & Sodini, P. (2009). Fight or flight? Portfolio rebalancing by individual investors.
Quarterly Journal of Economics, 124, 301–348. Gertner, R. (1993). Game shows and economic behavior:
Risk-taking on “Card Sharks.” Quarterly Journal of Economics, 108, 507–521.
Griffin, P. (1999). Beat The Theory of Blackjack: The Complete Card Counter’s Guide to the Casino Game of 21, 6th Edition, Huntington Press, Las Vegas, Nevada. Johnson, E. J., & Goldstein, D. (2003). Do defaults save
lives?Science, 302, 1338–1339.
Kahneman D., & Tversky, A. (1982). The psychology of preferences.Scientific American, 246, 160–173. Keren G., & Wagenaar, W. (1985). On the psychology of
playing blackjack: Normative and descriptive consid-erations with implication for decision theory. Journal of Experimental Psychology: General, 114, 133–158. Landman, J. (1987). Regret and elation following action
Metrick, A. (1995). A natural experiment in Jeopardy!.
American Economic Review, 85, 240–253.
Post, T., Van Den Assem, M., Baltrussen, G., & Thaler, R. (2008). Deal or no deal? Decision making under risk in a large-payoff game show.American Economic review, 98, 38–71.
Ritov, I., & Baron, J. (1990). Reluctance to vaccinate: Omission bias and ambiguity. Journal of Behavioral Decision Making, 3, 263–277.
Ritov, I., & Baron, J. (1992). Status-quo and omission biases.Journal of Risk and Uncertainty, 5, 49–61. Ritov, I., & Baron, J. (1995). Outcome knowledge,
re-gret, and omission bias. Organizational Behavior and Human Decision Processes, 64, 119–127.
Simonson, I. (1992). The influence of anticipating regret and responsibility on purchase decisions. Journal of Consumer Research, 19, 105–118.
Spranca, M., Minsk, E., & Baron, J. (1991). Omission and commission in judgement and choice. Journal of Experimental Social Psychology, 27, 76–105.
Sundali, J., & Croson, R. (2006). Biases in casino bet-ting: The hot hand and the gambler’s fallacy.Judgment and Decision Making, 1, 1–12.
Tamburin, H. (2002). Blackjack: Take The Money and Run, 9th Printing, Research Services Unlimited, Casino Gambling Book Publisher, Greensboro, NC. Tenorio, R., & Cason, T. (2002). To spin or not to spin?
Natural and laboratory experiments from “The Price Is Right.”Economic Journal, 112, 170–195.
Thorp, E. (1962). Beat The Dealer: A Winning Strat-egy for the Game of Twenty One. Vintage Books, New York.