Automated Localization of Optic Disc in Retinal
Images
Deepali A. Godse
Department of Information Technology Bharati Vidyapeeth’s College of Engineering for Women
Pune, India
Dr. Dattatraya S. Bormane
Principal, Rajarshi Shahu College of Engineering Pune, India
Abstract—An efficient detection of optic disc (OD) in colour retinal images is a significant task in an automated retinal image analysis system. Most of the algorithms developed for OD detection are especially applicable to normal and healthy retinal images. It is a challenging task to detect OD in all types of retinal images, that is, normal, healthy images as well as abnormal, that is, images affected due to disease. This paper presents an automated system to locate an OD and its centre in all types of retinal images. The ensemble of steps based on different criteria produces more accurate results. The proposed algorithm gives excellent results and avoids false OD detection. The technique is developed and tested on standard databases provided for researchers on internet, Diaretdb0 (130 images), Diaretdb1 (89 images), Drive (40 images) and local database (194 images). The local database images are collected from ophthalmic clinics. It is able to locate OD and its centre in 98.45% of all tested cases. The results achieved by different algorithms can be compared when algorithms are applied on same standard databases. This comparison is also discussed in this paper which shows that the proposed algorithm is more efficient.
Keywords—disease; healthy; optic disc; retinal image
I. INTRODUCTION
Study of colour fundus images is considered to be the best diagnostic modality available till date as it is reliable, non-invasive and easy to use. It allows recording the diagnostic data and enabling the ophthalmology consultation afterwards. For a particularly long time, automatic diagnosis of retinal diseases from digital fundus images has been an active research topic in the medical image processing community.
Fig. 1 shows the retinal fundus image with main anatomical structures. The retina is an interior surface of eye which acts as the film of eye. It converts light rays into electrical signals and sends them to the brain through the optic nerve. Optic nerve is the cable connecting the eye to the brain. OD is the bright region within the retinal image. It is the spot on the retina where the optic nerve and blood vessels enter the eye. Macula is responsible for our central vision and colour vision. The fovea is an indentation in the centre of the macula. This small part of our retina is responsible for our highest visual acuity. The vascular network is a network of vessels that supply oxygen, nutrients and blood to the retina.
An important prerequisite for automation is the accurate localization of the main anatomical features in the image. An accurate and efficient detection of these structures is a significant task in an automated retinal image analysis system.
Fig. 1. Retinal Fundus Image With Main Anatomical Structures
Once these locations are known, a frame of reference can be established in the image. The OD localization is important for many reasons. Some of them are mentioned here.
The automatic and efficient detection of the position of the OD in colour retinal images is an important and fundamental step in the automated retinal image analysis system [1], [2].To successfully find abnormal structures in a retinal image, it is often necessary to mask out the normal anatomy from the analysis. An example of this is the OD, an anatomical structure with a bright appearance, which should be ignored when detecting bright lesions. The attributes of OD are similar to attributes of hard exudates in terms of colour and brightness. Therefore it is located and removed during hard exudates detection process, thereby avoiding false positives.
OD detection is the main step while developing automated screening systems for diabetic retinopathy and glaucoma. OD boundary and localization of macula are the two features of retina necessary for the detection of exudates and also knowing the severity of the diabetic maculopathy [3]. In case of diabetic maculopathy lesions identification, masking the false positive OD region leads to improvement in the performance of lesion detection.
The OD has an inner portion called the optic cup. The optic cup is always smaller than the disc and the relative size of one to the other is called the cup disc ratio. The cup disc ratio (CDR) ranges from 0.1 to 0.5 [4], [5]. Specifically, this is an important indicator for glaucoma [6].
uniform; certain types of abnormalities more often occur in specific areas of the retina [7]. The position of a lesion relative to the major anatomy could thus be useful as a feature for later analysis. It is used as prerequisite for the segmentation of other normal and pathological features by many researchers. The position of OD can be used as a reference length for measuring distances in retinal images, especially for the location of macula. In case of blood vessel tracking algorithms, the location of OD becomes the starting point for vessel tracking.
The OD, fovea, blood vessel bifurcations and crosses can be used as control points for registering retinal images [8]. The registration of retinal images is an important step for super-resolution and image change detection. Unique feature points within image are used as control points for registration. OD is an unique anatomic structure within retinal image. These methods play major role in automatic clinical evaluation system. When feature based registration algorithms are used, the accuracy of the features themselves must be considered in addition to the accuracy of the registration algorithms [9]. OD acts as landmark feature in registration of multimodal or temporal images.
Location of the retinal OD has been attempted by several researchers recently. According to S. Sekhar et al., the OD is usually the brightest component on the fundus, and therefore a cluster of high intensity pixels will identify the OD location [10].
Sinthanayothin et al. [11] presented a method to detect the location of the OD by detecting the area in the image which has the highest variation in brightness. As the OD often appears as a bright disc covered in darker vessels, the variance in pixel brightness is the highest there. They also presented method for the detection of the macular centre. They used a template matching approach in which the template was a Gaussian blob. The search area was constricted by the fact that the macular centre was assumed to be in the darkest part of the image approximately 2.5 times the OD diameter from the OD [12]. In macula localization the approximate distance between OD and macula is used as a priori knowledge for locating the macula [13].
A method based on pyramidal decomposition and Handoff-distance based template matching was proposed by Lalonde et al. [14]. The green plane of the original image was sub-sampled and the brightest pixels in this sub-sampled image were selected as candidate regions. An edge detector was used on the candidate regions in the original image. Next, multiple circular templates were fit to each of the regions using the Hausdorff-distance as a distance measure. The centre of the fitted circular template was taken as the OD centre.
Sopharak et al. [15] presented the idea of detecting the OD by entropy filtering. After pre-processing, OD detection is performed by probability filtering. Binarization is done with Otsu’s algorithm [16] and the largest connected region with an approximately circular shape is marked as a candidate for the OD.
Hoover et al. [17] described a method based on a fuzzy voting mechanism to find the OD location. In this method the
vasculature was segmented and the vessel centrelines were obtained through thinning. After removal of the vessel branches, each vessel segment was extended at both ends by a fuzzy element. The location in the image where most elements overlap was considered to be the OD.
Ravishankar et al. [18] tried to track the OD by combining the convergence of the only thicker blood vessels initiating from it and high disk density properties in a cost function. A cost function is defined to obtain the optimal location of the OD that is a point which maximizes the cost function.
Niemeijer et al. [19] defines a set of features based on vessel map and image intensity, like number of vessels, average width of vessels, standard deviation, orientation, maximum width, density, average image intensity etc. The binary vessel map obtained [20] is thinned until only the centerlines of the vessels remain and all the centerline pixels that have two or more neighbors are removed. Next, the orientation of the vessels is measured by applying principal component analysis on each centerline pixel on both sides. Using the circular template of radius 40 pixels having manually selected OD center within the radius, all features are extracted for each sample location of the template including distance d to the true centre. To locate OD, a sample grid is overlaid on top of the complete field of view and features vector are extracted and location of OD is found containing pixels having lowest value of d.
Improved results on the same dataset were reported by Foracchia et al. [21]. They described a method based on the global orientation of the vasculature. A simple geometrical model of the average vessel orientation on the retina with respect to the OD location was fitted to the image.
Li et al. [22] presented a model based approach in which an active shape model was used to extract the main course of the vasculature based on the location of the OD. Next, the information from the active shape model was used to find the macular centre.
Huajun Ying et al. [23] utilized fractal analysis to differentiate OD area from other large and bright regions in retinal images due to the fact that the OD area is the converging point of all major vessels.
Hiuiqi, Chutatape [22], C. Sinthanayothin et al. [11] used PCA (Principal Component Analysis) method for OD detection. The accuracy of PCA algorithm is based on number of training images used for matching intensity pattern. Major drawback of PCA algorithm is that the time complexity of this algorithm is very high.
This paper presents a novel algorithm for OD localization. The proposed algorithm ensembles the steps based on different principles and produces more accurate results. First we estimated threshold using green channel histogram and average number of pixels occupied by OD. Applying this threshold, all bright regions within image called clusters are detected. Then we applied two different criteria on these clusters, a: area criterion and b: density criterion. The details about this are discussed in further sections. Once the candidate cluster for OD is identified, the brightest oculus criterion is applied to locate the centre of OD.
The contribution of this work is that we propose an automatic system to locate an OD not only in normal, healthy images but also in images affected because of diseases such as diabetic retinopathy and images of poorer quality. There are more chances of false OD detection in images affected due to diseases and images of poor quality than desirable. The problem with retinal images is that the quality of the acquired images is usually not good. As the eye-specialist does not have complete control over the patient’s eye which forms a part of the imaging optical system, retinal images often contain artifacts and/or are of poorer quality than desirable [24]. Despite controlled conditions, many retinal images suffer from non-uniform illumination given by several factors: the curved surfaces of the retina, pupil dilation (highly variable among patients) or presence of disease among others [25]. However, our system avoids detecting false OD applying different criteria based on different principles. We tested proposed system on 453 retinal images which include normal (healthy) as well as abnormal (affected) retinal images. We are able to locate OD in 98.45% of all tested cases. Once the OD is located accurately, its centre is also located accurately.
II. MATERIAL AND METHODS
Database used for OD localization is as shown in Table I.
TABLE I DATABASE USED FOR OD LOCALIZATION
Sr. No. Test Database Number of Images
1 Diaretdb0 130
2 Diaretdb1 89
3 Drive 40
4 Walimbe Eye Clinic, Pune (M.S.),
India 34
5 Bhagali Clinic and Nursing Home,
Pune (M.S.), India 160
Thus, a set of 453 retinal images is studied for automated localization of OD and its centre.
A. Proposed Algorithm for Detection of Candidate Region for OD
Step 1: Estimate Threshold.
Step 2: Apply Threshold and identify bright regions. Step 3: Select candidate regions which satisfy area
criterion.
Step 4: Select candidate region which satisfies density criterion.
Step 5: If no candidate region is selected, reduce threshold.
Step 6: If threshold is greater than zero, apply steps 2 through 5.
Step 7: Stop.
The major steps in the algorithm are discussed in detail here.
1) Threshold estimation
In normal, healthy retinal images, OD is mostly the brightest region. However, in retinal images affected due to diseases such as diabetic retinopathy, there may exist other bright regions in addition to OD. So first we detected all bright regions within retinal images. In paper by Li and Chutatape [22], they used the highest 1% gray levels in intensity image to obtain threshold value to detect candidate bright regions. However, there is possibility of not detecting OD as candidate region if highest 1% gray levels are occupied by other bright regions within image.
Siddalingaswamy P.C. et al. [1] used iterative threshold method to estimate threshold for OD detection. This criterion is also not applicable to all types of retinal images.
Green channel image shows better contrast than red channel or blue channel image. It is observed that OD appears most contrasted in the green channel compared to red and blue channels in RGB image. Therefore, only the green channel image is used for the effective thresholding of the retinal image. So, we estimated threshold considering green channel histogram. Optimal thresholding method divides the pixels of the image in two groups: group A and group B such that group A contains pixels at least equal to the number of pixels occupied by the OD.
OD size varies from person to person. It is a vertical oval, with average dimensions of 1.76mm horizontally by 1.92mm vertically [26]. Its width and height are 1/8 and 1/7.33 of retinal image diameter, respectively [27]. Thus, it is possible to determine the number of pixels occupied by the OD as :
(1)
where D is the diameter of the retinal image in pixels. To obtain an optimal threshold, the histogram derived from the source image is scanned from highest intensity value to the lowest intensity value. The scanning stops at intensity level T when scanned pixels are greater than the estimated OD pixels and there is a 10% rise in pixel count between two consecutive intensity levels. Thus, the optimal threshold is calculated as follows :
Step1 : Initialize i = 255 and sum = 0 Step2: sum = sum + H[i]
Step3: i = i 1
Step4: if sum count or
[i-1] [i]
where H[i] indicates the histogram of the source image and i indicates the intensity level.
Fig. 2 illustrates some examples of candidate clusters determined by this algorithm.
Original image 1 (b) Candidate clusters in (a)
(c) Original image 2 (d) Candidate clusters in (c)
(e) Original image 3 (f) Candidate clusters in (e)
(g) Original image 4 (h) Candidate clusters in (g)
Fig. 2. Examples of candidate clusters
2)Area criterion
The optimal threshold when applied to the image results in one or more isolated connected regions (clusters). Each of the cluster in the thresholded image is labeled and total number of pixels in each cluster are calculated. The clusters having more than 125% or less than 10% of the OD area are discarded. This criterion minimizes the possibility to miss the OD from the selected candidate clusters. Fig. 3 illustrates some examples of candidate clusters resulted after application of area criterion.
(b)
(c) (d)
Fig. 3. Examples of resulted candidate clusters after area criterion
3) Density criterion
The density criterion is applied to clusters which have already satisfied the area criterion. According to the density criterion, if the ratio of number of pixels occupied by cluster to the number of pixels occupied by rectangle surrounding the cluster is less than 40%, the cluster is discarded. From the remaining clusters the cluster having highest density is considered to be the primary region of interest. Fig. 4 illustrates some examples of candidate clusters resulted after application of density criterion.
(b)
(c) (d)
Fig. 4. Examples of resulted candidate clusters after density criterion
below to reduce the threshold and entire process is repeated with this threshold.
(2)
Fig. 5 shows the result of candidate cluster resulted after application of reduced threshold algorithm.
Fig. 5. Result of reduced threshold algorithm
B. Localization of Centre of an OD
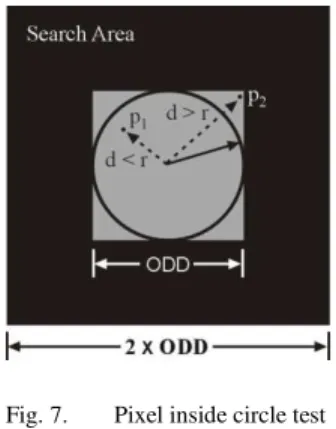
The cluster which occupies OD is located in algorithm discussed above. The centroid of this cluster is determined using calculus method. A search area is defined around this centroid such that this centroid is center of the search window. This search window is a square window with side equal to twice of OD diameter (ODD).
A circular window called an oculus of radius ODD/2 is moved across the search area. This is illustrated in Fig. 6. The maximum intensity oculus is identified using procedure given here.
Fig. 6. Circular window for OD detection
Each pixel within the square window of side equal to ODD is tested for its distance (d) from the centre of the window. As shown in Fig. 7, if the distance, d is less than or equal to the radius r (radius of the oculus), it is considered as inside pixel. The total intensity of the oculus is calculated by adding squares of intensities of all inside pixels. It can be expressed mathematically as,
{ ∑ ∑
where √( - ) ( - ) and is the centre of an oculus
The centre of maximum intensity oculus is marked as a centre of OD.
Fig. 7. Pixel inside circle test
There may be more than one window of same maximum total intensity. In this case, the central window amongst the same intensity windows is the resultant window and the centre of the resultant window is considered as a centre of an OD. Fig. 8 illustrates some examples of centre of OD.
(b)
(c) (d)
Fig. 8. Examples of centre of OD
III. RESULTS
TABLE II RESULTS OF PROPOSED OD LOCALIZATION METHOD
Test database Images OD Detected % Accuracy
Diaretdb0 130 126 96.92
Diaretdb0 89 86 96.62
Drive 40 40 100
Walimbe Eye Clinic, Pune 34 34 100 Bhagali Clinic and
Nursing Home 160 160 100
Total 453 446 98.45
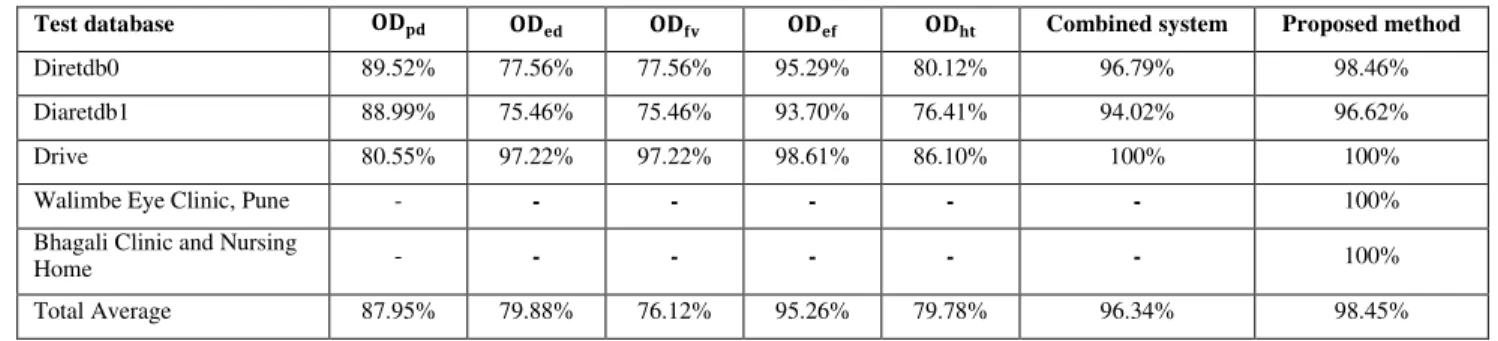
TABLE III COMPARISON OF RESULTS OBTAINED USING DIFFERENT METHODS
Test database Combined system Proposed method
Diretdb0 89.52% 77.56% 77.56% 95.29% 80.12% 96.79% 98.46%
Diaretdb1 88.99% 75.46% 75.46% 93.70% 76.41% 94.02% 96.62%
Drive 80.55% 97.22% 97.22% 98.61% 86.10% 100% 100%
Walimbe Eye Clinic, Pune - - - - - - 100%
Bhagali Clinic and Nursing
Home - - - - - - 100%
Total Average 87.95% 79.88% 76.12% 95.26% 79.78% 96.34% 98.45%
A. Comparison of results obtained using different methods
Rashid Jalal Qureshi et al. [28] discussed different OD detection algorithms and OD percentage detection rate in each case using standard databases. Table III summarizes the percentage accuracy achieved applying each algorithm discussed in this paper and proposed algorithm.
: Based on pyramidal decomposition [14] : Based on edge detection [14]
: Based on feature vector and uniform sample grid [19], [20]
: Based on entropy filter [15]
: Based on Hough transformation [18]
We can easily conclude observing Table III that proposed method gives better accuracy in localizing OD compared to other methods. Rashid Jalal Qureshi et al. [28] mentioned that performance of the methods listed in columns 2 through 6 of Table III is generally good, but each method has situations, where it fails. These methods fail on a difficult data set i.e., the diseased retinas with variable appearance of ODs in terms of intensity, colour, contour definition etc. The criteria used in the proposed algorithm are determined by considering abnormality of retinal images and hence provides better accuracy in localizing OD as shown in the last column of Table III.
IV. DISCUSSION AND CONCLUSION
An automated method has been presented which is able to locate an OD in retinal images. The results show that the system is able to locate the OD accurately in 98.45% of all tested cases. The percentage of successful detection of OD is increased using method presented in this paper.
The method of OD localization is tested on retinal images and qualitatively valuated by comparing the automatically segmented OD with manual ones detected by an experienced ophthalmologist. Original detection of OD leads towards the development of a fully automated retinal image analysis system to aid clinicians in detecting and diagnosing retinal diseases. Compared to the approaches by other researchers, our algorithm for OD detection has the advantage that it is applicable to all types of retinal images, healthy as well as abnormal, affected due to disease and/or acquisition process.
The work in this paper is carried out for control point detection which is an important step for registration of retinal images. As the OD and its centre are located accurately, macula and its centre can be detected accurately. OD, macula and vascular network are unique anatomical structures of retinal image. So centre of OD, centre of macula and bifurcation points of vascular network can be used as control points for registration of retinal images. The bifurcation points within retinal images which are to be registered can be co-related by checking their distances from centre of OD and centre of macula. The accurate registration of retinal images can be further used for retinal image change detection and super-resolution.
ACKNOWLEDGMENT
We are thankful to Dr. Tejaswini Walimbe, DO, DNB (OPHTH), FAEH, Consultant Eye Surgeon, Glaucoma and Medical Retina Specialist, Walimbe Eye Clinic and Dr. Meenakshi Bhagali, M.S., Eye Specialist, Bhagali Clinic and Nursing Home, Pune for providing retinal image database.
We are grateful to Dr. Deepa Mujumdar, Ophthalmologist, Bharati Hospital, Pune for her valuable guidance and suggestions.
REFERENCES
[1] Siddalingaswamy C , Gopalakrishna rabhu K , “Automatic localization and boundary detection of optic disc using implicit active
contours”, Internation Journal of Computer Applications, vol. 1, no. 7, pp. 1-5, 2010.
[2] Michael D. Abramoff, Meindert Niemeijer, “The automatic detection of the optic disc location in retinal images using optic disc location
regression”, Conf roc IEEE Eng Med Biol Soc , 1: pp 44 2- 4435, 2006.
[3] Jaspreet Kaur, Dr Sinha, “Automated localization of optic disc
and macula from fundus images”, International Journal of Advanced
Research in Computer Science and Software Engineering, vol. 2, Issue 4, pp. 242-249, April 2012.
[4] Healey PR, Mitchell P, Smith W, Wang JJ, “Relationship between cup-disc ratio and optic cup-disc diameter”, the Blue Mountains Eye Study, Aust N Z J Ophthalmol.; 25 Suppl 1:S99-101, May 1997.
[5] The American Academy of Ophthalmology, The eye MD Association, San Francisco, CA 94120-7424.
[6] Gopal Datta Joshi, Jayanthi Sivaswamy, “Optic disc and cup boundary detection using regional information”, Arvind Eye Care System, Madurai, India.
[7] J Tang, S Mohr, YD Du and TS Kern, “Non-uniform distribution of lesions and biochemical abnormalities within the retina of diabetic
humans”, Current Eye Res , vol.27, no.1, pp. 7-13, 2003.
Toke Sonnenburg Ottesen and Sille Petersen, “Automatic algorithm for segmentation, registration and fusion of digital fundus retinal images
from patients suffering from diabetic retinopathy”, Aalborg University,
SEMCON, 21, Dec. 2007.
[9] R.J. Radke, Srinivas Andra, Omar Al-Kofahi, Badrinath Roysam,
“Image change detection algorithms: A systematic survey”, IEEE Transactions on Image Processing, vol. 14, no. 3, March 2005.
[10] S. Sekhar, W. Al-Nuaimy and A K Nandi, “Automated localization of retinal optic disc using Hough transform”, pp 1577-1580, IEEE 2008. [11] C. Sinthanayothin, J Boyce, Cook and T Williamson, “Automated
localization of the optic disc, fovea and retinal blood vessels from digital color fundus images, Br J Ophthalmol, 83: pp. 902-910, Feb. 1999. [12] Meindert Niemeijer, Michael D. Abramoff, Bram Van Ginneken,
“Segmentation of the optic disc, macula and vascular arch in fundus
photographs”, IEEE Transactions on medical Imaging, vol.26, no.1, pp. 116-127, January 2007.
[13] Siddalingaswamy C , Gopalakrishna rabhu K , “Automated detection of anatomical structures in retinal images”, 7th IEEE International Conference on computational intelligence and multi-media applications, vol. 3, pp. 164-168, 2007.
[14] M Lalonde, M Beaulieu and Langis Gagnon, “Fast and robust optic disc detection using pyramidal decomposition and Hausdorff-Based
Template Matching”, vol. 20, No.11, pp. 1193-2001, Nov. 2001. [15] Sopharak A., Thet New K., Aye Moe Y., N. Dailey M., Uyyanonvara B.,
“Automatic exudate detection with anaive bayes classifier”, International Conference on Embedded Systems and Intelligent Technology, Bangkok, Thiland, pp. 139-142,2008.
[16] N. Otsu, "A threshold selection method from gray-level histograms," IEEE Transactions on Systems. Man, and Cybernetics, vol. 9, pp 62-66, January 1979.
[17] A oover and M Goldbaum, “Locating the optic nerve in a retinal image using the fuzzy convergence of the blood vessels”, IEEE Trans Med. Image, vol. 22, no.8, pp. 951-958, Aug-2003.
[18] S Ravishankar, A Jain, A Mittal, “Automated feature extraction for early detection of diabetic retinopathy in fundus images”, IEEE Conference on Computer Vision and Pattern Recognition, pp. 210-217, 2009.
[19] M Niemeijer, M D Abramoff, B Van Ginneken, “ Fast detection of the optic disc and fovea in color fundus photographs, Medical Image Analysis, 13, pp. 859-870, 2009.
[20] M. Niemeijer, J.J. Staal, B. Van Ginneken, M. Loog, M.D. Abramoff,
“Comparative study of retinal vessel segmentation methods on a new publically available database”, SPIE Medical Imaging, 5370, pp. 648-656, 2004.
[21] M. Foracchia, E. Grison and A. Ruggeri, “Detection of optic disk in
retinal images by means of geometrical model of vessel structure”, IEEE
Trans. Med. Image, vol. 23, no.10, pp. 1189-1195,Oct 2004.
[22] Li and O Chutatape, “Automated feature extraction in color retinal images by a model based approach”, IEEE Trans Biomed Eng , vol. 51, no.2, pp. 246-254, Feb 2004.
[23] Huajun Ying, Ming Zhang and Jyh-Charn Liu, “Fractal-based automatic
localization and segmentation of optic disc in retinal images”, IEEE
Proc. of the 29th Annual International conference of the IEEE EMBS, France.
[24] Geoff Dougherty, “Medical image processing techniques and applications”, Springer.
[25] Deepali A. Godse and Dr. Dattatraya S. Bormane, “Automated localization of centre of optic disc and centre of macula in retinal images”, CiiT International Journal of Biometrics and Bioinformatics, vol. 4, no. 16, pp. 896- 901, Nov 2012.
[26] Bob Zhang and Fakhry Karray, “Optic disc detection by multi-scale Gaussian filtering and with scale production and vessels directional
match filter”, Medical Biometrics: Second International Conference, ICMB 2010, Hong Kong, pp. 173-180, 2010.
[27] Seng Soon Lee, Mandava Rajeswari and Dhanesh Ramachandram,
“ reliminary and Multi Features Localisation of Optic Disc in Colour Fundus Images”, National Computer Science ostgraduate Colloquium, Malaysia, 2005
[28] Rashid Jalal Qureshi, Laszlo Kovacs, Balazs Harangi, Brigitta Nagy, Tunde eto, Andras ajdu, “Combining algorithms for automatic detection of optic disc and macula in fundus images”, Elsevier, Computer Vision and Image Understanding, vol. 116, Issue 1, pp. 138-146, Jan 2012.
AUTHORS PROFILE
Deepali A. Godse was born in Pune (M.S.) in India on March 20, 1971. She is a PhD student in Computer Engineering, Bharati Vidyapeeth Deemed University, Pune. She received her B.E. in Industrial Electronics from Pune University in 1992. She completed her M.E. in Computer Engineering in 2003. Her research interests include image processing, computer graphics and multimedia.
She is currently working as a Head of Information Technology
Department in Bharati Vidyapeeth’s College of Engineering for Women
affiliated to Pune University. She has 19 years experience in teaching as a Lecturer, Assistant Professor, Associate Professor and Head of Department. She has written books in the field of Computer graphics, Computer Organization and Digital Electronics. She is a life member of ISTE.