Printed in Brazil - ©2004 Sociedade Brasileira de Química 0103 - 5053 $6.00+0.00
Article
* e-mail: [email protected]
Assessment of Lipid Compounds and Phosphorus in Mangrove Sediments of Santa Catarina
Island, SC, Brazil
Luciana Mater, Marcelo R. Alexandre, Fabrício A. Hansel and Luiz A. S. Madureira*
Departamento de Química, Universidade Federal de Santa Catarina, 88040-900 Florianópolis - SC, Brazil
Lipídios provenientes de sete estações sedimentares foram usados para avaliar fontes de matéria orgânica em dois manguezais localizados na Ilha de Santa Catarina, SC. O manguezal de Ratones encontra-se em uma área de preservação permanente, com pouca influência humana. Em contraste, o manguezal do Itacorubi tem sofrido sérios impactos por atividades antrópicas devido à sua proximidade da cidade de Florianópolis. Os maiores níveis de carbono orgânico (2,13 mmol g-1) e
fósforo total (14,9 µmol g-1) foram encontrados em Ratones. Entretanto, o percentual de fósforo
inorgânico determinado no manguezal de Itacorubi (84%) foi maior do que o de Ratones (58%), possivelmente devido à contaminação urbana. A importância do aporte de esgoto doméstico para o manguezal do Itacorubi foi avaliada a partir da concentração do coprostanol que variou, em média, de 7,7 ng g-1 em Ratones para 1,42 µg g-1 no Itacorubi. Esse nível elevado é compatível com valores
encontrados em outros ambientes contaminados.
Lipid compounds from seven sedimentary stations were used to assess sources of organic matter in two mangrove ecosystems located on Santa Catarina Island, southern Brazil. Ratones Mangrove forms part of a national preservation area and has suffered only minimal human influence. Itacorubi Mangrove has been seriously impacted by anthropogenic activities due to its proximity to the city of Florianopolis. Higher levels of total organic carbon (2.13 mmol g-1) and total phosphorus
(14.9 µmol g-1) were found in Ratones Mangrove sediments. However, sediments from Itacorubi
showed a greater percentage of inorganic phosphorus (84%) than those from Ratones (58%), which can be related to urban contamination. The importance of sewage outfalls into the tidal creeks crossing Itacorubi Mangrove was clearly seen as the concentration of coprostanol averaging 7.7 ng g-1 in Ratones sediments was found to be as high as 1.42 µg g-1 in Itacorubi, which is comparable to
other sewage contaminated hydrosystems.
Keywords: sediments, mangrove, Ratones, Itacorubi, phosphorus, coprostanol
Introduction
The presence of lipid compounds in sediments has been widely used as a proxy to evaluate possible sources of organic matter. Of particular relevance to estuaries are
organic compounds such as ketones, sterols, n-alkanols,
n-alkanes, fatty acids and hydroxy acids.1-3 However, it is
well known that the correlation to a specific living organism is rather difficult and other biogenic parameters (e.g. C, N, and P) may be used for the assessment of specific
source.4-6 Mangrove sediments, for instance, are of great
complexity due to the tidal influx of allochthonous organic matter and also the input of terrigenous debris from local
vegetation.6,7 Thus, it is important to employ as many
parameters as possible to evaluate the dominant indicators
for terrestrial and aquatic inputs. Apart from natural contributions, mangroves are also susceptible to inputs of pollutants from diffuse sources. In most coastal areas, mangroves are an important receptor of such pollutants, from the atmosphere, continental runoff and tidal currents. Several studies have already emphasized the great importance of the mangroves located on Santa Catarina Island as natural habitats and food sources for many
crustaceans, fishes, birds and even reptiles and mammals.8,9
Our contribution was to analyze biogenic parameters as well as organic compounds in sediment samples taken from two
mangrove ecosystems: Ratones and Itacorubi. Sterols, n
-alkanes and n-alkanols are the principal compound classes
may also originate from new syntheses within the sediments and from secondary transformation products arising from
bioconversion of primary sterols.10 C
28 and C29 desmethyl
sterols in sediments that are believed to originate predominantly from vascular plants include: campesterol
(24-methyl-5-cholesten-3β-ol), β-sitosterol (24α
-ethyl-5-cholesten-3β-ol), and stigmasterol (24α-ethyl-5,
(22E)-cholestadien-3β-ol).11 In spite of these compounds being
commonly used as tracers of continentally derived organic matter inputs into marine systems, inferences drawn from sterol distributions regarding terrigenous vs. marine sources
of organic matter must be made with caution.10,12,13 Animals
are thought to be unable to synthesize sterols containing an
alkyl chain at the C-24 position.14,15 However, lower fungal
classes are known to synthesize a variety of C28 and C29
sterols.14 In contrast to the C
28 – C29 sterols, C27 sterols are
mainly assigned to planktonic sources, including
zooplankton and other aquatic fauna.10 Cholesterol
(cholest-5-en-3β-ol) is the major sterol of crustacea and other
zooplankton, and originates from bioassimilation and
conversion of dietary phytosterols.14 Some phytoplanktons,
principally dinoflagellates, also synthesize small quantities
of cholesterol directly.16 In addition to exogenous input,
cholesterol and other C27 sterols in sediments may also be
synthesized by some benthic animals, principally polychaetes, echinoderms and bivalves, as well as fungi
and some protozoa,15 or can be produced as transformation
products of C28 – C29 sterols. C27 sterols may also arise from
the bioconversion of dietary C28 and C29 sterols, by
dealkylation of the sterol side chain at C-24.15 Cholesterol
is of particular interest, not only because it is the main sterol commonly detected in sediments but also because it can
generate another important sterol: coprostanol (5β
-cholestan-3β-ol). Coprostanol and other stanols
(ring-saturated sterols) are primarily microbial transformation
products of sterols containing ∆5 double bonds,17 or of
steroidal ketone intermediates.18 Stanols are an important
component of particulate material. Within sediments, stanols may be produced during sterol degradation by free-living bacteria associated with organic detritus, and by enteric bacteria within the guts of benthic macrofauna. Coprostanol has been considered as a potential indicator of water/
sediment contamination by sewage.19,20 Quantitative results
for this compound in both mangrove environments will be discussed.
The within-class distributions of long-chain (> C20)
n-alkanes, n-alkanoic acids and n-alkanols are often used
to infer terrestrial input into sediments.21,22 These
compounds are abundant in plant epicuticular waxes,23
but long-chain n-alkanes and n-alkanoic acids can also be
found in marine algae.24-26
Materials and Methods
Study area
Mangroves are subject to regular or occasional inundation by water of riverine, estuarine, or oceanic origin. Waters inundating mangroves regularly can have a salinity up to 35‰ without adversely impacting the function of mangroves, as long as the trees are protected from wave action and strong currents. Mangroves are best developed in tropical climates, where the coldest winter
temperature is above 20 oC and temperatures are fairly
constant throughout the year. Soils are generally fine-grain, rich in organic matter and periodically waterlogged. Mangroves have salt-tolerant trees that grow most prolifically along low-lying depositional coasts and deltas, where the substrate is predominantly clay and silt rather than sand. This suggests the importance of river-borne nutrients and organic matter in fueling the productivity of mangrove wetlands, since nutrients and organic materials
often are adsorbed onto sediment particles.6,27
In Santa Catarina State, southern Brazil, mangroves
cover 175 km of the coast representing 17% of the littoral.28
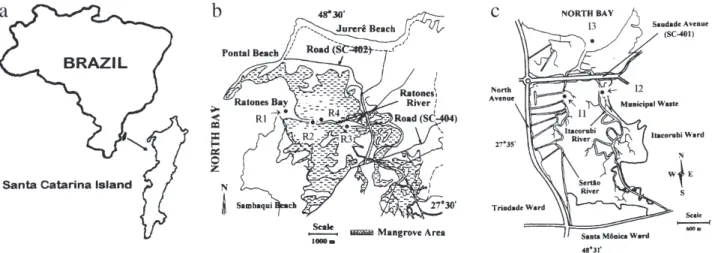
Santa Catarina Island (Figure 1a), where the state capital Florianópolis is located, has five major mangrove areas. Ratones Mangrove is located approximately 30 km
northwest of the city center with a total area of 6.25 km2
(Figure 1b). It is part of Carijós Biological Reserve and has restricted access with no human activities allowed. It presents chemical and biological characteristics which are particularly well preserved, and thus serves as a useful
template for comparisons.29 In contrast to Ratones
Mangrove, Itacorubi Mangrove is surrounded by the city of Florianópolis and has been undergoing progressive loss of habitat for the past 30 years (Figure 1c), with less than
2.0 km2 of mangrove forests left, equivalent to 25% of its
original dimensions.9 Part of the mangrove was cut to build
a deposit of municipal waste, condominiums and highways. Artificial channels have also been dredged by the municipal government. Sewage treatment is insufficient in the area and untreated wastes are discharged
directly into the creeks crossing the mangrove area.8,9
Sample collection
glass jars and a stainless steel spatula. The location of each sampling station is shown in Figures 1b and 1c. All
samples were immediately immersed in CH2Cl2 (2 mL),
stored in previously-combusted (450 oC) glass jars, sealed
with aluminum foil-lined lids and kept frozen until freeze-dried in the laboratory.
Bulk parameters
Immediately prior to lipid extraction, the storage solvent was evaporated and the sediment freeze-dried (Edwards F105) under vacuum and homogenized by griding. Aliquots were taken for elemental analyses.
Samples were decarbonated using 0.5 mol L-1 HCl solution.
Total organic carbon (TOC) and nitrogen were measured using a Carlo Erba EA1110 CHNS-O analyzer after being centrifuged, washed with deionized water and gently dried at 60 oC.
Particle size distribution
Sample from all stations were taken for granulometric
analyses following the procedure described by Suguio.30
Phosphorus analysis
From each station, two subsamples of 0.1 g of dried sediment each were used for phosphorus analyses. One subsample was initially placed into a furnace for 1 hour at
500 oC. After that, both subsamples were then shaken with
10 mL of 1.0 mol L-1 HCl solution (2x) for 1 h on a shaker.
After centrifugation (6000 rpm, 10 min), the liquid phase
was placed in a Teflon® digestor. Phosphorus extracted
from the calcinated fraction is considered to be the total phosphorus (TP) and phosphorus extracted from the second treatment, with no calcination, the inorganic phosphorus (IP). Both fractions were digested for 4 h with 1.6 mL of
potassium persulphate and 4.5 mol L-1 sulphuric acid
solution at 80 oC. TP and IP fractions were determined as
orthophosphate using the acidic molybdate-ascorbic acid
method31 modified by Koroleff.32 The organic fraction (OP)
was obtained by the difference TP – IP. Procedural blanks did not reveal any contamination.
In order to evaluate the extraction efficiency of our method for phosphorus analysis (TP), a certified estuarine sediment sample (NIST, SRM1646a) was also analyzed. The result obtained is not significantly different from the TP certified (t-student, P<0.05, n=5).
Analytical procedure
Lipids were extracted from the remaining freeze-dried samples for analysis. From each station, around 20 g of sediment were placed in glass tubes. The extractable lipids were obtained by successive extraction of the sediment
with a mixture of CH2Cl2:CH3OH (2:1, v/v, 1x) and CH2Cl2
(2x), by ultra-sound for 20 min each. A solvent/sediment ratio of approximately 3:1 was used. Extracts were combined and rotary evaporated to just dryness. Lipids
were then taken up in 2 mL of CH2Cl2 and passed through
a Pasteur pipette minicolumn containing 1 g of combusted
Na2SO4 to remove any residual water.33 Lipid isolations
were performed in a glass column (0.5 cm i.d. x 4 cm effective length) filled with previously activated alumina
Figure 1. Map of sites for all samples analyzed in this study. (a) Santa Catarina Island localization; (b) Ratones Mangrove. Location of sampling
(2 g, top part of the column) and silica (2 g, lower part).34
The lipid extract was fractionated into three fractions using solvents of increasing polarity: F1 eluted with 18 mL
hexane (hydrocarbons), F2 eluted with 20 mL CH2Cl2
(PAHs, aldehydes and ketones) and F3, containing the
sterols and n-alkanols, eluted with 25% methanol in ethyl
acetate. This latter fraction was treated with urea adduct to
separate n-alkanols and sterols. Each fraction was
transferred to small vials (2 mL) and stored frozen at
–18 oC until analysis by gas chromatography (GC) and
gas chromatography - mass spectrometry (GC - MS). Immediately before GC and GC – MS analyses, sterols and
n-alkanols were converted to trimethylsilylether
derivatives using bis(trimethylsilyl)-trifluoroacetamide
(BSTFA). A known amount of 5α-cholestane was added to
fractions F1 and F3 (adduct and non-adduct sub-fractions) as an internal standard. Individual compounds were quantified from gas chromatographic peak areas by comparison with the area of the internal standard.
GC analyses were carried out on a model 17A Shimadzu GC fitted with a split/splitless injetor and a flame
ionization detector. Temperatures: capillary injection port
300 °C, detector 320 °C. Injection mode: manual (1 µL)
splitless (inlet purge on for 0.5 min) with a split flow 1:40.
The column was a DB-1 capillary column of 30 m x 0.25 µm
i.d. and 0.25 mm film thickness, with the following oven
temperature program: 50 - 180 °C at 10 °C min-1,
150-310 °C at 4 °C min-1, with a 15 min isotherm at 310 oC. N
2
was used as the carrier gas.
Data acquisition and processing were performed on a Shimadzu CLASS-GC10 integrator. GC – MS analyses
(EI mode, 70 eV; mass range 40 – 550 Daltons; 2.0 scan s-1)
were carried out on a Shimadzu QP2000A MS interfaced to a model 14A Shimadzu GC. Conditions for GC – MS analyses were as for GC except that He was used as the carrier gas. Identification of the compounds was based on comparing the gas chromatographic retention times of some peaks with those of authentic standards and by characteristic mass fragmentograms. Structural assignments
were achieved by comparison with mass spectra published in the literature.
Results and Discussion
Elemental composition
Biogenic parameters and molar ratios for both locations are listed in Table 1. In Ratones Mangrove sediments, TOC values vary by a factor of 5.8, with
maximum content at station R1 (2.13 mmol g-1; < 3%),
which is the highest value measured in both mangrove
environments. Minimum content (0.37 mmol g-1) occurs
at station R2. In Itacorubi Mangrove sediments, TOC values do not show a considerable range, remaining between 1.49
and 1.87 mmol g-1. The range of TOC values is consistent
with those reported in other mangrove ecosystems and
subtropical estuaries.35 In Ratones TP ranges from 3.33 to
14.9 µmol g-1 and, in Itacorubi, from 3.23 to 4.21 µmol g-1.
The highest values of TP and TOC were found at the same station (R1). It is possible that the greater difference between maximum and minimum TOC at Ratones occurs because of the distinct locations from where the samples were taken (Figure 1b). Station R1 at the Ratones River mouth is a shoal formed by mud and silt deposition which enhances the accumulation of organic carbon, nitrogen and phosphorus. In contrast, station R2 is nearly 1 km upriver and is under the influence of the tidal currents of the river, leading to a lower accumulation of organic matter. Molar TOC/TP ratios range from 111 to 163 in Ratones Mangrove sediments. Stations R2 and R4 (111 and 120, respectively) have values nearer the expected Redfield ratio of 106 for recent marine organic matter whereas higher values are seen for stations R1 and R3 (143 and 163,
respectively).36 The other two ratios shown in Table 1 also
suggest a mix of terrestrial and fresh marine organic matter of close to Redfield proportions for Ratones Mangrove sediments (TOC/N and N/TP averages 9 and 15, respectively). It has been established that C:P and N:P
Table 1. Bulk sediment parameters and molar ratios at the Ratones and Itacorubi mangrove stations
Station TOC N TP OP IP TOC/TP TOC/N N/TP
(mmol g-1) (mmol g-1) (µmol g-1) (µmol g-1) (µmol g-1) (molar) (molar) (molar)
R1 2.13 0.26 14.90 6.12 8.78 143 8 1 7
R2 0.37 0.04 3.33 1.43 1.90 111 9 1 2
R3 1.94 0.22 11.90 5.20 6.70 163 9 1 8
R4 0.81 0.09 6.76 2.63 4.13 120 9 1 3
I 1 1.87 0.24 3.23 0.67 2.56 444 8 5 7
I 2 1.49 0.23 4.21 0.54 3.67 461 6 7 1
I 3 1.64 0.22 4.16 0.53 3.63 394 7 5 3
values in freshwater generally tend to be higher than in the marine environment, so it is possible that the mangrove-derived organic matter brought by the river flux to the shoal areas during the ebb tide is responsible for the higher
TOC/TP and N/TP values found at R1 and R3 stations.6
In contrast to Ratones Mangrove, the sediments from Itacorubi have a TOC/TP average ratio approximately 3.2 times higher than that for the sediments from Ratones. High TOC/TP values in Itacorubi Mangrove indicate that the sediments from the rivers Itacorubi and Sertão are either very poor in sedimentary P or extremely rich in organic carbon. By looking at TOC/N ratios in Table 1, it is possible to note that the values are in agreement with the Redfield ratio, but N/TP values of 57 – 71 are very high, suggesting that the sediments are relatively depleted of P in relation to N and TOC. In fact, an increase in C/TP and N/TP ratios in sediments is probably due to a higher productivity in the water column, in response to an increased
anthropogenic input of nitrate and phosphate.37
Nonetheless, it is also important to mention that as both mangrove systems receive high terrestrial and marine inputs strong diagenetic effects occur in the sediments being responsible for the main changes in the Redfield ratio.
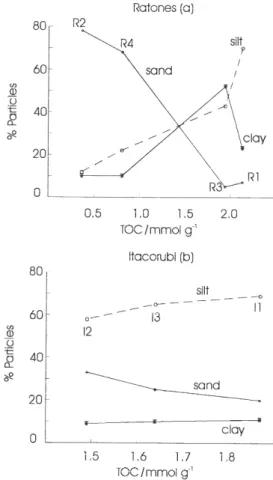
In Ratones Mangrove the particle size distribution revealed that the sample from station R2 taken from the bottom of Ratones River, has the highest sand content (78%), which drops to less than 10% for samples from stations R3 and R1, which were taken from the margin of the river and from the river mouth, a shoal area, respectively (Figure 2a). Station R4 was also sampled from the margin of the river, but is dominated by sand (68%). TOC has a strong negative correlation to sand content (r = –0.988, P < 0.05, n = 3), having maximal values at stations R3 and R1, which are nearly 3.5 times higher than those at the two other stations (R2 and R4). Silt and clay are the dominant sedimentary components at stations R3 and R1 (> 90%). Such high percentages of fine particles
are commonly found along with high TOC levels,38,39 which
suggest that these may be areas of major accumulation of continental detritus.
Particle fractions do not vary considerably in the sediments of Itacorubi Mangrove (Figure 2b), probably because all samples were taken from the bottom of rivers. The sediments are composed mainly of silt (59 – 69%) with a very low percentage of clay (< 12%). As in Ratones Mangrove sediments, the increase in TOC content was also associated with decrease in sand percentage. But this relationship is not as pronounced as that of the sediments from Ratones as TOC values vary very little among the
sediments in Itacorubi Mangrove (1.49 – 1.87 mmol g-1).
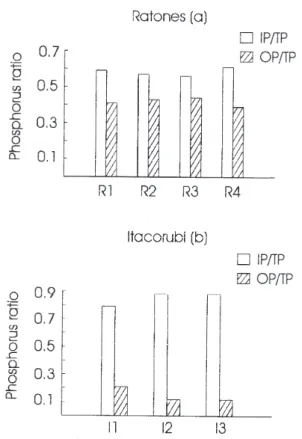
Interesting results were seen for the P fractions (Figures 3a and 3b). In the sediments of Ratones, samples contain an average of 58% IP, ranging from 59% to 61%. However, IP content is quite high in Itacorubi Mangrove, making up nearly 84% of TP (79 – 87%). These results indicate that the proportion of OP:IP seems to be affected by sources of phosphorus. High content of IP was suggested by Brunskill
et al.35 as being accountable for the major fraction of total
phosphorus in the open water sediments of Exmouth Gulf. However, the proportions of TOC:P and N:TP were far below Redfield ratios and they assumed that the organic carbon and nitrogen could be rapidly oxidized in the water column and surface sediments. Previous works have shown that IP is usually accountable for 60% of TP in sediments without anthropogenic input. Such results agree with phosphorus content found in the sediments of Ratones Mangrove and may explain why the IP:TP is so high in the Itacoburi sediments.
Brunskill et al.,35 working with sediments from
Exmouth Gulf, reported that sedimentary TOC/TP and N/ TP ratios did not show useful relationships with the abundance of fine particles. In terms of ratios, these results
Figure 2. Correlation between particle size (%) x TOC in sediments
agreed in part with what was seen for both mangroves. In our work, the correlation matrix calculated from the biological and particle size data showed that several parameters are significantly correlated (Table 2). Both mangrove sediments show very high correlations between TOC and TP (r>0.800). In Ratones, TOC also correlates with N (r=0.998, P<0.05, n=3), but to a lesser extent in
Itacorubi (r=0.601). Apart from TOC, N and TP, other parameters are also well correlated. For instance, silt and clay show good correlation with OP at both locations (r>0.650). In Ratones sand is negatively correlated with all other parameters, whereas in Itacorubi it shows a positive correlation with IP only (r=0.811, P<0.05, n=3). TP is significantly correlated with IP and OP in Ratones (r>0.99), but it has non-significant correlation with OP and a negative correlation with IP (r=-0.565) in Itacorubi. Other interesting results were the strong correlation between silt and IP in Ratones (r=0.979, P<0.05, n=3) and the negative correlation between them in Itacorubi (r=-0.797). N has no correlation with TP in Itacorubi, but these parameters correlate nicely to each other in Ratones (r=0.993, P<0.05, n=3). From the matrix correlations shown in Table 2 we can conclude that the major difference between both mangroves occurs mainly due the P composition.
Lipid compounds
Here we will discuss data on n-alkane, n-alkanol and
sterol concentrations and distribution patterns of individual compounds in sediments from both mangroves (Table 3).
For all samples, the distribution of total n-alkanes (C20 –
C36) shows an odd carbon number predominance with major
contributions ranging from C25 to C33. Concentrations are
higher at station R1 (10.1 µg g-1 dry sediment) than at other
stations of Ratones Mangrove. Station R2 has a very low value, nearly 55 times lower than that of station R1. Such strong variation is not observed in the Itacorubi sediments, and values have the same order of magnitude at all stations (4.2 – 6.3 µg g-1). With respect to total n-alkanols (C
15 – C34),
Figure 3. Histograms of IP/TP and OP/TP ratios in sediments of
Ratones (a) and Itacorubi (b) mangroves.
Table 2. Correlation coefficients (r) calculated for all biogenic and granulometric parameters in Ratones and Itacorubi mangrove sediments
Ratones TOC Sand Silt Clay N TP IP OP
TOC 1.000
Sand -0.988 1.000
Silt 0.938 -0.891 1.000
Clay 0.726 -0.810 0.456 1.000
N 0.998 -0.980 0.959 0.683 1.000
TP 0.987 -0.951 0.974 0.606 0.993 1.000
IP 0.975 -0.930 0.979 0.560 0.984 0.998 1.000
OP 0.996 -0.974 0.962 0.666 0.999 0.996 0.989 1.000
Itacorubi TOC Sand Silt Clay N TP IP OP
TOC 1.000
Sand -0.968 1.000
Silt 0.962 -1.000 1.000
Clay 0.993 -0.991 0.988 1.000
N 0.601 -0.381 0.359 0.500 1.000
TP 0.826 -0.941 0.949 0.888 0.045 1.000
IP -0.932 0.811 -0.797 -0.881 -0.850 -0.565 1.000
samples from both mangroves show predominance of compounds with even carbon numbers, mainly those
extending from C24 to C28. In the sediments of Ratones, higher
concentration of total n-alkanols is also detected at station
R1 (1.5 µg g-1) and the lowest value is registered at station
R2 (0.2 µg g-1). Two stations at Itacorubi mangrove have
concentrations of total n-alkanols higher than those for the
sediments of Ratones (stations I1 and I2: 1.8 µg g-1). As
reported by other authors,39-41 the distribution of n-alkanes
and n-alkanols seen in both mangrove ecosystems are
commonly attributed to land plant inputs.
Carbon Preference Index (CPI) values were calculated
in the range of the C22 - C32n-alkanes for both mangroves
(Table 3). The results show that CPI values for the sediments from Ratones are higher than 6, with the exception of station R2 (3.1). This low value suggests that sediments at this part of Ratones River receive a very low contribution of terrigenous particulate material. In fact, this result is
consistent with the low abundance of total long-chain n
-alkanes found at this station (Table 3). In contrast to the high values found at Ratones stations, CPI values in the sediments of Itacorubi Mangrove are much lower (averaging 3.5). As for station R2, these values can also be interpreted as reflecting a higher autochthonous character of the samples indicating that Itacorubi sediments have a predominant aquatic input. However, it is interesting to
note that the abundance of long-chain n-alkanes in
Itacorubi is not as low as that at station R2 (Table 3). The CPI results from both mangroves suggest that despite the
great abundance of n-alkanes found at almost all stations,
it is clear that they have relatively distinct autochthonous and allochthonous inputs.
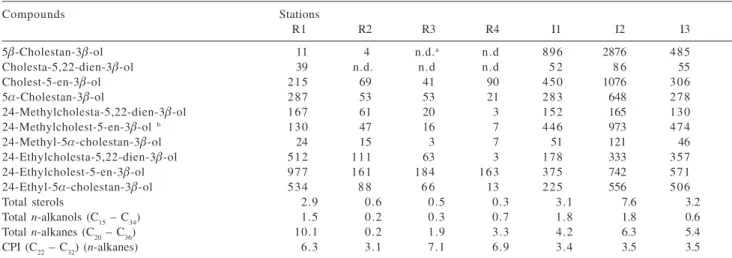
With regard to total sterols, again station R1 has the
highest value (2.9 µg g-1) nearly 9.4 times that for station
R4 (0.3 µg g-1; Table 3). The value found at station R1 is
similar to those from other areas rich in biogenic input such as the Yangtze estuary and the outer estuary of the Mackenzie
River (~1.0 – 3.3 µg g-1).42,43 However, these values are lower
than those found in superficial sediments of the urban
Capibaribe River (average 7.6 µg g-1),18 the Laurentian
Trough (~ 20,000 µg g-1)44 and the seasonal values obtained
in Cape Lookout Bight.1 Station R1 can be considered free
of fecal sterols and the high concentration of sterols is reflecting inputs from allochthonous and autochthonous sources. Sterols in Ratones Mangrove sediments are
dominated by 24-ethylcholest-5-en-3β-ol (C29∆5) followed
by other C29 sterols. These sterols are usually associated
with higher plant inputs but they can be also attributed to
marine sources.13 In contrast to Ratones, sterols in the
sediments of Itacorubi were dominated by 5β
-cholestan-3β-ol (coprostanol), which is generally employed as a fecal
pollution indicator.45 However, it is important to mention
that some authors have already emphasized that coprostanol
can be found in algae 45,46 and also the reduction of ∆5 sterols
in sediments usually produces stanol mixtures where 5α
-epimers are dominant.19 Nonetheless, using the (5β/5β +
5α) stanol ratio proposed by Grimalt et al.45 for sewage
pollution identification, we found ratios ranging from 0.64 to 0.82 for the sediments of Itacorubi and very low values for Ratones, from 0.04 to 0.07 (Table 4). Values of this ratio higher than 0.70 are considered to be indicative of
significant sewage contamination.20,45
As cholest-5-en-3β-ol and 24-ethylcholest-5-en-3β-ol
have been shown to relate to autochthonous and
Table 3. Concentrations of individual (in ng g-1) and total (in µg g-1) sterols, n-alkanols from C
15 to C34, and n-alkanes from C20 to C36 in sediments of Itacorubi and Ratones mangroves; CPI: Carbon Preference Index calculated in the C22 – C32n-alkane range. Values shown are the average of duplicate analyses
Compounds Stations
R1 R2 R3 R4 I1 I2 I3
5β-Cholestan-3β-ol 11 4 n.d.a n.d 896 2876 485
Cholesta-5,22-dien-3β-ol 39 n.d. n.d n.d 5 2 8 6 55
Cholest-5-en-3β-ol 215 69 41 90 450 1076 306
5α-Cholestan-3β-ol 287 53 53 21 283 648 278
24-Methylcholesta-5,22-dien-3β-ol 167 61 20 3 152 165 130
24-Methylcholest-5-en-3β-ol b 130 47 16 7 446 973 474
24-Methyl-5α-cholestan-3β-ol 24 15 3 7 51 121 46
24-Ethylcholesta-5,22-dien-3β-ol 512 111 63 3 178 333 357
24-Ethylcholest-5-en-3β-ol 977 161 184 163 375 742 571
24-Ethyl-5α-cholestan-3β-ol 534 8 8 6 6 13 225 556 506
Total sterols 2.9 0.6 0.5 0.3 3.1 7.6 3.2
Total n-alkanols (C15 – C34) 1.5 0.2 0.3 0.7 1.8 1.8 0.6
Total n-alkanes (C20 – C36) 10.1 0.2 1.9 3.3 4.2 6.3 5.4
CPI (C22 – C32) (n-alkanes) 6.3 3.1 7.1 6.9 3.4 3.5 3.5
allochthonous material, respectively, we used the ratio cholesterol/24-ethylcholesterol to evaluate possible changes in marine-terrestrial source inputs and also to
compare with data reported by other authors (Table 4).47,48
Values of this ratio are higher at stations I1 and I2 (1.20 and 1.45 respectively) in the sediments of Itacorubi Mangrove and are less than 1.0 at other stations in both estuaries (0.22 - 0.53). Of note is that stations I1 and I2 are located in Sertão and Itacorubi Rivers, which receive waste discharges containing sewage matter. Compared to stations I1 and I2, it is possible that the lowest value for cholesterol/24-ethylcholesterol at station I3 is because of its location, thus also receiving input from marine sources. Considering the possible sewage origin of cholesterol, the high ratio values encountered at Itacorubi stations suggest that no unique source exists for cholesterol and inputs may vary with time from sources such as plankton production, bioaccumulation
or domestic discharges. According to Sicre et al.48 a low
cholesterol/24-ethylcholesterol ratio (<2.5) can be associated with higher allochthonous input. However, it is worth mentioning that their results related to suspended particles, collected from the Chang Jiang Estuary, and not for sediments. Our values were well below 2.5, but there is a clear indication of anthropogenic contribution for cholesterol. We decided also to calculate this ratio for sediment samples using values available in the literature. The ratio ranged from 0.76 to 1.30 in the sediments of Cape
Lookout Bight1 and from 1.10 to 4.54 in sediments of the
urban Capibaribe River estuary.19 In spite of such a wide
variation in the cholesterol/24-ethylcholesterol ratio, both studies suggested that these compounds may be mainly derived from autochthonous input.
We also used another ratio that is commonly employed to infer terrestrial contribution for sediments. The relative abundance of three sterols has been found in surface sediments of Loch Clair to be close to 1:1.6:6.6
(24-methylcholes-5-en-3β-ol:24-ethylcholesta-5,22-dien-3β
-ol:24-ethylcholest-5-en-3β-ol).49 The average values for
this ratio in the Ratones and Itacorubi sediments were 1:2.6:11.3 and 2.2:1:2, respectively. The sterol
24-Table 4. Ratios of the isomeric 5α and 5β(H)-cholestan-3β-ols, cholesterol to 24-ethylcholesterol and individual 5α(H)-stanols to their ∆5 stenol
counterparts determined in the sediments of Ratones and Itacorubi mangroves
Ratios Stations
R1 R2 R3 R4 I1 I2 I3
Stanols (5β / 5β + 5α) 0.04 0.07 -a - a 0.76 0.82 0.64
Cholesterol / Ethylcholesterol 0.22 0.43 0.22 0.55 1.20 1.45 0.53
Cholestanol / Cholesterol 1.33 0.76 1.29 0.23 0.63 0.60 0.91
24-Ethylcholestanol / 24-Ethylcholesterol 0.55 0.55 0.36 0.08 0.60 0.75 0.89
a 5β-Cholestan-3β-ol was not detected.
ethylcholest-5-en-3β-ol largely predominates over the two
other sterols in the sediments of Ratones whereas Itacorubi shows a slightly high relative abundance of
24-methylcholes-5-en-3β-ol. These results indicate that the
relative contribution of different sources of organic matter vary between locations. The dominance of
24-ethylcholest-5-en-3β-ol suggests a higher vascular land plant input of
these compounds to the sediments of Ratones than to Itacorubi. In contrast, the main source of the three sterols seems to be of phytoplanktonic origin in the Itacorubi sediments.
Another interesting issue regarding sterols is the possible changes that occur on the sterol skeletons. These changes have been used to assess microbially-mediated diagenetic transformation reactions. Two reactions are
usually employed, the reduction of cholest-5-en-3β-ol to
5α-cholestan-3β-ol and of 24-ethylcholest-5-en-3β-ol to
24-ethyl-5α-cholestan-3β-ol.50,51 However, possible
mixtures of 5α-stanols from marine organisms cannot be
ruled out. Ratios for the two sterol pairs were calculated:
5α-cholestan-3β-ol/cholest-5-en-3β-ol and 24-ethyl-5α
-cholestan-3β-ol/24-ethylcholest-5-en-3β-ol (Table 4).
Values for these ratios are higher at stations R1 and R3 of Ratones Mangrove than at any other sites. In general, the results obtained here for both estuaries are very high compared to other studies in which the average values for
stanol/stenol pairs are below 0.60.19,48 One possible reason
for the higher 5α-cholestan-3β-ol/cholest-5-en-3β-ol ratio
seen at Ratones stations would be a direct input of 5α
(H)-stanols from diatoms as they are likely to be found in the
estuary.9 However, it should be noted that the lowest value
found at station R4 (0.23) is consistent with its location, where inputs of marine organisms should be minimal.
Furthermore, 5α-cholestan-3β-ol/cholest-5-en-3β-ol and
24-ethyl-5α-cholestan-3β-ol/24-ethylcholest-5-en-3β-ol
Conclusions
Our study on the concentration levels of sterols,
n-alkanols, n-alkanes and biogenic elements in the sediments
of Ratones and Itacorubi mangroves shows that the distribution and abundance of lipid compounds and C:N:P ratios can be closely related to natural sources of organic matter and also give clear insights of sewage discharges. Biogenic and granulometric parameters showed significant correlation in the sediments of Ratones Mangrove, even for those samples taken from the tidal flat mud at margin of the Ratones River. In contrast, sediments from Itacorubi Mangrove showed non-significant correlation between C, N and P values and granulometric fractions. Of note is the negative correlation between IP and the fine particles. This result implies that the abundance of IP in these sediments is severely affected by the sewage discharged into the two rivers crossing the Itacorubi Mangrove. Nitrogen is also affected but not to the same degree.
Quantitative results of characteristic sterols found at station R1 were consistent with biogenic and granulometric correlations. High concentration of coprostanol and the
values obtained from the (5β/5β + 5α) epimeric ratio
showed that the sediments of Itacorubi Mangrove are heavily impacted by human activities. As a final comment, from the observation of elemental parameters and particle size correlation, we can state that sewage outfall interferes in the natural intake and uptake balance of phosphorus, nitrogen and organic carbon at the bottom sediment-water interface in both rivers of Itacorubi Mangrove.
Acknowledgements
Thanks are due to the Rescue & Save Brigade of Florianópolis City for helping us to collect samples at Itacorubi Mangrove. Dr. Sérgio Antônio Netto and Mr. José Carlos Simonassi for their help with the field work at Ratones Mangrove. Scholarships for Luciana Mater, Marcelo da Rosa Alexandre and Fabrício Augusto Hansel were provided by the Brazilian National Research Council and CAPES. Financial support was provided by Funpesquisa-1997, UFSC.
References
1. Canuel, E.A.; Martens, S.C.; Deep Sea Res. 1993, 36, 121. 2. Sicre, M-A.; Tian, R.C.; Saliot, A.; Org. Geochem. 1994, 21,
1.
3. Hernandez, M. E.; Mead, R.; Peralba, M. C.; Jaffé, R.; Org. Geochem. 2001, 32, 21.
4. Xu, S.; Gao, X.; Liu, M.; Chen, Z.; Geomorph.2001, 41, 207.
5. Ruiz-Fernandéz, A. C.; Hillaire-Marcel, C.; Ghaleb, B.; Soto-Jiménez, M.; Paez-Osuna, F.; Environ. Pollut. 2002, 118, 365. 6. Bouillon, S.; Dahdouh-Guebas, F.; Rao, A. V. V. S.; Koedam,
N.; Dehairs, F.; Hydrobiol. 2003, 495, 33.
7. Koch, B. P.; Rullkötter, J.; Lara, R. J.; Wet. Ecol. Manag.
2003, 11, 257.
8. Silva, A. D.; MSc. Dissertation, Universidade Federal de Santa Catarina, Brazil, 1990.
9. Soriano-Sierra, E. J.; Silva, J. R. B. M.; Derner, R. B.; Branco, J. O. In Ecology and Managment of Itacorubi Mangrove; Soriano-Sierra, E. J.; Ledo, B. S., eds., IOESC: Florianópolis, 1998, p. 115.
10. Volkman, J. K.; Org. Geochem. 1986, 9, 83. 11. Heftmann, E.; Lipids 1971, 6, 128.
12. Laureillard, J.; Saliot, A.; Mar. Chem.1993, 43, 247. 13. Volkman, J. K.; Barret, S. M.; Blackburn, S. I.; Mansour, M.
P.; Sikes, E. L.; Gelin, F.; Org. Geochem. 1998, 29, 1163. 14. Goad, L. J. In Marine Natural Products: Chemical and
Biological Perpectives. II; Scheuer, P. J., ed., Academic Press: New York, 1987, p. 75.
15. Ikekawa, N. In Sterols and Bile Acids; Danielsson, H.; Sjovall, J., eds., Elsevier: Amsterdam, 1985, p. 180.
16. Bradshaw, S. A.; PhD. Thesis, University of Bristol, UK, 1988. 17. Mermoud, F.; Wunsche, L.; Clerc, O.; Gulacar, F.O.; Buchs,
A.; Org Geochem.1984, 6, 25.
18. Gagosian, R. B.; Smith, S. O.; Lee, C.; Farrington, J. W.; Frew, N. M. In Advances in Organic Geochemistry 1979; Douglas, A. G.; Maxwell, J. R., eds., Pergamon Press: Oxford, 1980, p. 407.
19. Fernandes, M. B.; Sicre, M- A.; Cardoso, J. N.; Macedo, S. J.; Sci. Total Environ. 1999, 23, 1.
20. Carrera, R.; Wagener, A. L. R.; Fileman, T.; Readman, J. W.; Quim. Nova2001, 24, 27.
21. Rieley, G.; Collier, R. J.; Jones, D. M.; Eglinton, G.; Org. Geochem. 1992, 17, 901.
22. Madureira, L. A. S.; van Kreveld, S. A. V.; Eglinton, G.; Conte, M. H.; Ganssen, G.; Hinte, J. E.; Ottens, J.; Paleocean. 1997, 12, 255.
23. Eglinton, G.; Hamilton, R. J.; Raphael, R. A.; Gonzales, A. G.; Nature1962, 193, 739.
24. Volkman, J. K.; Eglinton, G.; Corner, E. D. S.; Phytochem.
1980, 19, 1809.
25. Saliot, A. In Marine Organic Geochemistry; Duursma, E.; Dawson, R., eds., Elsevier: Amsterdam, 1981, p. 237. 26. Venkatesan, M. I.; Kaplan, I. R.; Geochim. Cosmochim. Acta
1987, 46, 2135.
27. Lacerda, l. D. In Mangrove Ecosystems Occasional Papers No. 2; Vannucci, M, ed., ISME: Okinawa, 1998, p. 65. 28. Ledo, S. B.; Soriano-Sierra, E. J.; Proceedings 4th Symposium
29. De Souza Sierra, M. M.; Giovanela, M.; Soriano-Sierra, E. J.; Environ. Technol. 2000, 21, 979.
30. Suguio, K.; Introdução à Sedimentologia, Universidade de São Paulo: São Paulo, 1973.
31. Murphy, I.; Riley, S. P.; Analyt. Chim. Acta1962, 27, 223. 32. Koroleff, F. In Methods of Seawater Analysis; 2nd ed.,
Grasshoff, K.; Ehrhardt, M.; Kremling, K., eds., Verlag Chemie: Weinheim, 1983, 125.
33. Madureira, L. A. S.; Eglinton, G.; Conte, M. H.; Paleoacean.
1995, 10, 627.
34. Wang, Z.; Fingas, M.; Li, K.; J. Chrom. Sci. 1994, 32, 361. 35. Brunskill, G. J.; Orpin, A. R.; Zagorskis, I.; Woolfe, K. J.;
Ellison, J.; Continental Shelf Res.2001, 21, 157.
36. Takahashi, T.; Broecker, W. S.; Langer, S.; J. Geoph. Res.
1985, 90, 6907.
37. Emeis, K. C.; Struck, U.; leipe, T.; Pollehme, F.; Kunzendorf, H.; Christiansen, C.; Mar. Geol. 2000, 167, 43.
38. Muniz, P.; Danulat, E.; Yannicelli, B.; Garcia-Alonso, J.; Medina, G.; Bícego, M. C.; Environ. Int. 2003, 1096, 1. 39. Nishigima, F. N.; Weber, R. R.; Bícego, M. C.; Mar. Pollut.
Bull. 2001, 42,1064.
40. Gomes, A. O.; Azevedo, D. A.; J. Braz. Chem. Soc. 2003, 14, 358.
41. Azevedo, D. A.; J. Braz. Chem. Soc. 2003, 14, 97.
42. Tian, R. C.; Sicre, M-A.; Saliot, A.; Org. Geochem.1992, 18, 843.
43. Yunker, M. B.; Macdonald, R. W.; Veltkamp, D. J.; Cretney, W. J.; Mar. Chem.1995, 49, 1.
44. Colombo, J. C.; Silverberg, N.; Gearing, J. N.; Org. Geochem.
1997, 26, 257.
45. Grimalt, J. O.; Fernández, P.; Bayona, J. M.; Albaigés, J.; Environ. Sci. Technol. 1990, 24, 357.
46. Colombo, J. C.; Silverberg, N.; Gearing, J. N.; Org. Geochem.
1996, 25, 211.
47. Huang, W-Y.; Meinschein, W. G.; Geochim. Cosmochim. Acta
1976, 40, 323.
48. Sicre, M-A.; Tian, R. C.; Broyelle, I.; Saliot, A.; Mar. Chem.
1993, 42, 11.
49. Cranwell, P. A.; Volkaman, J. K.; Chem. Geol.1981, 32, 29. 50. Gaskell, S. J.; Eglinton, G.; Nature1975, 254, 209. 51. Nishinura, M.; Koyama, T.; Geochim. Cosmochim. Acta1977,
41, 379.
Received: October 28, 2003