1Kansas State University, Department Of Geology, Manhattan (KS), USA. E-mail: [email protected]
2Florida State University, Department of Earth, Ocean and Atmospheric Science & National High Magnetic Field Laboratory, Tallahassee (FL), USA.
E-mail: [email protected] *Corresponding author
Manuscript ID: 20160001. Received in: 01/04/2016. Approved in: 08/02/2016. ABSTRACT: Paleoredox indicators were used to assess the dep-ositional environment of the Permian Irati Formation, and dis-cuss the controls on the accumulation of organic-rich sediments. Geochemical data were measured for 43 drill-core samples in southern Paraná Basin. We infer that redox boundary was located at the sediment-water interface during the accumulation of these sediments. Trace-element data demonstrate that Ira-ti shales were similar to average shales, except during deposition of two organic-rich beds in which U and Mo are enriched, sug-gesting fully anoxic conditions. The variable degree of oxygena-tion of bottom waters is also attested by DOPT, FeT/Al, and sed-imentological indicators of episodic ventilation. DOPT and Fe and S correlation points to an iron-limited environment, where the main sulfur sink is organic matter rather than pyrite. Cu and Cu/Mo ratio suggests bottom-water anoxia driven by in-creased organic flux. The Irati Formation was probably deposit-ed in a salinity-stratifideposit-ed body of water, with positive water bal-ance. The main control on the accumulation of the organic-rich sediments was the high organic carbon flux resultant from high primary productivity in surface waters. Anoxia arose as a consequence of increased productivity, not as the primary driver in the formation of these organic-rich rocks.
KEYWORDS: black shales; paleoredox proxies; Irati Forma-tion; Permian.
RESUMO: Indicadores da paleo-condição redox foram utilizados para in-terpretar o ambiente deposicional da Formação Irati (Permiano) e discutir os controles na acumulação de sedimentos ricos em matéria orgânica. Os dados geoquímicos foram obtidos em 43 amostras de quatro testemunhos de sondagem de poços da Bacia do Paraná no Sul do Brasil. A interpretação desses dados permitiu inferir que a interface redox normalmente coincidia com a interface água-sedimentos durante a acumulação desses sedimentos. Dados de elemen-tos-traços demonstram que os folhelhos da Formação Irati eram similares ao folhelho médio, exceto durante a deposição de duas camadas ricas em matéria orgânica, caracterizadas por um grande enriquecimento em U e Mo, o que sugere condições completamente anóxicas durante a deposição dessas camadas. O variável grau de oxigenação das águas de fundo é também atestado pelo grau de piritização (DOPT ), pela razão FeT /Al e por indicadores sedimentológicos de aeração episódica (provavelmente decorrente de eventos de tempestade). DOPT e a correlação entre Fe e S sugerem um ambiente com limitação de ferro, onde a maior parte do enxofre está incluso na matéria orgânica e não na pirita. A razão entre Cu e Cu/Mo sugere que a anoxia de fundo foi consequência do alto luxo orgânico. Assim, a Formação Irati provavelmente foi depositada em um corpo de água estratiicado, com balanço hídrico positivo. O principal controle na acumulação de sedimentos ricos em matéria orgânica foi o alto luxo de carbono resultante da alta produtividade primária em águas supericiais. Dessa forma, a anoxia foi uma consequência da alta produtividade, e não o principal controle na geração das rochas ricas em matéria orgânica.
PALAVRAS-CHAVE: folhelhos orgânicos; equivalentes paleoredox; Formação Irati; Permiano.
Geochemical paleoredox indicators in
organic-rich shales of the Irati Formation,
Permian of the Paraná Basin, southern Brazil
Indicadores geoquímicos das condições paleoredox em
folhelhos ricos em matéria orgânica da Formação Irati,
Permiano da Bacia do Paraná, Sul do Brasil
Karin Goldberg1*, Munir Humayun2
INTRODUCTION
Understanding the depositional settings of organic-rich sediments in the geological record is crucial to reconstruc-ting the paleoclimate and paleohydrology of ancient sedi-mentary basins and in the prediction of the occurrence of oil source rocks (Demaison and Moore 1980, Calvert and Pedersen 1992, Arthur and Sageman 1994, Canield 1994, Sladen 1994, Ganeshram et al. 1999, Carroll and Bohacs 2001, Sageman et al. 2003). In order to assess the physical-chemical conditions of ancient bodies of water (degree of oxygenation, salinity, and stratiication of the water column) and thus draw a more complete picture of the primary controls on the accumulation of organics in ine-grained sediments, a variety of paleontological, sedi-mentological, and geochemical indicators has been used, including the degree of bioturbation, the presence of lami-nation, the absence of benthic fauna (e.g. Rhoads and Morse 1971, Ekdale and Mason 1988, Wignall and Myers 1988, Raiswell et al. 1988, Hatch and Leventhal 1992, Calvert and Pedersen 1993, Arthur and Sageman 1994, Sageman et al. 2003), as well as geochemical tests using biomarkers, stable isotopes, and trace elements (e.g. Meyers et al. 2005, Lyons and Severmann 2006, Tribovillard et al. 2006, Brumsack 2006, Algeo and Lyons 2006, Arnaboldi and Meyers 2007, Lehmann et al. 2007, Algeo and Maynard 2008, Huang et al. 2011, Trabucho-Alexandre et al. 2012, Pi et al. 2013).
he ongoing debate about the critical factor in the accumu-lation of organic matter involves, on one hand, bottom-water anoxia, leading to preferential preservation of organic carbon (e.g. Demaison and Moore 1980), and, on the other hand, increased organic lux to the sea loor as a consequence of high primary productivity, with redox boundary at the sediment-water interface (e.g. Meyers 2006, Arnaboldi and Meyers 2007, Trabucho-Alexandre et al. 2012). In the irst case, hydrographic factors lead to the development of water-column anoxia in a basin, e.g., an enclosed basin with posi-tive water balance, coastal upwelling, or a deep basin with an oxygen minimum zone (Arthur and Sageman 1994). In the latter, anoxia would be a consequence of the increased orga-nic lux (Gallego-Torres et al. 2007, Goldberg et al. 2007, Joachimski et al. 2001, Kakuwa 2008, Berrocoso et al. 2010, Reolid et al. 2012, Stein et al. 2012, Xiong et al. 2012). he redox classiication of the depositional environments adop-ted here is that of Tyson and Pearson (1991). Oxic envi-ronments are where oxygen concentration is greater than 2 ml O2/l H2O in bottom waters, suboxic, between 2 and 0.2 ml O2/l H2O, and anoxic, where there is less than 0.2 ml O2/l H2O and no free H2S in the water column. Euxinic waters are deined as having O2 concentration equals to zero and free H2S in the water column.
Redox-sensitive elements (e.g., V, Fe, Mn, Mo, U) are those elements that geochemically behave diferently under oxic and anoxic conditions due to changes in the solubi-lity of their oxyanions (Morford et al. 2005). he diferen-tial response of these elements to redox conditions enables their use for inferring the degree of oxygenation of the water where these sediments form. Redox-sensitive trace metals such as V, Cr, Ni, Cu, Zn, Mo, Cd, and U tend to be more soluble under oxidizing conditions and less soluble under reducing conditions, resulting in authigenic enrichments in oxygen-depleted sedimentary facies (Tribovillard et al. 2006). he removal of these metals from seawater as sulides (Ni, Zn, Cu, Mo, Cd) or oxides/oxyhydroxides (V, Cr, Mo, U) under anoxic conditions results in enrichments of several orders of magnitude above detrital values in the mudrocks (Calvert and Pedersen 1993, Crusius et al. 1996, Morford and Emerson 1999, Algeo and Lyons 2006, Tribovillard
et al. 2006, Arnaboldi and Meyers 2007, Algeo and Maynard
2008). he combined use of U, V, and Mo enrichments may allow the distinction between suboxic from anoxic-euxinic environments. hese elements are more strongly enriched in anoxic-euxinic settings, with weaker covariation with total organic carbon (TOC) than in suboxic settings (Tribovillard
et al. 2006). Mo has been widely used in paleoceanographic
studies as a redox proxy (e.g., Emerson and Huested 1991, Jones and Manning 1994, Crusius et al. 1999, Morford
et al. 2001, Piper and Dean 2002, Algeo et al. 2004, Algeo
and Lyons 2006).
Ni and Cu are good proxies for organic carbon sinking lux (paleoproductivity), and may be used to determine whe-ther bottom-water oxygenation and/or organic matter lux was the primary control on the development of reducing conditions (Tribovillard et al. 2006). Enrichments in U, V and Mo suggest anoxic bottom waters. If enrichments in these metals are also coupled with enrichments in Ni and Cu, anoxia is accompanied by a high organic lux. Fe can be enriched under anoxic conditions through the precipi-tation as pyrite (Algeo and Maynard 2008).
the pyrite formed is diicult due to the intense bioturba-tion of the sediments by bottom dwellers and oxidabioturba-tion of pyrite to Fe oxides. For these reasons, DOP values are typi-cally low in oxic settings (Raiswell et al. 1988). DOPT is the ratio of pyrite Fe (based on total S) to total Fe (Algeo and Maynard 2008). his index can be used in place of true DOP, if pyrite S composes the bulk of total S and reactive Fe composes the bulk of total Fe. DOPT values for aerobic conditions are typically less than 0.3, for restricted condi-tions, between 0.3 and 0.6, and for inhospitable condicondi-tions, DOPT is usually greater than 0.6 (Algeo and Maynard 2008).
Lyons and Severmann (2006) established that the ratio of FeT/Al is an unambiguous recorder of paleoredox conditions. High FeT/Al and high DOP are the most faithful indicators of euxinia. FeT/Al less than 0.5 and DOP less than 0.2-0.3 sug-gest oxic–suboxic conditions, whereas FeT/Al greater than 0.5 and DOP greater than 0.6 point to euxinic conditions (Lyons and Severmann 2006). Intermediate DOP could be due to reducing conditions in pore waters beneath oxygena-ted bottom waters, or euxinic deposition at sites with high sedimentation rates.
he Irati black shales in the Paraná Basin comprise oil source rocks and a widespread marker across Gondwanan basins (Oelofsen 1987, França et al. 1995). Here, we report redox-sensitive elements, C isotopes, TOC, and sulfur con-tent in the Permian Irati Formation, and use paleoredox proxies such as enrichment factor (EF), DOPT, and FeT/Al to assess the depositional environment of these shales and discuss the environmental controls on the accumulation of organic-rich sediments in the context of other geological evidence. hese are relevant issues because the Irati oil sha-les have large potential for economic development in Brazil due to their accessibility, grade, and widespread distribution.
SAMPLES AND
ANALYTICAL METHODS
Geological setting and sampling
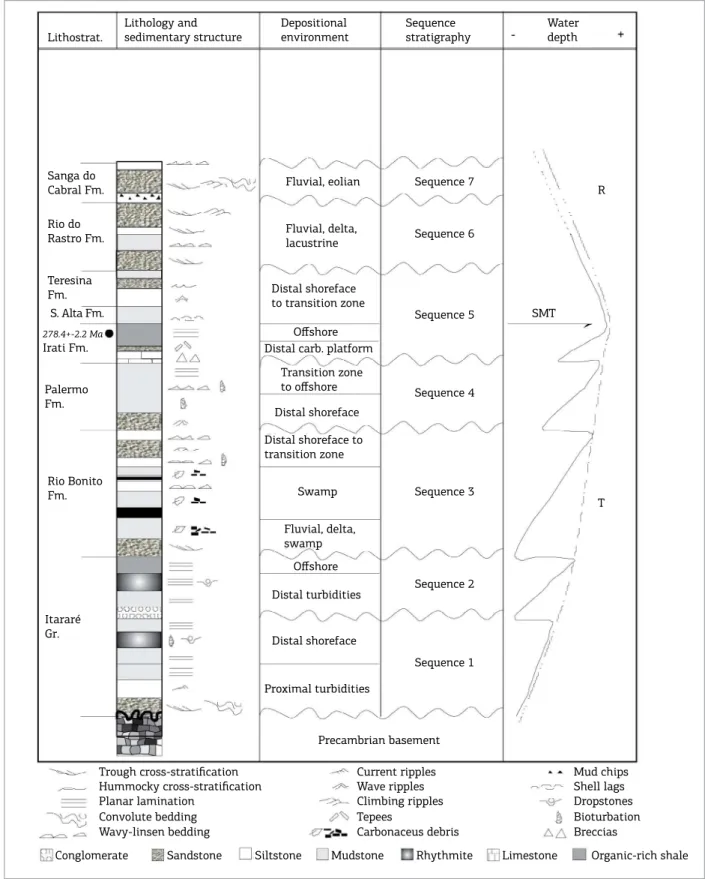
he intracratonic Paraná Basin is the South American extension of a larger Permian basin developed in the inte-rior of Gondwana (Fig. 1a) (Milani et al. 1994, 1998, 2007). he Permian in the Paraná Basin comprises seven third-order sequences that recount the oscillations of rela-tive sea level (Goldberg 2001). During the Early Permian, such oscillations were driven initially by the advance and retreat of glaciers (sequences 1 and 2), succeeded by base level shifts due to isostatic rebound (sequence 3), tectonic reactivation (sequences 4 and 5), and continuous subsidence of the basin, leading to a relative sea level rise in the Middle
Permian (Fig. 2). A monotonic relative sea level fall and con-sequent continentalization of the basin followed (sequences 6 and 7), as a result of the combined efects of basin illing and climate change in the Late Permian and Early Triassic.
he black shales of the Permian Irati Formation in the Paraná Basin were deposited within the interval of maxi-mum transgression of a second-order depositional sequence, under low sedimentation rates (Fig. 2). In addition to the oil shales, the Irati Formation also comprises carbonates and non-bituminous shales and claystones. SHRIMP zircon age dating from bentonitic tufs intercalated with the Irati black shales yielded an age of 278.4±2.2 Ma (Santos et al.
2006), placing the Irati Formation in the Lower Permian (Artinskian).
80o 60o
40o
40o 60o 80o
80o 80o
60o 60o
30o 30o
0o 0o
20o 20o
1200 km ARGENTINA
URUGUAY CHILE PARAGUAY
BOLIVIA BRAZIL GUYANA VENEZUELA
COLOMBIA
EQUADOR
PERU
PARANÁ BASIN
Rio Grande do Sul State
Serra Geral flood basalts
Rio-grandense Shield
Porto Alegre
0 50 100 150 km
Atlantic Ocean Gondwana
outcrop belt
coastal plain
CA-53 CA-87
HV-44 a)
b)
CA-79
Santa Maria
0 150km
Atlantic Ocean
Coastal plain 100
50
Figure 1. Geographic localization of the Paraná
and Chaco-Paraná Basins in South America (ater
Zalan et al.1990) (a), and the drill cores sampled for geochemical analyses in southern Paraná Basin (b).
A
he black shales are rhythmically intercalated with limestones and dolomites, and individual beds vary from
Figure 2. Summary chart of the depositional environments and sequences in the Permian section of the studied drill cores, with interpretation of the water depth (SMT = surface of maximum transgression, T = transgressive,
R = regressive). Radiometric age in tufs of the Irati Formation (278.4 ± 2.2 Ma) from Santos et al. (2006).
Lithostrat.
Lithology and sedimentary structure
Depositional environment
Sequence stratigraphy
Water depth
Sanga do
Cabral Fm. Fluvial, eolian Sequence 7 R
Rio do
Rastro Fm. Fluvial, delta,lacustrine Sequence 6
Teresina Fm.
S. Alta Fm.
Distal shoreface to transition zone
Sequence 5 SMT
278.4+-2.2 Ma
Irati Fm. Distal carb. platform
Transition zone
to offshore Offshore
Offshore
Palermo
Fm. Sequence 4
Distal shoreface
Distal shoreface to transition zone
Rio Bonito
Fm. Swamp Sequence 3
Fluvial, delta, swamp
Itararé Gr.
Distal turbidities Sequence 2
Distal shoreface
Proximal turbidities
Sequence 1
T
Precambrian basement
Trough cross-stratification Hummocky cross-stratification
Planar lamination Convolute bedding Wavy-linsen bedding
Current ripples Wave ripples Climbing ripples Tepees
Carbonaceus debris
Mud chips Shell lags Dropstones Bioturbation Breccias
Conglomerate Sandstone Siltstone Mudstone Rhythmite Limestone Organic-rich shale
nontronite, and quartz (Anjos et al. 2010). Green clays-tones are nontronite-rich but also contain lizardite, talc, and quartz, suggesting that sediment sources included alte-red basic-ultrabasic rocks (Anjos et al. 2010).
In Southern Brazil, two distinct oil-rich beds have an ave-rage thickness of 8 m (the lower bed) and 4 m (the upper one). hese organic-rich layers contain 20-30% organic material and yield 2-12% recoverable oil on destructive distillation (Correa da Silva and Cornford 1985). he Irati shales are imma-ture (lignite/sub-bituminous rank), oil-rich (100-114 kg/ton), and contain kerogen of a dominantly bacterially degraded algal origin (Correa da Silva and Cornford, 1985).
he Irati Formation has been regarded as deposited in an anoxic, epicontinental sea by most workers (e.g. Lavina
et al. 1991, Triguis et al. 1996), but there has been
subs-tantial debate about the salinity of the water and the pre-sence of stratiication in the water column. Some authors consider that the Irati Formation could represent a coastal succession formed in a lagoon or gulf with variable sali-nity (Araújo 2001). Sedimentological and paleontological data obtained previously have been insuicient to resolve the depositional setting in which these rocks were formed (e.g. Correa da Silva and Cornford 1985, Mello et al. 1993).
Four cores drilled by the Brazilian Geological Survey in southern Paraná Basin were sampled (Fig. 1b). hree of them (CA-53, CA-79, and CA-87) were sampled at coarse inter-vals (5-10 m) throughout the extent of the Irati Formation, and a fourth core (HV-44), with greater TOC content, was sampled at a much iner scale, in some portions every 40 centimeters. Based on the TOC content, 21 samples from HV-44 were selected to represent both the background sedi-mentation and the two organic-rich layers. Strata adjacent to diabase sills or portions that might have been afected by hydrothermal activity (i.e. crosscut by carbonate veins) were avoided during sampling. Samples that had carbonate content greater than 50% were not analyzed.
Redox-sensitive element analysis
Redox-sensitive elements were determined at the University of Chicago by Inductively Coupled Plasma Mass Spectrometry (ICP-MS). Rock chips (1-3 g) were ultrasonically cleaned with 18 MΩ deionized water and hand ground in an alu-mina mortar. Further sample preparation was carried out in a Class 100 laboratory supplied with HEPA-iltered air. Sample preparations were performed in Class 100 laminar low acid exhaust hoods using Seastar™ double-distilled acids and 18.3 MΩ deionized water. Approximately 200 mg pow-der was weighed into acid-washed 15 ml Savillex™ telon PFA digestion vessels with 3 ml of HF and 2 ml of HCl, closed and heated on a hot plate at 160°C for 12 hours. he ves-sels were then opened and evaporated to dryness. he solid
residue was taken up in 2 ml of perchloric acid (HClO4) and fumed to remove silicon. After the perchloric acid drydowns, the solids were dissolved in 6 ml of 8N HNO3, closed and heated on a hot plate for 12 hours. he solutions were then diluted, centrifuged to remove any residue, and transferred to acid-washed Nalgene™ 125 ml LDPE bottles. Any resi-dual material (mainly alkali perchlorate) was dissolved with 6N HCl or 8N HNO3 by heating for 12 hours. he solu-tions were subsequently diluted with 2% HNO3 for analysis by ICP-MS. Procedural blanks were negligible (<<1%) for the elements analyzed.
Elemental abundances were determined using a Finnigan Element™ high-resolution, magnetic sector ICP-MS, ope-rating in low (R = 340) and medium mass resolution (R = 4300) modes. During the course of the measure-ments, instrumental sensitivity at 115In~ was 1 – 2 million
cps/ppb in low resolution, and about a factor of 10 lower at medium resolution. he peaks determined in low reso-lution were 51V, 53Cr, 59Co, 60Ni, 63Cu, 66Zn, 95Mo, 111Cd, 118Sn, 182W, and 238U. Molecular isobaric interferences (on 51V, 53Cr) and instrumental blanks from the Ni cones (60Ni, 63Cu, 66Zn, 118Sn) were subtracted from measured
intensi-ties by running a blank 2% HNO3 solution. he choices of minor isotopes for Ni, Zn, Mo, and Cd were inluenced by the presence of (unresolvable) atomic ion interferences, particularly Sn on Cd at m/e = 112, 114. he peaks determi-ned in medium resolution were 25Mg, 27Al, 44Ca, 49Ti, 55Mn,
and 56Fe, the latter four elements being seriously afected
by molecular interferences. External standardization with 2% HNO3 solutions containing known concentrations of the measured elements, prepared by dilution from Spex™ monoelement solutions, was used. he sample solutions were suiciently dilute that samples and standards were conside-red to be matrix matched.
Two USGS standards (Marine Sediment MAG-1 and Cody Shale SCo-1) were prepared and analyzed in order to estimate the accuracy of these measurements. For all the major elements, the concentrations obtained were within the variation range reported by the USGS (Table 1). For the trace elements, the measured concentrations were within 10% of the values reported for the USGS standards, except for Mo and U (Table 2). he concentrations of these elements were consistently higher by a factor of two (U) to three (Mo) than the ones reported by the USGS. he reasons for these discrepancies are not known.
Total organic carbon,
sulfur, and C isotopes
Core Sample Ti (wt%)
Al (wt%)
Ca (wt%)
Mg (wt%)
Fe (wt%)
Mn (wt%)
TOC (wt%)
S total
(wt%) DOPT FeT/Al
δ13C
(‰)
CA-53
261,7 0,4 7,94 0,68 1,29 3,21 0,04 0,53 0,24 0,07 0,4
271,4 0,4 7,6 0,1 1,26 3,62 0,04 0,66 0,24 0,06 0,48
276,3 0,44 8 0,81 1,13 3,13 0,04 0,78 0,089 0,02 0,39
291,5 0,41 7,34 1,71 0,93 2,06 0,14 0,42 0,086 0,04 0,28 -22,53
294,7 0,42 6,47 0,59 1,4 2,85 0,1 0,5 0,044 0,01 0,44 -22,55
298,6 0,47 7,49 0,6 1,46 4,74 0,1 1,61 0,45 0,08 0,63
CA-79
595,3 0,46 7,07 1,44 2,93 3,89 0,17 0,29 0,3 0,07 0,55 -23,67
636,1 0,45 7,93 0,59 1,51 3,92 0,09 0,39 0,45 0,1 0,49 -22,59
681,4 0,35 6,71 0,62 0,93 2,49 0,05 0,52 0,3 0,11 0,37
685,5 0,4 7,26 0,86 1,07 2,03 0,11 0,31 0,14 0,06 0,28 -21,61
694,7 0,34 6,07 0,44 0,85 2,44 0,04 0,55 0,32 0,11 0,4
698,3 0,4 7,28 0,49 1,09 2,72 0,05 0,59 0,41 0,13 0,37
723,6 0,46 8,21 0,55 1,16 3,38 0,04 1,25 0,63 0,16 0,41
728,5 0,5 6,94 0,68 0,89 2,82 0,07 0,36 0,12 0,04 0,41 -23,5
730,5 0,48 7,46 0,59 0,9 2,8 0,03 0,33 0,14 0,04 0,38
CA-87
437,5 0,39 6,29 3,26 2,2 2,65 0,19 0,18 0 0 0,42 -22,62
489,6 0,43 7,59 0,8 1,39 3,96 0,11 0,43 0,23 0,05 0,52 -23
500 0,27 5,63 0,46 0,72 2,41 0,04 0,54 0,64 0,23 0,43
507 0,36 7,81 0,68 1,55 4,73 0,06 0,41 0,44 0,08 0,61
512 0,41 7,57 0,62 1,29 3,31 0,04 0,64 0,46 0,12 0,44
516 0,39 7,28 0,67 1,84 5,2 0,05 0,75 1,09 0,18 0,71
520,2 0,4 6,65 0,85 1,35 3,38 0,09 0,59 2,18 0,56 0,51 -22,62
HV-44
232 0,45 8,02 1,18 1,25 3,17 0,04 0,72 0,18 0,05 0,4
233 0,36 6,99 0,58 1,21 4,47 0,03 3,81 2,65 0,52 0,64
234 0,35 7,1 1,08 1 3,72 0,03 7,03 1,9 0,44 0,52
235 0,39 6,41 1,01 1,01 4,78 0,05 4,28 2,65 0,48 0,75
236 0,27 7,83 1,38 1,05 2,5 0,03 2,85 1,68 0,59 0,32
238 0,32 6,16 2,16 0,89 4,41 0,04 1,02 2,56 0,51 0,72
249,6 0,39 8,29 1,37 1,44 3,33 0,04 0,47 0,65 0,17 0,4
250,8 0,42 7,9 0,8 1,32 3,75 0,04 3,07 1,74 0,4 0,47
252 0,42 7,8 0,92 1,29 3,76 0,06 0,65 1,24 0,29 0,48
253,2 0,39 7,47 1,01 1,33 4,46 0,04 1,56 2,38 0,46 0,6
253,6 0,33 5,88 0,92 1,02 7,1 0,03 6,17 4,05 0,5 1,21
254 0,28 5,37 0,97 0,91 6 0,03 9,46 4,75 0,69 1,12
254,8 0,32 7,43 1,21 1,36 4,72 0,05 1,91 3,65 0,67 0,64
255,2 0,28 5,47 0,8 0,81 5,35 0,03 13 4,37 0,71 0,98
255,6 0,36 6,76 0,44 1,18 4,2 0,05 10,1 3,28 0,68 0,62
256 0,37 5,68 0,56 0,91 5,01 0,04 2,9 6,65 1 0,88
256,8 0,35 6,06 0,62 0,97 4,61 0,05 8,12 4,05 0,77 0,76
257,6 0,33 5,96 0,72 0,94 5,88 0,03 13,3 4,55 0,67 0,99
258 0,35 6,26 1,01 1,11 6,75 0,05 11,2 5,01 0,65 1,08
258,4 0,33 5,7 0,86 0,95 6,07 0,04 1,41 4,08 0,59 1,06
271,2 0,45 7,22 0,63 0,97 3,99 0,05 0,59 4,42 0,96 0,55
MAG-1 0,45 8,79 0,98 1,83 4,83 0,09
SCo-1 0,37 6,52 1,83 1,44 3,62 0,05
Core Sample V Cr Co Ni Cu Zn Mo U EFV EFCr EFCo EFNi EFCu EFZn EFMo EFU Cu/ Mo
Mo/TOC (x10-4)
CA-53
261,7 70 48 13 24,2 29,4 48,6 6,6 5,7 0,6 0,6 0,8 0,4 0,7 0,6 5,7 2,1 4,45 12,41
271,4 107 64 14,7 26,7 48,4 85,2 6,4 5,7 1 0,8 0,9 0,5 1,3 1 5,8 2,2 7,56 9,67
276,3 65 48 10,6 21,7 54,6 59,2 4,9 5 0,6 0,6 0,6 0,3 1,3 0,7 4,2 1,8 11,14 6,27
291,5 78 48 12,5 22,5 53,1 120 4,9 4,9 0,7 0,6 0,8 0,4 1,4 1,5 4,6 2 10,84 11,67
294,7 93 58 10,3 23,7 6,3 4,1 4,6 5,3 1 0,9 0,7 0,5 0,2 0,1 4,9 2,4 1,37 9,29
298,6 132 68 14,8 17,6 44,9 548 18,7 9,4 1,2 0,9 0,9 0,3 1,2 6,8 17,1 3,7 2,4 11,61
CA-79
595,3 109 46 14,8 27,3 29,4 49,2 4,4 5,4 1 0,6 1 0,5 0,8 0,6 4,3 2,3 6,68 15,07
636,1 120 50 13 25,2 43,2 87 3,9 5 1 0,6 0,8 0,4 1,1 1 3,4 1,9 11,08 9,95
681,4 92 55 9,2 21,4 40,6 87,2 6,7 5,3 0,9 0,8 0,6 0,4 1,2 1,2 6,8 2,3 6,06 12,98
685,5 94 39 7,9 38,3 36,2 74,2 7,5 8,3 0,9 0,5 0,5 0,7 1 1 7,1 3,4 4,83 24,43
694,7 83 49 16 24,5 43 71,9 6 4,8 0,9 0,8 1,2 0,5 1,4 1,1 6,8 2,3 7,17 10,91
698,3 99 61 14 28,4 28,8 55,3 7,2 5,8 0,9 0,8 0,9 0,5 0,8 0,7 6,8 2,4 4 12,2
723,6 104 72 19 34,9 28,1 87 6,2 5,2 0,9 0,9 1,1 0,6 0,7 1 5,2 1,9 4,53 4,96
728,5 85 43 13,2 22,4 10,5 47,4 4,6 4,8 0,8 0,6 0,9 0,4 0,3 0,6 4,5 2 2,28 12,89
730,5 61 53 12,4 24,2 19,7 31,1 5,2 4,5 0,6 0,7 0,8 0,4 0,5 0,4 4,8 1,8 3,79 15,76
CA-87
437,5 76 31 11,2 20,3 7,2 61,8 6,8 6,4 0,8 0,5 0,8 0,4 0,2 0,9 7,4 3 1,06 37,57
489,6 114 51 12,8 27,5 44,5 82 4,9 5,4 1 0,7 0,8 0,5 1,2 1 4,4 2,1 9,08 11,48
500 55 35 14,7 24,9 27,2 36,3 6,1 4,4 0,7 0,6 1,2 0,6 0,9 0,6 7,4 2,3 4,46 11,34
507 101 55 14,1 27,3 42,2 84,5 5,3 5,8 0,8 0,7 0,8 0,5 1,1 1 4,6 2,2 7,96 12,83
512 92 51 10,9 23,1 41,8 86,9 7,2 6,3 0,8 0,7 0,7 0,4 1,1 1,1 6,5 2,5 5,81 11,27
516 93 56 24,6 58,2 41,2 51,3 8,6 5,6 0,9 0,8 1,68 1 1,1 0,7 8,1 2,3 4,79 11,41
520,2 86 47 15,5 31,6 33,7 53,8 7,8 5,1 0,9 0,7 1,1 0,6 1 0,8 8 2,3 4,32 13,24
HV-44
232 111 56 11,7 22,7 36,7 88,5 4,3 4,2 0,9 0,7 0,7 0,4 0,9 1 3,7 1,5 8,53 5,97
233 107 52 20 27,3 27,2 74,5 7,5 9,3 1 0,7 1,3 0,5 0,8 1 7,3 3,9 3,63 1,97
234 105 41 13,7 17,9 27,4 33,8 6,4 7 1 0,6 0,9 0,3 0,8 0,4 6,2 2,9 4,28 0,91
235 111 52 19,4 25,7 25,1 80,2 10,2 7,4 1,2 0,8 1,4 0,5 0,8 1,2 10,9 3,4 2,46 2,38
236 73 32 11,5 15 13,7 47,2 6,1 8,9 0,6 0,4 0,7 0,2 0,3 0,6 5,3 3,4 2,25 2,14
238 85 36 10,9 13,1 21 50,3 7,9 10,2 0,9 0,6 0,8 0,3 0,7 0,8 8,8 4,9 2,66 7,75
249,6 98 48 12,1 28,2 33,1 80,3 5,5 5,4 0,8 0,6 0,7 0,4 0,8 0,9 4,5 1,9 6,02 11,7
250,8 115 65 17,9 34 36,4 91,8 5 4,3 1 0,8 1,1 0,6 0,9 1,1 4,3 1,6 7,28 1,63
252 118 57 17,3 37,8 40,3 56,7 6 5,2 1 0,7 1 0,6 1 0,7 5,3 2 6,72 9,23
253,2 115 55 18,1 32,2 35,3 51,8 5,6 5,5 1 0,7 1,1 0,6 0,9 0,6 5,1 2,1 6,3 3,59
253,6 128 52 17,4 29,4 36,6 35,4 10 4,6 1,5 0,9 1,4 0,6 1,2 0,6 11,6 2,3 3,66 1,62
254 141 51 21,4 31,4 35,9 85 14,1 6,8 1,8 0,9 1,9 0,8 1,3 1,5 18 3,7 2,55 1,49
254,8 81 33 14,6 15,9 21,7 70,1 10,3 7,9 0,7 0,4 0,9 0,3 0,6 0,9 9,5 3,1 2,11 5,39
255,2 86 37 12,8 17,8 18,5 49,5 13,9 8,8 1 0,7 1,1 0,4 0,7 0,8 17,4 4,8 1,33 1,07
255,6 130 54 19,8 29 75,2 121 14,4 10,6 1,3 0,8 1,4 0,6 2,2 1,7 14,6 4,6 5,22 1,43
256 114 51 11,8 23,8 37,9 40,6 24,3 8,8 1,4 0,9 1 0,5 1,3 0,7 29,3 4,6 1,56 8,38
256,8 131 50 19 23,6 45,5 64,5 15,1 11,2 1,5 0,8 1,5 0,5 1,5 1 17 5,5 3,01 1,86
257,6 143 53 18,1 27,3 56,5 61,7 18 10,3 1,6 0,9 1,4 0,6 1,9 1 20,6 5,1 3,14 1,35
258 120 47 18 26 36,4 72,6 17,3 8,6 1,3 0,7 1,3 0,5 1,1 1,1 18,9 4,1 2,1 1,54
258,4 109 51 20 21,5 33,9 86 11 6,6 1,3 0,9 1,6 0,5 1,1 1,4 13,2 3,4 3,08 7,8
271,2 94 61 14,8 30 32,5 54,3 4 3,3 0,9 0,8 1 0,5 0,9 0,7 3,8 1,3 8,13 6,78
MAG-1 164 109 22,3 50,9 27,7 115,3 5,7 4,8
SCo-1 154 75 11,7 26,6 26,5 84,1 4 3,6
analysis, approximately 250 mg sample was weighed into beakers, to which 20 ml of 1N HCl were added, then hea-ted on a hot plate at 90 °C for 12 hours to dissolve carbo-nates. he samples were then iltered and the solid residue was transferred to crucibles, dried in an oven at 65°C for 12 hours. he dry samples were subsequently analyzed by a LECO C/S Determinator, CS-244. For S analysis, appro-ximately 250 mg of untreated sample was weighed directly into a crucible and analyzed by the LECO Determinator.
Pyrite Fe was calculated based on pyrite stoichiometry [Fepy = Spyx (At.wt.Fe/2xAt.wt.S)]. Pyrite S (Spy = Stotal-Sorg) was calculated from the relation between TOC and organic S, where Sorg = 0.2 x TOC (Bein et al. 1990).
Nine samples were analyzed for δ13C in kerogen.
Approximately 2 g of sample powder was weighed into pyrex vial, and bitumen was extracted with methylene chloride. After the liquid fraction was pipetted out, the sediment was air-dried for 12 hours, and subsequently digested by the HF-BF3 demineralizing procedure of Robl and Davis (1993). Between 2 and 5 mg of treated sam-ple was weighed into quartz tubes and cupric oxide was added as an oxidant. he tubes were sealed and heated in an oven at 800°C for 12 hours. he carbon dioxide pro-duced was puriied by distillation in a vacuum line and
subsequently analyzed for carbon isotopes with a Finnigan MAT 252 mass spectrometer.
RESULTS
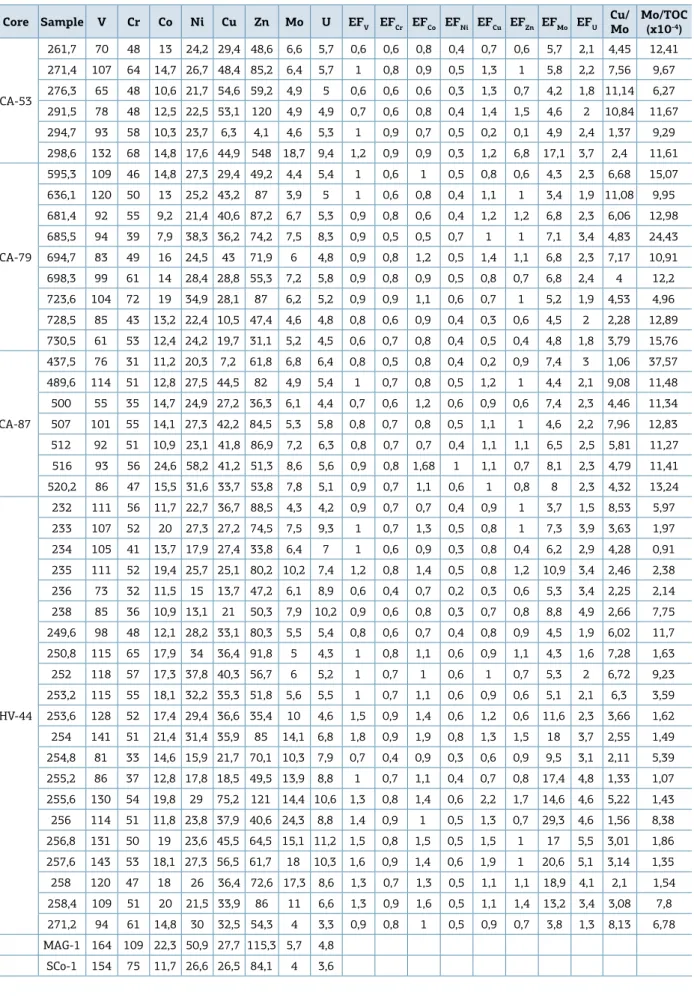
Geochemical data measured and calculated ratios for 43 samples of the Irati Formation are given in Table 1 (major elements, carbon isotopes, TOC and sulfur con-tent, degree of pyritization, and FeT/Al ratio) and Table 2 (trace elements, enrichment factors, and Cu/Mo and Mo/ TOC [x 10-4] ratios). he elemental concentrations for
indi-vidual cores indicate a positive correlation between Ti and Al, Cr and V (Fig. 3), implying that these elements were derived from detrital sources, and that V and Cr were not measurably enhanced by reduction from the water column. In the cores CA-53, CA-79, and CA-87, there is a positive correlation between Ca, Mg, and Mn, which exhibit an inverse correlation with elements characteristic of the detri-tal fraction (Fig. 3), indicating that these are present in the carbonate fraction.
he use of trace element concentrations to reconstruct paleoenvironmental conditions requires an assessment of the degree of enrichment or depletion of a trace element in a
Figure 3. Co-variation between Ti, Al, Cr and V in samples from core CA-79, which show an inverse correlation
with Ca and Mn.
Concentration (wt %)
3 550
600
650
700
750
4 5 6 7 8 9 25 50 75 100 125 0 5 10 15 20
Concentration (wt %) Concentration (ppm)
Depth (m)
Ca (x10)
Mn (x100)
sample relative to its concentration in a reference (Tribovillard
et al. 2006). We have calculated the enrichment factors (EF)
for the analyzed trace elements using the average shale as reference (Wedepohl 1971, 1991). Trace element concen-trations were normalized to Al and enrichment factors were calculated for V, Cr, Co, Ni, Cu, Zn, Mo, and U according to [EFelem = (Elem/Al)sample/(Elem/Al)av. shale] (Tribovillard et al.
2006, Huang et al. 2011). Any element with EFelem greater than 1 is enriched relative to the average shale, and EFelem less than 1 is depleted.
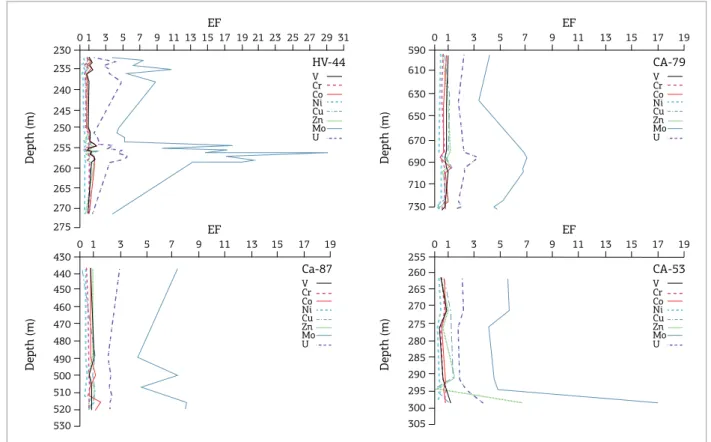
he EFs for the trace elements analyzed in each core are displayed in Figure 4. In all the cores, most trace elements are equal to or depleted in relation to the average shale, except for U and Mo, which are enriched in all the sam-ples. U shows enrichment typically two to three times the average shale, reaching a maximum of ive times the average shale in the lower organic-rich bed in core HV-44 (Fig. 4). Mo shows enrichment factors typically between four to ive times the average shale, but in the organic-rich beds in core HV-44 Mo enrichment factor varies from six to 29 times the average shale (Fig. 4). he lower and upper organic-rich beds in HV-44 are clearly marked by the enrichment in U and Mo, which suggest fully anoxic conditions during the deposition of these layers.
To further investigate the relation between Mo enri-chment and the presence of anoxic–sulidic conditions, we compared Mo and TOC concentrations and Mo/TOC ratios in the Irati Formation with those in modern anoxic marine environments studied by Algeo and Lyons (2006). hese authors observed that Mo burial luxes peak in weakly sulidic environments such as Saanich Inlet, and are lower in strongly sulidic environments such as the Black Sea and Framvaren Fjord (Algeo and Lyons 2006).
he Mo-TOC plot for the Irati Formation shows that most samples have very low Mo and TOC concentrations in comparison with modern anoxic marine environments (Fig. 5). he most organic-rich samples from core HV-44 scattered along a regression line with very low slope, even lower than that of sediments from the Black Sea (Fig. 5). his indicates that the depositional environment of the Irati shales was limited in Mo but not in organic carbon, implying a strongly anoxic water column.
Mo/TOC ratios are useful for distinguishing degrees of restriction in anoxic marine environments (Algeo and Lyons 2006). Values of Mo/TOC (x 10-4) greater than 35 are
indi-cative of weakly restricted environments, values between 15 and 35 of moderately restricted, and less than 15 of strongly restricted, sulidic environments (Algeo and Lyons 2006).
Figure 4. Enrichment factors for the redox-sensitive elements in the Irati Formation along the studied cores.
Depths in which the samples were collected are in meters.
Depth (m)
230
0 1 3 5 7 9 11 13 15 17 19 21 23 25 27 29 31
235 240 245 250 255 260 265 270 275 EF HV-44 V Cr Co Ni Cu Zn Mo U Depth (m) 430
0 1 3 5 7 9 11 13 15 17 19
440 450 460 470 480 490 500 510 530 520 EF Ca-87 V Cr Co Ni Cu Zn Mo U Depth (m) 590
0 1 3 5 7 9 11 13 15 17 19
610 630 650 670 690 710 730 EF CA-79 V Cr Co Ni Cu Zn Mo U Depth (m) 255
0 1 3 5 7 9 11 13 15 17 19
he Mo/TOC ratios calculated for the analyzed samples show that all but three of them (one from CA-87 and two others from CA-79) are lower than 15 (Fig. 6), suggesting that the Irati shales were deposited under strongly restricted,
sulidic conditions. he positive co-variation between Mo and TOC (especially in HV-44 samples) implies that most Mo resides in the organic matter (Algeo and Lyons 2006).
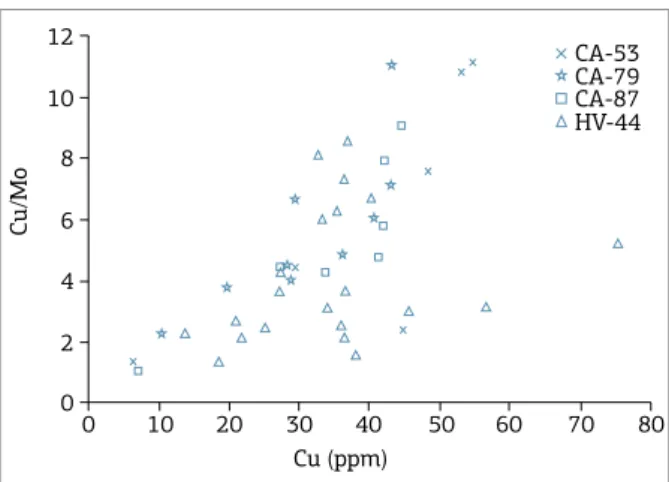
he use of Cu concentration and Cu/Mo ratios may shed light on whether the reducing conditions (and consequently enrichment in redox-sensitive elements) were triggered by restricted watermass renewal or stagnation, or by increased organic lux (i.e. increased paleoproductivity). In the pre-sence of a high organic lux, Ni and Cu are typically enri-ched in the sediments, but not Mo (Tribovillard et al. 2006). Under strongly anoxic, sulidic conditions, Cu, U, and V, plus Mo in the case of euxinic conditions, are enriched in the sediments (Tribovillard et al. 2006). he plot between Cu concentration and Cu/Mo ratio in the samples from the Irati Formation display a positive co-variation (Fig. 7), suggesting that the enrichments in these redox-sensitive ele-ments were due to increased organic lux rather than prior bottom-water anoxia, since the Mo concentration is appro-ximately constant.
TOC, S, and Fe contents were used to calculate the degree of pyritization (DOPT) and FeT/Al ratio (Algeo and Maynard 2008, Lyons and Severmann 2006) (Table 1). All the samples from the Irati Formation in the cores CA-53, CA-79, and CA-87, except for one in CA-87, have low DOPT values (< 0.3)
Mo (ppm)
TOC (wt%) Saanich
Inlet
Cariaco Basin
Framwaren Fjord
Black Sea 100
90
80
70
60
50
40
30
20
10
0
0 2 4 6 8 10 12 14
CA-53 CA-79 CA-87 HV-44
Figure 5. Scatter plot showing the relation between Total Organic Carbon (in wt %) and Mo (in ppm) for the samples collected from the studied cores in the Irati Formation. Regression lines for four modern anoxic marine environments (Saanich Inlet, Cariaco Basin, Framvaren Fjord and Black Sea) from Algeo and Lyons (2006).
Moderately restricted
Strongly restricted, sulfidic Strongly restricted, sulfidic Moderately restricted
4 0 230
240
250
260
270
12
8 16 20 24 28 32 36
Mo/TOC (x10-4) Mo/TOC (x10-4)
Deptm (m)
HV-44
CA-87
CA-79
CA-53 4
0 430
450
470
490
510
530
12
8 16 20 24 28 32 36
Deptm (m)
4 0 590
610
630
650
710
730 670
690
12
8 16 20 24 28 32 36
Deptm (m)
4 0 260
270
280
290
300
12
8 16 20 24 28 32 36
Deptm (m)
Figure 6. Mo/TOC (x10-4) ratios in the Irati Formation along the studied cores. Depths at which the samples were collected are given in meters. The dashed line is Mo/TOC (x10-4) = 15, limiting moderately restricted and strongly
(Fig. 8), which suggests deposition under aerobic conditions (Algeo and Maynard 2008). hese samples have low TOC con-tents (Fig. 9). One sample from CA-87 and most samples from HV-44 display DOPT between 0.3 and 0.6, compatible with a restricted environment. he intermediate DOPT could be due to reducing conditions in pore waters beneath oxygenated bottom waters, or euxinic deposition at sites with high sedimentation rates (Lyons and Severmann 2006). As sedimentation rates were
low during the deposition of the Irati Formation, the interme-diate DOPT values are probably indicative of pore-water anoxia beneath oxygenated bottom waters. hree samples from core HV-44 have DOPT less than 0.3, and the samples collected in the lower, organic-rich bed in this core display DOPT grea-ter than 0.6, suggesting that during the deposition of this bed the conditions were inhospitable (Algeo and Maynard 2008).
For higher TOC contents samples from the core HV-44, the observation that the DOPT is approximately constant (0.5 – 0.7) over varying amounts of organic matter (Fig. 9) points to an iron-limited environment (Raiswell and Berner 1985), suggesting that the main sulfur sink is organic mat-ter rather than pyrite (Bein el al. 1990). Under these cir-cumstances, there is a good correlation between Fe and S content, as in the case displayed in igure 10. he fact that all the data from HV-44 plot along a line with slope grea-ter than the pyrite line in the Fe-S diagram (Fig. 10) is yet another evidence of Fe limitation.
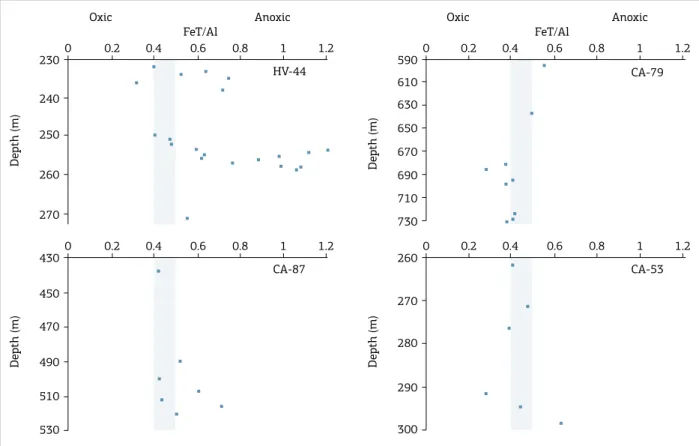
FeT/Al ratios for the Irati Formation are variable in the samples from the diferent cores studied (Fig. 11). Most sam-ples from the core CA-53 have FeT/Al between 0.4 and 0.5, with only one sample greater than 0.5, suggesting domi-nantly suboxic conditions (Lyons and Severmann 2006, Algeo and Maynard 2008). FeT/Al ratios from the core
12
10
8
6
4
2
0
0 10 20 30 40 50 60 70 80
Cu/Mo
Cu (ppm)
CA-53 CA-79 CA-87 HV-44
Figure 7. Plot of Cu concentration (in ppm) and Cu/Mo
ratio for the Irati samples in the studied cores.
0 230
240
250
260
270
0.2 0.4 0.6 0.8 1
HV-44
CA-87
CA-79
CA-53
0 0.2 0.4 0.6 0.8 1 0.2 0.4 0.6 0.8 1
430
450
470
490
510
530
Deptm (m)
0.2 0.4 0.6 0.8 1
0 590
610
630
650
710
730 670
690
Deptm (m)
4 0 260
270
280
290
300
Deptm (m)
Aerobic Restricted Inhospitable Aerobic Restricted Inhospitable
DOP total DOP total
Depth (m)
Figure 8. Degree of Pyritization in the Irati Formation along the studied cores. Depths at which the samples were
collected are given in meters. The dashed lines indicate Degree of Pyritization equals to 0.3 and 0.6, which limit
CA-79 are highly variable, with most samples displaying ratios less than 0.4 and some equal to or greater than 0.5, attesting varying degree of oxygenation. All the samples in the core CA-87 display FeT/Al greater than 0.4, indicating suboxic to anoxic conditions (Lyons and Severmann 2006, Algeo and Maynard 2008). In HV-44, FeT/Al ratios in almost all the samples are greater than 0.5, some between 0.4 and 0.5, and only one sample displays FeT/Al less than
0.4, thus indicating suboxic to anoxic conditions (Lyons and Severmann 2006, Algeo and Maynard 2008), especially in samples from the two organic-rich beds, which display very high FeT/Al (Fig. 11).
It is clear from the results reported above that the black shales in the Permian Irati Formation are far from homo-geneous. he data suggest that most of the thickness of the Irati Formation is actually composed of rocks with less than 1% organic carbon, representing the normal, background sedimentation in the basin. he oil shales are restricted to
CA-53 CA-79 CA-87 10
0.9 0.8
0.7 0.6
0.5
0.4
0.3 0.2 0.1
0
0 2 4 6 8 10 12 14
HV-44
DOPtotal
TOC (wt%)
Figure 9. Plot of Total Organic Carbon versus Degree of Pyritization for the Irati samples in the studied cores.
CA-53 CA-79 CA-87 7
6 5 4
3
2 1
0
0 1 2 3 4 5 6 7 8
HV-44
Stotal (wt%)
Fe (wt%)
Pyrite line (S/Fe = 1.15)
Figure 10. Plot of Fe versus S in samples from the Irati Formation. High Total Organic Carbon samples display a slope greater than the pyrite line.
Figure 11. FeT/Al in the Irati Formation along the studied cores. Depths at which the samples were collected are given in meters. The gray area represents FeT/Al between 0.4 and 0.5, which correspond to suboxic conditions
(Lyons and Severmann 2006, Algeo and Maynard 2008). 0
230
240
250
260
270
0.2 0.4 0.6 0.8 1 1.2 0.2 0.4 0.6 0.8 1 1.2
0.2 0.4 0.6 0.8 1 1.2
0.2 0.4 0.6 0.8 1 1.2
HV-44
CA-87
CA-79
CA-53 0
430
450
470
490
510
530
Depth (m)
0 590
610
630
650
710
730 670
690
Depth (m)
0 260
270
280
290
300
Depth (m)
Depth (m)
Oxic Anoxic Oxic Anoxic
two main horizons less than 10-m thick (sampled only in the core HV-44), with sporadic increases in TOC detecta-ble only by chance when sampling at coarse intervals (e.g. at depths 298.6 m in the core CA-53 and 723.6 m in the core CA-79), since this is not macroscopically or petrographi-cally visible.
Paleoenvironmental reconstruction
of the Irati Formation
Based on the paleoredox proxies applied to the black shales of the Permian Irati Formation (redox-sensitive ele-ments, DOPT and FeT/Al), we interpret that, during the accumulation of these sediments, the redox boundary was usually located at the sediment-water interface. Trace ele-ment enrichele-ment factors suggest that the Irati shales were similar to the average shale, except during the deposition of the two organic-rich beds in the core HV-44, which show great enrichments in U and Mo, thus suggesting that fully anoxic conditions developed during the deposition of these layers. Likewise, the relation between Mo and TOC sug-gests that bottom waters were anoxic, sulidic at times, but not permanently anoxic, and that most Mo resides in the organic matter (Algeo and Lyons 2006).
he variable degree of oxygenation of bottom waters is also attested by DOPT and FeT/Al. Some samples have low DOPT and low FeT/Al (accompanied by low TOC contents), indicating deposition under aerobic conditions, and some with intermediate DOPT and intermediate FeT/ Al, indicating a restricted environment. he intermediate DOPT probably results from reducing conditions in pore waters beneath oxygenated bottom waters (Lyons and Severmann 2006). Samples in the lower organic-rich bed in HV-44 have high DOPT and very high FeT/Al, sug-gesting inhospitable, anoxic conditions during the depo-sitions of these sediments (Lyons and Severmann 2006, Algeo and Maynard 2008).
he intermittent anoxic conditions in the Irati Formation are also attested by sedimentological indicators of episo-dic ventilation (probably due to storm activity), such as the presence of interbedded calcarenites with hummocky cross-stratiication, silty laminae with small ripples (for-med by the migration of small bedforms), and bioclastic lag laminae (indicative of erosion) (Della Fávera 1987, Hachiro 1992, Lavina et al. 1991, Araújo et al. 2004). hese characteristics are similar to what was reported for the Posidonia Shale Formation (Early Toarcian) (Trabucho-Alexandre et al. 2012).
he constant DOPT over varying amounts of organic matter and the positive correlation between Fe and S points to an iron-limited environment (Raiswell and Berner 1985),
where the main sulfur sink is organic matter rather than pyrite (Bein et al. 1990).
he results reported above suggest that most of the thi-ckness of the Irati Formation is actually composed of rocks with less than 1% organic carbon, representing the normal background sedimentation in the basin, with the oil sha-les restricted to two main horizons (sampled only in core HV-44). DOPT and FeT/Al, the most reliable indicators of euxinia (Lyons and Severmann 2006), show that euxinic conditions were reached only at times during the deposi-tion of the Irati Formadeposi-tion, and they were responsible for the formation of the intervals richest in organic matter.
he positive correlation between Cu and Cu/Mo ratio sug-gests that bottom-water anoxia was driven by increased organic lux. he hypothesis that primary productivity blooms led to the accumulation of the Irati organic-rich muds is supported by evidence provided by Araújo (2001). his evidence includes:
1. the overwhelming predominance of amorphous organic matter in the organic-rich horizons (constituting ~92% of the organic matter) as opposed to its contribution in organic-poor rocks (about 2% of the organic mat-ter). Amorphous organic matter is believed to be algal in origin, and thus its disproportionate contribution in the organic-rich beds is taken as an indication of algal blooms. he occurrence of algal blooms is supported by the more positive δ13C values of TOC, increased from
-27‰ to between -25 and -22 ‰ in the organic-rich beds (Araújo 2001). Amorphous organic matter is also a very labile component, easily degraded by aerobes, and together with the high hydrogen index of the orga-nic matter (> 500 mg HC/g TOC) in the orgaorga-nic-rich sediments, points to a higher degree of preservation;
2. the increase in the biomarkers pristane and phytane in the organic-rich shales, which implies a better preservation of chlorophyll, the precursor of both isoprenoids (Araújo 2001). his suggests that high organic carbon rain ove-rwhelmed the capacity of heterotrophic organisms to con-sume labile organic carbon, which then was preserved in the sediments under conditions of bottom-water anoxia (Araújo 2001);
Even though there seems to be strong evidence to support the idea that an increase in primary productivity led to bot-tom-water anoxia and the accumulation of the organic-rich sediments of the Irati Formation, the cause of the productivity bloom is still open. In the case of the Paraná Basin, it is rather unlikely that upwelling played a role in the accumulation of the black shales. he paleogeographic setting of this basin during the Permian was not favorable for coastal upwelling, as during wintertime a low-pressure center would sit over the sea and the winds would push the currents onshore. Basin-centered upwelling, on the other hand, is a likely possibility. However, other than the deposition of organic muds, there are no sedimentological indicators of ancient upwelling zones, such as phosphorite deposits and bedded biogenic cherts (Parrish
et al. 1983, Parrish 1995). Indeed, a high continental runof
in the Paraná Basin would be a more likely explanation, since during the time of deposition of the Irati Formation the main part of this basin was situated in the mid-latitude humid zone, subject to high precipitation rates.
he Irati Formation was probably deposited in a salinity-s-tratiied body of water, with a positive water balance. he fact that the organic matter in the Irati Formation has a terrestrial component also compares favorably with the scenario des-cribed above, the terrestrial constituents being brought in by rivers lowing to the landlocked sea where these sediments were deposited. Stratiication is also consistent with data from the fossil and rock record, which includes apparently paradoxical salinity indicators. Fresh water indicators include the crus-tacean Clarkecaris (Mussa et al. 1980), the algae Botryococcus
(Cazzulo-Klepzig et al. 1989), and the ish Xenacanthus pricei
(Richter 1985). Marine conditions are indicated by the pre-sence of glauconite pellets (Hachiro et al. 1993, Santos Neto and Cerqueira 1993), commonly associated with polyaxio-nic sponge spicules (Amaral 1971), the occurrence of the crustacean Paulocaris (Mussa et al. 1980), brachiopods, the ostracode Bairdia sp., foraminifers (Campanha 1985), and acritarchs (Cazzulo-Klepzig et al. 1989). he impoverished fauna is composed of organisms that tolerate low or variable salinity (e.g. Lingula sp. and Paulocaris), suggesting either bra-ckish waters or large salinity luctuations. Mesosaurids, the swimming reptiles ubiquitous to the Irati and White Hill Formations, did not tolerate severely saline environments (Oelofsen and Araújo 1983). In stratiied bodies of water, the vertebrate fauna would probably inhabit the top, relatively fresh water layer (Oelofsen 1987, Oelofsen and Araújo 1983).
CONCLUSIONS
he geochemical paleoredox indicators in the Irati black shales suggest that:
1. the bottom waters were not persistently anoxic during the deposition of the Irati Formation, but rather oxy-gen concentrations varied signiicantly during depo-sition. he variable degree of oxygenation of bottom waters is attested by DOPT and FeT/Al: samples with low DOPT and low FeT/Al indicating deposition under aerobic conditions, samples with intermediate DOPT and intermediate FeT/Al, a restricted environment, and samples with high DOPT and very high FeT/Al (in the lower, organic-rich bed in HV-44) suggest inhospitable, anoxic conditions;
2. trace element enrichment factors in most samples sug-gest that the Irati shales were similar to the average shale. he most organic-rich beds in the core HV-44 show great enrichments in U and Mo, indicating that they were deposited under euxinic conditions, in an inhos-pitable environment;
3. the intermittent anoxic conditions in the Irati Formation are also attested by sedimentological indicators of epi-sodic ventilation, including the presence of interbedded calcarenites with hummocky cross-stratiication, silty laminae with small ripples, and bioclastic lag laminae;
4. the Irati Formation was deposited in a salinity-strati-ied body of water, with a positive water balance pre-dominantly dysoxic to oxic conditions, with episodic, temporary anoxia in the bottom waters. he positive correlation between Cu and Cu/Mo ratio suggests that bottom-water anoxia was driven by increased organic lux (algal blooms). he algal blooms are suggested by the overwhelming predominance of amorphous organic matter, the increase in the biomarkers pristane and phy-tane, and the change in sedimentary fabric (from bio-turbated to laminated) in the organic-rich horizons (Araújo 2001);
5. the main control on the accumulation of the organi-c-rich rocks of the Irati Formation was increased deli-very of organic matter to the sediment as a consequence of high primary production in the water column, pro-bably driven by riverine nutrient input. Anoxia thus probably arose as a consequence of increased producti-vity, not as the primary driver in the formation of these organic-rich rocks.
ACKNOWLEDGEMENTS
Sciences, and the Paleogeographic Atlas Project. Lisa Pratt is thanked for access to the Laboratory of Biogeochemistry at Indiana University – Bloomington. Brazil’s Department of Mining and Energy (DNPM/MME) and the Brazilian
Geological Survey (CPRM) are thanked for access to cores and samples. We are greatly in debt to Laury Araújo for the C isotope and biomarker data provided, and fruitful discus-sions throughout the development of this study.
Algeo T.J., Lyons T.W. 2006. Mo–total organic carbon covariation in modern anoxic marine environments: Implications for analysis of paleoredox and paleohydrographic conditions. Paleoceanography,
21(1):PA1016. DOI:10.1029/2004PA001112.
Algeo T.J., Maynard J.B. 2008. Trace-metal covariation as a guide to water-mass conditions in ancient anoxic marine environments.
Geosphere,4(5):872-887.
Algeo T.J, Schwark L., Hower, J.C. 2004. High-resolution geochemistry and sequence stratigraphy of the Hushpuckney Shale (Swope Formation, eastern Kansas): implications for climato-environmental dynamics of the Late Pennsylvanian Midcontinent Seaway. Chemical Geology,206(3-4):259-288.
Amaral S.E. 1971. Geologia e Petrologia da Formação Irati (Permiano) no Estado de São Paulo. Boletim IGA, 2:03-81.
Anjos C.W.D., Meunier A., Guimarães E.M., El Albani A. 2010. Saponite-rich black shales and nontronite beds of the Permian Irati Formation: sediment sources and thermal metamorphism (Paraná Basin, Brazil). Clays and Clay Minerals, 58(5):606-626.
Araújo L.M. 2001. Análise da Expressão Estratigráica dos Parâmetros de Geoquímica Orgânica e Inorgânica nas Sequências Deposicionais
Irati. PhD Thesis, Programa de Pós-Graduação em Geociências, Universidade Federal do Rio Grande do Sul, Porto Alegre, 302 p.
Araújo L.M., Rodrigues R., Scherer C.M.S. 2004. Interrelação entre a fábrica sedimentar, o conteúdo orgânico e o potencial redox do ambiente deposicional, deduzida das litofácies de rampa distal das sequências deposicionais da Formação Irati, Permiano da Bacia do Paraná. Boletim de Geociências da PETROBRAS, 12(2):429-434.
Arnaboldi M., Meyers P.A. 2007. Trace element indicators of increased primary production and decreased water-column ventilation
during deposition of latest Pliocene sapropels at ive locations
across the Mediterranean Sea. Palaeogeography, Palaeoclimatology, Palaeoecology, 249(3-4): 425-443.
Arthur M.A., Sageman B.B. 1994. Marine black shales: depositional mechanisms and environments of ancient deposits. Annual Review of Earth and Planetary Sciences, 22:499-551.
Bein A., Almogi-Labin A., Sass E. 1990. Sulfur sinks and organic carbon relationships in Cretaceous organic-rich carbonates: implications for evaluation of oxygen-poor depositional environments. American
Journal of Sciences, 290:882–911.
Berrocoso A.J., MacLeod K.G., Martin E.E., Bourbon E., Londono C.I., Basak C. 2010. Nutrient trap for Late Cretaceous organic-rich black shales in the tropical North Atlantic. Geology, 38(12):1111-1114.
Brumsack H.-J. 2006. The trace metal content of recent organic carbon-rich sediments: Implications for Cretaceous black shale formation. Palaeogeography, Palaeoclimatology, Palaeoecology,
232(2-4):344-361.
Calvert S.E., Pedersen T.F. 1992. Organic carbon accumulation and preservation in marine sediments: how important is anoxia?
In: Whelan J.K., Farrington J.W. (eds.) Organic matter: Productivity, accumulation, and preservation in recent and ancient sediments, New York, Columbia University Press, p. 231-263.
REFERENCES
Calvert S.E., Pedersen T.F. 1993. Geochemistry of Recent oxic and anoxic marine sediments: implications for the geological record.
Marine Geology, 113(1-2):67-88.
Campanha V.A. 1985. Ocorrência de braquiópodes inarticulados na Formação Irati, no Estado de São Paulo. Anuário da Academia
Brasileira de Ciências, 57(1):115-116.
Canield D.E. 1994. Factors inluencing organic carbon preservation
in marine sediments. Chemical Geology, 114(3-4):315-329.
Carroll A.R., Bohacs K.M. 2001. Lake-type controls on petroleum source rock potential in nonmarine basins. AAPG Bulletin,
85(6):1033-1053.
Cazzulo-Klepzig M., Piccoli A.E.M., Marques-Toigo M. 1989.
Reconhecimento de um marco estratigráico com signiicado
paleoecológico no permiano da Bacia do Paraná (grupos Guatá e Passa Dois). In: 11o Congresso Brasileiro de Paleontologia, Curitiba,
Anais, p. 971-981.
Correa da Silva Z.C., Cornford C. 1985. The kerogen type, depositional environment and maturity of the Irati Shale, Upper Permian of Paraná Basin, southern Brazil. Organic Geochemistry, 8(6):399-411.
Crusius J., Calvert S., Pedersen T., Sage D. 1996. Rhenium and molybdenum enrichments in sediments as indicators of oxic,
suboxic and sulidic conditions of deposition. Earth and Planetary
Science Letters,145(1-4):65-78.
Crusius J., Pedersen T., Calvert S., Cowie G.L., Oba T. 1999. A 35 kyr
geochemical record from the Sea of Japan of organic matter lux
variations and changes in intermediate water oxygen concentrations.
Paleoceanography, 14(2):248-259.
Della Fávera J.C. 1987. Tempestades como agentes de poluição ambiental e mortandade em massa no passado geológico: caso das formações Santana (Bacia do Araripe) e Irati (Bacia do Paraná). Boletim de Geociências da PETROBRAS, 1(2):239-240.
Demaison G.J., Moore G.T. 1980. Anoxic environments and oil source bed genesis. AAPG Bulletin, 64(8):1179-1209.
Ekdale A.A., Mason T.R. 1988. Characteristic trace-fossil association in oxygen-poor sedimentary environments. Geology, 16(8):720-723.
Emerson S.R., Huested S.S. 1991. Ocean anoxia and the concentrations of molybdenum and vanadium in seawater. Marine Chemestry, 34(3-4): 177-196.
França A.B., Milani E.J., Schneider R.L., López P.O., López M.J., Suárez S.R., Santa Ana H., Wiens F., Ferreiro O., Rossello E.A., Bianucci H.A., Flores R.F.A., Vistalli M.C., Fernandez-Seveso F., Fuenzalida R.P., Munoz N. 1995. Phanerozoic correlation in southern South America.
In: Tankard A.J., Soruco R.S. & Welsink, H.J. (eds.) Petroleum Basins of South America. AAPG/YPF/Acad. Nac. Ci. Bolivia. AAPG Memoir 62, p. 129-161.
Ganeshram R.S., Calvert S.E., Pedersen T.F., Cowie G.L. 1999. Factors controlling the burial of organic carbon in laminated and bioturbated
sediments of NW Mexico: implications for hydrocarbon preservation. Geochimica et Cosmochimica Acta, 63(11/12):1723-1734.
Goldberg K. 2001. The Paleoclimatic Evolution of the Permian of the Paraná Basin in southern Brazil. PhD Thesis, Department of Geophysical Sciences, University of Chicago, 267 p.
Goldberg T., Strauss H., Guo Q., Liu C. 2007. Reconstructing marine redox conditions for the Early Cambrian Yangtze Platform: Evidence from biogenic sulphur and organic carbon isotopes. Palaeogeography, Palaeoclimatology, Palaeoecology, 254(1-2):175-193.
Hachiro J., Coimbra A.M., Matos S.L.F. 1993. O caráter cronoestratigráico
da unidade Irati. In: 1o Simpósio sobre cronoestratigraia da Bacia do Paraná, Rio Claro, Resumos, IG-UNESP, p. 62-63.
Hachiro, J. 1992. Bone beds e shell beds como feições diagnósticas de tempestitos da Formação Irati no Estado de São Paulo. In: 37o Congresso Brasileiro de Geologia, São Paulo, Anais, p. 511-512.
Hatch J.R., Leventhal J.S. 1992. Relationship between inferred redox potential of the depositional environment and geochemistry of the Upper Pennsylvanian (Missourian) Stark Shale Member of the Dennis Limestone, Wabaunsee County, Kansas, U.S.A. Chemical Geology,99(1-3):65-82.
Huang J., Chu X., Jiang G., Feng L., Chang H. 2011. Hydrothermal origin of elevated iron, manganese and redox-sensitive trace elements in the c. 635 Ma Doushantuo cap carbonate. Journal of the
Geological Society, 168(3):805-816.
Joachimski M.M., Ostertag-Henning C., Pancost R.D., Strauss H., Freeman K.H., Littke R., Sinninghe-Damsté J.S., Racki G. 2001. Water column anoxia, enhanced productivity and concomitant changes in d13C and d34S across the Frasnian-Famennian boundary (Kowala – Holy Cross Mountains/Poland). Chemical Geology, 175(1-2):109-131.
Jones B., Manning D.A.C. 1994. Comparison of geochemical indices used for the interpretation of palaeoredox conditions in ancient mudstones. Chemical Geology, 111(1-4):111-129.
Kakuwa Y. 2008. Evaluation of palaeo-oxygenation of the ocean bottom across the Permian–Triassic boundary. Global and Planetary Change, 63(1): 40-56.
Lavina E.L., Araujo-Barberena D.C., Azevedo S.A.K. 1991. Tempestades de inverno e altas taxas de mortalidade de répteis mesossauros. Um
exemplo a partir do aloramento Passo São Borja, RS. Pesquisas,
18(1):64-70.
Lehmann B.T.F., Nägler T.F., Holland H.D., Wille M., Mao J., Pan J., Ma D., Dulski P. 2007. Highly metalliferous carbonaceous shale and Early Cambrian seawater. Geology, 35(5):403-406.
Lyons T.W., Severmann S. 2006. A critical look at iron paleoredox proxies: New insights from modern euxinic marine basins.
Geochimica et Cosmochimica Acta, 70(23):5698-5722.
Mello M.R., Koutsoukos E.A.M., Santos Neto E.V., Silva Telles A.C. Jr. 1993. Geochemical and micropaleontological characterization of lacustrine and marine hypersaline environments from Brazilian sedimentary basins. In: Katz B.G., Pratt L.M. (eds.) Source Rocks in a Sequence Stratigraphic Framework. AAPG Studies in Geology, v. 37, p. 17-34.
Meyers P.A. 2006. Paleoceanographic and paleoclimatic similarities between Mediterranean sapropels and Cretaceous black shales. Palaeogeography, Palaeoclimatology, Palaeoecology,
235(1-3):305-320.
Meyers S.R., Sageman B.B., Lyons T.W. 2005. Organic carbon burial rate and the Molybdenum proxy: Theoretical framework and application to Cenomanian-Turonian Oceanic Anoxic Event 2.
Paleoceanography,20(2):PA2002, doi:10.1029/2004PA001068.
Milani E.J., França A.B., Schneider R.L. 1994. Bacia do Paraná. Boletim
de Geociências da PETROBRAS, 8(1):69-82.
Milani E.J., Faccini U.F., Scherer C.M.S., Araújo L.M., Cupertino J.A. 1998. Sequences and stratigraphic hierarchy of the Paraná Basin (Ordovician to Cretaceous), Southern Brazil. Boletim IG-USP,
Série Cientíica, 29:125-173.
Milani E.J., Melo J.H.G., Souza P.A., Fernandes L.A., França A.B. 2007. Bacia do Paraná. Boletim de Geociências da PETROBRAS
15(2):265-287
Morford J.L., Russell A.D., Emerson S. 2001. Trace metal evidence for changes in the redox environment associated with the transition from terrigenous clay to diatomaceous sediment, Saanlich Inlet, BC.
Marine Geology, 174(1-4):355-369.
Morford J,L,, Emerson S. 1999. The geochemistry of redox sensitive trace metals in sediments. Geochimica et Cosmochimica Acta,
63(11-12):1735-1750.
Morford J.L., Emerson S., Breckel E.J., Kim S.H. 2005. Diagenesis of oxyanions (V, U, Re, and Mo) in pore waters and sediments from a continental margin. Geochimica et Cosmochimica Acta,
69(21):5021-5032.
Mussa D., Carvalho R.G., Santos P.R. 1980. Estudo estratigráico e
paleoecológico em ocorrências fossilíferas da Formação Irati, Estado de São Paulo, Brasil. Boletim IG-USP, 11:142-149.
Oelofsen B.W. 1987. The biostratigraphy and fossils of the Whitehill and Irati shale Formations of the Karoo and Paraná Basins. In: Gondwana Six: Stratigraphy, Sedimentology, and Paleontology, Geophys. Monogr. Ser., 41:131-138.
Oelofsen B., Araújo D.C. 1983. Palaeocological implications of the distribution of mesosaurid reptiles in the Permian Irati sea (Paraná Basin), South America. Revista Brasileira de Geociências, 13(1):1-6.
Parrish J.T. 1995. Paleogeography of Corg-rich rocks and the preservation versus production controversy. In: Huc A.-Y. (ed.) Paleogeography, Paleoclimate, and Source Rocks, AAPG Studies in Geology, 40:1-20.
Parrish J.T., Ziegler A.M., Humphreville R.G. 1983. Upwelling in the Paleozoic Era. In: Thiede J., Suess E. (eds.) Coastal Upwelling: Its Sediment Record (part B), Plenum Press. NATO Conference Series,
10B:553-578.
Pi D.-H., Liu C.-Q. Jiang S.-Y. 2013. Trace and rare earth element geochemistry of black shale and kerogen in the early Cambrian Niutitang Formation in Guizhou province, South China: Constraints for redox environments and origin of metal enrichments. Precambrian Research, 225:218-229.
Piper D.Z., Dean W.E. 2002. Trace-element deposition in the Cariaco Basin, Venezuela Shelf, under sulfate-reducing conditions - A history of the local hydrography and global climate, 20 ka to the present. U.S. Geology Survey Professional Paper1670. 41p.
Raiswell R., Berner R.A. 1985. Pyrite formation in euxinic and semi-euxinic sediments. American Journal of Science, 285:710-724.
Raiswell R., Buckley F., Berner R.A., Anderson T.F. 1988. Degree of pyritization of iron as a paleoenvironmental indicator of bottom-water oxygenation. Journal of Sedentary Research, 58(5):812-819.
Reolid M., Sebane A., Rodríguez-Tovar F.J., Marok A. 2012. Foraminiferal morphogroups as a tool to approach the Toarcian Anoxic Event in the Western Saharan Atlas (Algeria). Palaeogeography Palaeoclimatology Palaeoecology,
323-325:87-99.
Richter M. 1985. Paleoictiologia no Estado do Rio Grande do Sul,
Brasil: características da tafofauna e aloramentos fossilíferos.
Iheringia Série Geologia.19:29-45.
Robl T.L., Davis B.H. 1993. Comparison of the HF-HCl and HF-BF3 maceration techniques and the chemistry of resultant organic concentrates. Organic Geochemistry, 20(2):249-255.
Sageman B.B., Murphy A.E., Werne J.P., Straeten, C.A.V., Hollander D.J., Lyons T.W. 2003. A tale of shales: the relative roles of production, decomposition, and dilution in the accumulation of organic-rich strata, Middle-Upper Devonian, Appalachian Basin. Chemical Geology, 195(1-4):229-273.
Santos R.V., Souza P.A., Alvarenga C.J.S., Dantas E.L., Pimentel M.M., Oliveira C.G., Araujo L.M. 2006. Shrimp U-Pb zircon dating and palynology of bentonitic layers from the Permian Irati Formation, Paraná Basin, Brazil. Gondwana Research, 9(4):456-463.
Santos Neto E.V., Cerqueira J.R. 1993. Aplicação da geoquímica
orgânica na cronoestratigraia e paleogeograia da Formação Irati,
Bacia do Paraná. In: 1 Simpósio sobre Cronoestratigraia da Bacia do
Paraná, Rio Claro, Resumos, p. 71.
Sladen C.P. 1994. Key elements during the search for hydrocarbon in lake systems. In: Gierlowski-Kordesch E., Kelts K. (eds.) Global geological record of lake basins, Cambridge, Cambridge University Press, p. 3-17.
Stein M., Westermann S., Adatte T., Matera V., Fleitmann D., Spangenberg J.E., Föllmi K.B. 2012. Late Barremian–Early Aptian palaeoenvironmental change: The Cassis-La Bédoule section, southeast France. Cretaceous Research, 37:209-222.
Trabucho-Alexandre J., Dirkx R., Veld H., Klaver G., de Boer P.L. 2012. Toarcian Black Shales in the Dutch Central Graben: Record of Energetic, Variable Depositional Conditions During An Oceanic Anoxic Event. Journal of Sedimentary Research, 82(2):104-120.
Tribovillard N., Algeo T.J., Lyons T., Riboulleau A. 2006. Trace metals as paleoredox and paleoproductivity proxies: An update. Chemical Geology, 232(1-2):12-32.
Triguis J.A., Araújo L.M., França A.B., Winter W.R. 1996. Depositional environment and sequence stratigraphy of the Irati Formation (Late Permian) Paraná Basin – Brazil. In: 5th Latin American Congress on Organic Geochemistry, Cancun, Annals, p. 219-221.
Tyson R.V., Pearson T.H. 1991. Modern and ancient continental shelf anoxia: an overview. In: Tyson R.V., Pearson T.H. (eds.) Modern
and Ancient Continental Shelf Anoxia, Geological Society Special Publications, 58:1-26.
Wedepohl K.H. 1971. Environmental inluences on the chemical
composition of shales and clays. In: Ahrens L.H., Press F., Runcorn S.K., Urey H.C. (eds.) Physics and Chemistry of the Earth. Oxford, Pergamon, p. 305-333.
Wedepohl K.H. 1991. The composition of the upper Earth’s crust and the natural cycles of selected metals. In: Merian E. (ed.) Metals
and their Compounds in the Environment. VCH-Verlagsgesellschat,
Weinheim, p. 3-17.
Wignall P.B., Myers K.J. 1988. Interpreting benthic oxygen levels, in mudrocks: a new approach. Geology, 16(5):452-455.
Xiong Z., Li T., Algeo T., Chang F., Yin X., Xu Z. 2012. Rare earth element geochemistry of laminated diatom mats from tropical
West Paciic: Evidence for more reducing bottom waters and higher
primary productivity during the Last Glacial Maximum. Chemical Geology, 296-297:103-118.