USE OF THE VIDEO TRANSECT METHOD FOR CHARACTERIZING THE
ITACOLOMIS REEFS, EASTERN BRAZIL
Igor C. S. Cruz1,2*, Ruy K. P. Kikuchi1 and Zelinda M. A. N. Leão1
1
Universidade Federal da Bahia, Instituto de Geociências, Centro de Pesquisa em Geofísica e Geologia (Rua Barão de Jeremoabo s/n, 40170-290, Salvador, BA, Brasil)
2
Universidade Federal da Bahia, Instituto de Biologia, Curso de Pós-Graduação em Ecologia e Biomonitoramento (Campus de Ondina, 40170-010, Salvador, BA, Brasil)
A
B S T R A C TThe video-transect method consists of a field survey performed with a video-camera along a line of fixed length, with the registered images further analyzed using a computer. This method was successfully applied in Brazil for the first time in the coral reefs of Todos os Santos Bay. The main goal of this work was to define the minimum sampling effort needed to describe the coral community when the video-transect method was applied to a selected reef site, namely the Pedra do Silva Reef in the Itacolomis reef complex, inside the Corumbau Marine Extractive Reserve, in Southern Bahia. Each transect was analyzed throughout its length, in successive captured video frames. The findings revealed that six 20 m long transects with an analysis of twenty points per image (frame) was sufficient for sampling the broad taxonomic categories of hard corals and major reef benthos, and that the whole field operation could be performed during one dive per station.
R
E S U M OO método do vídeo-transecto consiste em uma filmagem do fundo marinho ao longo de uma seção linear, e as imagens são posteriormente analisadas, em laboratório, na tela de um computador. Este método foi aplicado pela primeira vez no Brasil nos recifes do interior da Baía de Todos os Santos, com resultados satisfatórios. O objetivo deste trabalho foi determinar qual seria o menor esforço amostral na aplicação do vídeo transecto para avaliar a comunidade de coral do recife Pedra do Silva, no complexo de recifes dos Itacolomis, na Reserva Extrativista Marinha de Corumbau, no sul do estado da Bahia. Cada transécto foi analisado em toda a sua extensão em quadros sucessivos gerados com o congelamento da imagem na tela de um computador. Os resultados obtidos apontam o número de seis transéctos de 20 m de comprimento para uma análise de vinte pontos por quadro como adequada para a identificação taxonômica das principais categorias dos corais construtores e dos componentes da biota bentônica dos recifes, podendo toda a operação ser executada durante apenas um mergulho por local de amostragem.
Descriptors: Sampling effort, Coral reefs, Video-transect, Itacolomis, Corumbau. Descritores: Esforço amostral, Recifes de coral, Vídeo-transécto, Itacolomis, Corumbau.
I
NTRODUCTIONCurrently there are at least five methods of ecological data acquisition applied in assessing and monitoring coral reefs along the Brazilian coast. These include: a) a version of the monitoring line-transect technique (LOYA, 1978) using a chain, elaborated ad hoc by Conservation International - Brazil for the Corumbau Marine Extractive Reserve; b) the point intercept transect (PIT) that was conducted in the Abrolhos region by Segal and Castro (2001); c) the Atlantic and Gulf Rapid Reef Assessment (GINSBURG et al., 1998), a protocol for reefs which has been applied along the coast of the State of Bahia (Abrolhos results in KIKUCHI et al., 2003a, 2003b); d) the technique used by the Reef Check program (FERREIRA; MAIDA, 2006); and e) the video-transect technique (DUTRA et al., 2006), which is the subject of this work, considering that it is a method that produces a permanent record which permits a further re-analysis of the acquired data.
purpose of assessing the status of coral reefs within the Todos os Santos Bay (DUTRA et al., 2006).
Advantages of the video-transect method include: a) the production of a permanent record of data acquired in the field, since the stored images allow for later re-investigation; b) a more consistent identification of organisms, as the images can be viewed repeatedly and sent to a specialist if necessary; and c) successful performance in water with low visibility, due to the short distance between the video-camera and the coral reef surface. The main disadvantage of this technique is the limited taxonomic resolution for the identification to the species level of some groups, especially those with reduced dimensions (VOGT et al., 1997; PAGE et al., 2001, DUTRA et al., 2006). Leujak and Ormond (2007) comparing the video-transect method with several other surveys methods, considered that the video method is the most appropriate for long-term monitoring programs since it is very-efficient and is also fairly accurate.
The objective of this work was to determine the minimum sampling effort for application of the video-transect method, in order to characterize the Itacolomis coral reef community.
M
ATERIAL ANDM
ETHODSLocation of Studied Reef Site
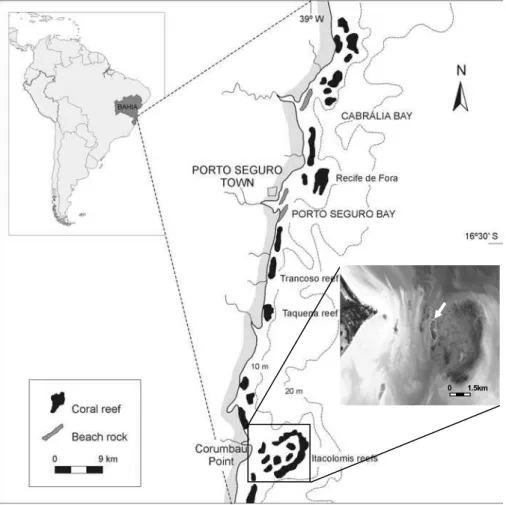
The work was performed at a selected site within the Itacolomis reef complex, thePedra do Silva Reef (16°53’16”S and 39°05’30”W) located inside the Corumbau Marine Extractive Reserve, which belongs to the municipalities of Porto Seguro and Prado, in the southern part of the coast of the State of Bahia, extending offshore from the coastline. The predominant reef structures, in depths around 20 m, are the “chapeirões”, mushroom-like coral pinnacles similar to those found in the Abrolhos area (LABOREL, 1969; LEÃO et al., 2003) (Fig. 1).
Fig. 1. Location of Itacolomis Reefs in the southern coast of the State of Bahia. Arrow in the image indicates the location of the Pedra do Silva Reef. Image source CBERS 2005_07_18, INPE.
0 1.5km
Acquisition of Field Data
Ten belt-transects were haphazardly located at the top of the Pedra do Silva Reef, and covering its northern half, in water depths of around 2.5 m (Fig. 1). Transect numbers one to four were performed on the NW border of the reef, numbers five and six, on the NE reef border, numbers seven and eight on the reef top and numbers nine and ten inside a deep pool on the reef top. All data were recorded using a high-resolution Sony MINI DV digital video-camera, model DCR-PC115, protected by a CHROMA housing especially developed for that video-camera. An aluminum rod was attached to the camera housing in order to maintain a constant 40 cm distance between the lens and the substrate. At this distance, the transect width was 0.2 m, allowing for a good image quality. The length of the belt-transects was of 20 m, because in the studied area most reefs are less than 25 m long. The maximum displacement speed of the diver was 3 m/min. The area covered by every belt-transect was equivalent to 4 m2. Ten belt-transects were completed, thus covering a total area of 40 m2, during two dives of one and half hour each.
Analysis of Laboratory Images
The images were transferred from the video-camera to the computer in a non-compressed AVI format. Every frame had 72 dpi, a resolution equivalent to 1440 x 960 pixels. Subsequently, the images were recorded on a DVD, which became the backup copy in addition to the raw images available on the MINI DV video tape. In order to preserve the quality of the images, no image compression was performed. Image analysis was carried out using a free-source type code program named VITRA (Video Transect, http://vitra.codigolivre.org.br/), especially developed to meet the needs of the video-transect method. During this work, a grid of 15 rows x 30 columns was used, which produced 450 possibilities. The images were left captured and random points were projected onto each frame. Organisms and substrate types under each point were recorded on a spreadsheet up to the possible highest taxonomic level.
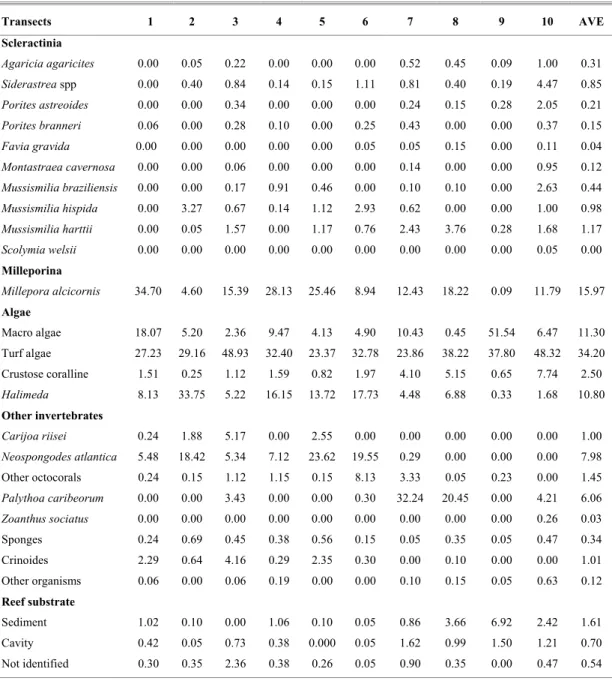
Stony corals, millepores and some octocorals were identified up to the species level by comparison with a reference collection, and according to description and illustrations given by Laborel (1970) and Castro (1994). The remaining cnidarians were identified up to genus or family level. Algae were identified in three functional groups: macroalgae, including two categories for the Halimeda genus, filamentous (turf) and crustose coralline. Sponges and crinoids were classified on a group basis. Additional organisms and substrate cover types included polichaetes, anemones, sea urchins, sediment, cavity and non-identified organisms (Table 1).
Estimation of Number of Points per Frame
Among the 10 belt-transects completed, three were randomly selected (numbers 4, 7 and 10) in order to evaluate the number of points per frame representing the best cost-effectiveness. Each belt-transect was completely analyzed, drawing 10, 20, 30, 40 and 50 points. Evaluation included: a) average coral coverage, which corresponds to the sum of the relative frequency of coral species along the entire belt-transect (ARONSON et al., 1994); b) average number of coral species identified, according to the number of points (number of coral species recorded was calculated for every analysis and subsequently the averages were calculated for every quantity of points) and c) relative cost, which was calculated based on the time spent on analysis of every belt-transect, dividing all costs by that of lowest value, thus indicating how many times costs varied, according to the lowest value (KREBS 1998 a, b). As expected, the lowest cost corresponded to the 10 points analysis, which average duration was 70 min.
Estimation of the Number of Belt-transects and of Video Frames
To find the number of transects that best represented the sampling site (i.e. the lowest number of transects approaching the maximum number of coral species found in the selected reef), the ten transects were graphically compared using the following estimators: number of species observed in each transect (Sobs index ) (COLWELL et al., 2004),
number of unique species (species that occurred in only one transect among all analyzed transects), number of duplicate species (species that occurred in only two transects among all transects analyzed), ICE (incidence-based coverage estimator of species richness), ACE (abundance-based coverage estimator of species richness) and Coleman richness estimation (Cole) (COLEMAN et al., 1982). All estimators were calculated using the software EstimateS, version 7.5.0 (COLWELL etal., 2004).
For estimating the number of video frames that fit into each belt-transect, it was created a mosaic of non-overlapping images, which averaged 100 images (frames) per transect.
Evaluation of Coral Parameters
Table 1. Percent cover of each component of the benthic community identified in the ten belt-transects performed in the Pedra do Silva Reef. Other organisms = polichaete, anemone, sea urchin. AVE = average.
R
ESULTSSelecting the Number of Points per Frame
Three parameters were used for defining the number of points to be analyzed in each frame (image).
The Coral and Hydrocoral Coverage - the coral coverage, i.e. the percent cover of all present
coral and hydrocoral species, was a good parameter for evaluating the number of points per frame to be selected. It showed little variation from a minimum of 23.5% to a maximum of 24.9% among the samples corresponding to 10 and 50 points per frame (Table 2). Due to such slight variation (1.44%), one shall propose 10 points per frame as an effective number to assess the coral coverage at that reef.
Transects 1 2 3 4 5 6 7 8 9 10 AVE
Scleractinia
Agaricia agaricites 0.00 0.05 0.22 0.00 0.00 0.00 0.52 0.45 0.09 1.00 0.31
Siderastrea spp 0.00 0.40 0.84 0.14 0.15 1.11 0.81 0.40 0.19 4.47 0.85
Porites astreoides 0.00 0.00 0.34 0.00 0.00 0.00 0.24 0.15 0.28 2.05 0.21
Porites branneri 0.06 0.00 0.28 0.10 0.00 0.25 0.43 0.00 0.00 0.37 0.15
Favia gravida 0.00 0.00 0.00 0.00 0.00 0.05 0.05 0.15 0.00 0.11 0.04
Montastraea cavernosa 0.00 0.00 0.06 0.00 0.00 0.00 0.14 0.00 0.00 0.95 0.12
Mussismilia braziliensis 0.00 0.00 0.17 0.91 0.46 0.00 0.10 0.10 0.00 2.63 0.44
Mussismilia hispida 0.00 3.27 0.67 0.14 1.12 2.93 0.62 0.00 0.00 1.00 0.98
Mussismilia harttii 0.00 0.05 1.57 0.00 1.17 0.76 2.43 3.76 0.28 1.68 1.17
Scolymia welsii 0.00 0.00 0.00 0.00 0.00 0.00 0.00 0.00 0.00 0.05 0.00 Milleporina
Millepora alcicornis 34.70 4.60 15.39 28.13 25.46 8.94 12.43 18.22 0.09 11.79 15.97
Algae
Macro algae 18.07 5.20 2.36 9.47 4.13 4.90 10.43 0.45 51.54 6.47 11.30 Turf algae 27.23 29.16 48.93 32.40 23.37 32.78 23.86 38.22 37.80 48.32 34.20 Crustose coralline 1.51 0.25 1.12 1.59 0.82 1.97 4.10 5.15 0.65 7.74 2.50
Halimeda 8.13 33.75 5.22 16.15 13.72 17.73 4.48 6.88 0.33 1.68 10.80 Other invertebrates
Carijoa riisei 0.24 1.88 5.17 0.00 2.55 0.00 0.00 0.00 0.00 0.00 1.00
Neospongodes atlantica 5.48 18.42 5.34 7.12 23.62 19.55 0.29 0.00 0.00 0.00 7.98 Other octocorals 0.24 0.15 1.12 1.15 0.15 8.13 3.33 0.05 0.23 0.00 1.45
Palythoa caribeorum 0.00 0.00 3.43 0.00 0.00 0.30 32.24 20.45 0.00 4.21 6.06
Zoanthus sociatus 0.00 0.00 0.00 0.00 0.00 0.00 0.00 0.00 0.00 0.26 0.03
Sponges 0.24 0.69 0.45 0.38 0.56 0.15 0.05 0.35 0.05 0.47 0.34
Crinoides 2.29 0.64 4.16 0.29 2.35 0.30 0.00 0.10 0.00 0.00 1.01 Other organisms 0.06 0.00 0.06 0.19 0.00 0.00 0.10 0.15 0.05 0.63 0.12 Reef substrate
Sediment 1.02 0.10 0.00 1.06 0.10 0.05 0.86 3.66 6.92 2.42 1.61
Cavity 0.42 0.05 0.73 0.38 0.000 0.05 1.62 0.99 1.50 1.21 0.70
Table 2. Average percentage (± sd) of living coral cover, average (± sd) number of identified species and time spent in the analysis of 10, 20, 30, 40 and 50 points in each video frame (image).
The Coral and Hydrocoral Richness - the average number of coral and hydrocoral species (coral richness) found in the three belt-transects was calculated for every quantity of points drawn by frame. The lowest average, i.e. 7.3 species, was found when 10 points were analyzed per frame. The highest average was 9.3, corresponding to an effort of 40 points per frame. Analysis of 50 points per frame presented the same average effort for 20 points per frame (8.7). Averages of 8.3 for 30 points per frame and 9.3 for 40 points per frame may be considered as randomized variations (Table 2). In such case we considered that stabilization of averages occurred just from 20 points per frame on. That result is slightly different from those related for coral coverage, which indicate 10 points per frame as a sufficient sampling effort.
Time spent - The analysis of the cost/benefit, based on the time spent for identification of organisms at the points drawn on every video frame, showed a progressive increase from 70.6 min, corresponding to 10 points per frame, to 177.5 min for 50 points per frame. The major increase was found between 10 (70.6 min) and 20 points (121.5 min) (Table 2), which was expected, since the number of analyzed points grows twofold. From that point on, the time spent increased at approximately 50%, 33% and 25%, respectively from 20 to 30, from 30 to 40 and from 40 to 50 points per frame.
Selecting the Number of Belt-transect
Two parameters were used in order to select the number of belt-transects that best represented the coral community of the studied reef.
The Coral and Hydrocoral Coverage - In Pedra do Silva Reef, the living coverage of hard corals and hydrocorals (Scleractinia and Milleporina), varied from a minimum of 1% to a maximum of 35%, among the ten transects, with an average (± sd) of
20.2±10.34% (Table 3). Millepora alcicornis Linné 1758 dominates in almost all transects, and is almost the only species found in transect one. The percent cover of this cosmopolitan milleporid is followed by the ones of the endemic species Mussismilia harttii
Verrill 1868, Mussismilia hispida Verrill 1868,
Siderastrea stellata Verrill 1868 and Mussismilia braziliensis Verrill 1868 (see Table 1).
Table 3. Percent living coral cover and number of identified coral species (scleractinians and milleporids) in the ten belt-transects performed in Pedra do Silva Reef.
The Coral Species Richness - The number of coral species found in the ten belt-transects varied from two species, in transect # 1, to 11 species in transect # 10, with an average (± sd) of 6.5±2.7 species (Table 3).
The following ten coral species were observed in Pedra do Silva Reef, listed accordingly to their average (± sd) percentage cover: Mussismilia harttii Verrill 1868 (1.17%), Mussismilia hispida
Verrill 1868 (0.98%), Siderastrea stellata Verrill 1868 (0.85%), Mussismilia braziliensis Verrill 1868 (0.44%), Agaricia agaricites Linne 1758 (0.31%),
Porites astreoides Lamarck (0.21%), Porites branneri
Rathbun (0.15%), Montastraea cavernosa Linne 1758 (0.12%), Favia gravida Verrill 1868 (0.04) and
Scolymia welsii Laborel 1967 (<0.01%), and the calcareous hydroid Millepora alcicornis Linne 1758 (15.97%) (see Table 1).
For both quantitative and qualitative data sets, the coral species richness estimators (ICE, ACE, Chao 1, Chao 2 and Cole), and the unique and duplicate occurrences of species, plotted against the cumulative transect data, indicate that almost all curves stabilized with six to seven transects and with up to 10 species. The number of unique and of duplicate species tends towards zero in both data types (Figs 2, 3). Observing the Sobs lower bound 95%
confidence interval, one verifies that 10 coral species were reached with six to seven transects (Table 4).
Number of points/frame
Living coral cover
%
Identified species
#
Time spent (min)
10 24.9±0.08 7.33±3.79 70.60
20 24.4±0.06 8.67±3.22 121.5
30 24.1±0.06 8.33±2.89 134.3
40 24.4±0.05 9.33±1.16 166.0
50 23.5±0.05 8.67±2.30 177.5 Transects Coral % cover species Coral #
1 34.76 2 2 8.37 5 3 19.55 9 4 29.42 5 5 28.37 5 6 14.04 6
7 17.76 10
Quantitative Data
0 2 4 6 8 10 12 14
1 2 3 4 5 6 7 8 9 10
Number of Transects
N
u
m
b
er
o
f cor
al
speci
es
Sobs (Mao Tau)
Uniques Mean
Duplicates Mean
ACE Mean
Chao 1 Mean
Cole Rarefaction
Fig. 2. Species richness estimators of quantitative data from the Pedra do Silva Reef, considering 11 coral species. Sobs = number of coral species in the belt-transects; Uniques = number of species occurring in
only one transect; Duplicates = number of species occurring in two transects; ACE = abundance-based coverage; Chao 1 = incidence-based coverage; Cole = Coleman curve, or the number of species expected in the analyzed transects.
Qualitative Data
0 5 10 15 20 25
1 2 3 4 5 6 7 8 9 10
Number of Transects
N
u
m
b
er
of
co
ra
l speci
es
Sobs (Mao Tau) Uniques Mean Duplicates Mean ICE Mean Chao 2 Mean Cole Rarefaction
Fig. 3. Species richness estimators of qualitative data from the Pedra do Silva Reef, considering 11 coral species. Sobs = number of coral species in the belt-transects; Uniques = number of species occurring in
Among the 11 species identified (10 scleractinians and one milleporid), Scolymia wellsi
was seen only in one transect (number 10; see table 1). This coral is not colonial and bears no important role as a reef builder (LEÃO; KIKUCHI, 2001; LEÃO et al., 2003). Its diameter reaches a maximum of 6 cm (LABOREL, 1970), and it has a low sampling probability since it most commonly occurs on
shadowed vertical walls of coral reefs, which are rare in shallow water (LABOREL, 1970). If the case of
Scolymia wellsi was discarded and ten species were considered, then all curves would stabilize with five transects with up to 10 species, and the number of unique and duplicate species would reach zero with 10 transects (Figs 4, 5).
Quantitative Data
0 2 4 6 8 10 12
1 2 3 4 5 6 7 8 9 10
Number of Transects
N
u
m
b
er
o
f co
ra
l s
p
ec
ie
s
So bs (M ao Tau)
Uniques M ean Duplicates M ean A CE M ean Chao 1 M ean
Co le Rarefactio n
Fig. 4. Species richness estimators of quantitative data from the Pedra do Silva Reef, eliminating the species Scolymia wellsi. Sobs = number of coral species in the belt-transects;
Uniques = number of species occurring in only one transect; Duplicates = number of species occurring in two transects; ACE = abundance-based coverage; Chao 1 = incidence-based coverage; Cole = Coleman curve, or the number of species expected in the analyzed transects.
Qualitative Data
0 5 10 15 20 25 30
1 2 3 4 5 6 7 8 9 10
Number of Transects
Nu
m
b
e
r
o
f co
ra
l s
p
ec
ie
s
So bs (M ao Tau)
Uniques M ean Duplicates M ean
ICE M ean
Chao 2 M ean
Co le Rarefactio n
Fig. 5. Species richness estimators of qualitative data from the Pedra do Silva Reef, eliminating the species Scolymia wellsi. Sobs = number of coral species in the belt-transects; Uniques =
D
ISCUSSIONThe results of this study indicated that the video-transect method with a sample size of six transects analyzed through 20 points per frame, was a fast, achievable, and relatively accurate approach, in order to characterize the coral reef community of the Itacolomis reefs.
Aronson et al. (1994) and Aronson and Swanson (1997) suggested 10 transects per station, and argued that from that point on, the only parameter subject to variation was the number of species. The difference between the number of transects proposed by these authors (10), and the number proposed in this work (6), may be justified by the following two facts: a) in Pedra do Silva Reef the number of species stabilized with six to seven belt transects (see Figures 2 – 4), i.e., with six belt transects it was reached 9.8 species, while with seven transects the number of species was of 10.1, which corresponded to a difference of only 0.3 species, and b) the number of points analyzed in the 10 transects from the reefs investigated by the cited authors (5,000) are less than half of those analyzed in the six transects performed in Pedra do Silva Reef (12,000). Aronson et al. (1994) recommended 10 points per frame for the analysis of 50 frames, which totaled 500 points per transect (i.e., 5,000 points in 10 transects). In Pedra do Silva Reef, 20 points in 100 frames per transect achieved a total of 2,000 points per transect, which summed up 12,000 points in the six belt-transects. If we use a lower number of points per frame it will generate a slower accumulation of the number of species, thus requiring an increase in the number of transects necessary to stabilize the species accumulation curve. The addition of one more transect would require more dive time, because six transects could be performed during one dive, and an extra dive would mean an increase in the cost of the field operation. The difference in the number of species found in Pedra do Silva Reef between six and seven belt-transects is too small for the extra effort.
Different reef systems may require different sample designs, transect lengths, number of frames, number of points, in order to detect changes of different reef organisms (HOUK; VAN WOESIK, 2006). In the Caribbean Sea, Aronson et al. (1994) using 10x25 m long x 0.4 m wide transects, covered an area of 100 m2, and Rogers and Miller (2001) used
5x20 m long x 0.2 m wide transects and completed an area of 20 m2. In the Philippines, Alcala and Vogt (1997) evaluated the reefs applying 3x50 m long x 0.12 m wide transects, which covered an area of 18 m2, and in Todos os Santos Bay, Dutra et al. (2006) used 6x20 m long x 0.2 m wide transects and covered 24 m2. In our work, an area of 40 m2 (10 transects x 20 m long x 0.2 m wide) was analyzed, but we found that
six transects 20 m long and 0.2 wide, were adequate to characterize the Itacolomis coral reefs.
The number of coral species (10) and millepore species (1) identified at the top of Pedra do Silva Reef (one sole reef), was not excessively low when compared with 14 species of corals and three of millepores reported by Segal and Castro (2001), which evaluated the coral fauna from eight reefs of the Itacolomis complex. The difference between the numbers found in those two works could be explained by the fact that the cited authors evaluated a much greater number of reefs than that evaluated during this study. Also, comparing the number of species found in the Pedra do Silva Reef with the fauna of 16 species of corals and three of millepores identified in the Abrolhos Reefs, the largest and richest coral reef area of the Western South Atlantic, it seems even more reasonable. One should bear in mind that the Brazilian reefs hold a low coral species richness when compared with those of the North Atlantic, Indian and Pacific Oceans, and have a high number of endemic forms (LABOREL, 1969, 1970; BELÉM et al., 1986; CASTRO, 1994; LEÃO; KIKUCHI, 2001; KIKUCHI et al., 2003a; LEÃOet al., 2003).
The goal of this work was to define the fastest way the video-transect sampling program was capable of giving information regarding species composition of important taxa from the Pedra do Silva coral reef, in the Itacolomis reef complex. With six belt-transects, the application of the video-transect would allow the execution of one sampling station, up to 10 m deep, during a single dive, saving considerable time and compressed air consumption. According to Brown et al. (2004), in remote coral reefs from Hawaii, the video-transect method become a more cost-effective in comparison with all other survey methods.
The recent development of video-cameras provides data collection in the field with reasonable resolution and the images can be achieved for future re-evaluation. The use of the video-transect method has already passed the experimental stage and has been employed for reef surveys in several areas around the world. It shows great potential for fast quantitative estimates, particularly in the context of global reef monitoring and for documenting visible changes, such as portions of corals that are bleached and/or diseased (PORTER; MAYER, 1994; ARONSON et al., 1994; CARLETON; DONE, 1995; ALCALA; VOGT, 1997; GREEN; SMITH, 1997, ROGERS; MILLER, 2001).
A
CKOWLEDGEMENTSthe invitation and for field support during this work. Special thanks to Dr. Rodrigo L. de Moura and Dr. Francisco C. Barros Jr. for their advices, and to two anonymous reviewers for suggestions that greatly improved the final version of the manuscript. Eric Joelico is acknowledged for his help during field work. CNPq (Brasil) granted scholarship and financial support to the authors.
R
EFERENCESALCALA, M. L. R.; VOGT, H. Approximation of coral reef surface using standardized growth and video counts. In: INTERNATIONAL CORAL REEF SYMPOSIUM, 8, 1996, Panama. Proceedings … Balboa, Panama: Smithsonian Tropical Research Institute, 1997. v. 2, p. 1453-1458.
ARONSON, R. B.; EDMUNDS, P. J.; PRECHT, W. F.; SWANSON, D. W.; LEVITAN, D. R. Large-scale, long-term monitoring of Caribbean coral reefs: simple, quick, inexpensive techniques. Atoll Res. Bull., v. 421, p. 1-19, 1994.
ARONSON, R. B. E.; SWANSON, D. W. Video surveys of coral reefs: uni- and multivariate applications. In: INTERNATIONAL CORAL REEF SYMPOSIUM, 8, 1996, Panama. Proceedings … Balboa, Panama: Smithsonian Tropical Research Institute, 1997, v. 2, p. 1441-1448.
BELEM, M. J. C.; ROHLFS, C.; PIRES, D. O.; CASTRO, C. B. S. O. S. Corais. Rev. Ciência Hoje, v.5, p. 34-42, 1986.
BROWN, E.; COX, E.; JOKIEL, P.; RODGERS, K; SMITH, W.; TISSOT, B.; COLES, S. L.; HULTQUIST, J. Development of benthic sampling method for the coral reef assessment and monitoring program (CRAMP) in Hawaii. Pac Sci, v. 58, p. 145-158, 2004.
CARLETON, J. H.; DONE, T. J. Quantitative video sampling of coral reef benthos: large-scale application.
Coral Reefs, v. 14, p. 35-46, 1995.
CASTRO, C. B. Corais do Sul da Bahia. In: HETZEL, B.; CASTRO, C. B. (Ed.). Corais do Sul da Bahia. Rio de Janeiro: Nova Fronteira, 1994. p. 26-149.
CHAVES, E. A. Sampling design for the study of Yucatan Reefs, Northwestern Caribbean. In: INTERNATIONAL CORAL REEF SYMPOSIUM, 8, 1996, Panama.
Proceedings … Balboa, Panama: Smithsonian Tropical
Research Institute, 1997. v. 2, p. 1465-1470.
COLEMAN, B. D.; MARES, M. A.; WILLIG, M. R.; KUO, C. Y. On randon placement and species-area relation.
Mathl Biosci., v. 54, p. 191-215, 1982.
COLWELL, R.K.; MAO, C.X. E.; CHANG, J. Interpolating, extrapolating, and comparing incidence-based species accumulation curves. Ecology, v. 85, n. 10, p. 2717-2727, 2004.
DUTRA, L.X.C.; KIKUCHI, R.K.P.; LEÃO, Z.M.A.N. Todos os Santos Bay coral reefs, Eastern Brazil, revisited after 40 years. In: INTERNATIONAL CORAL REEF SYMPOSIUM, 10, 2004, Japan. Proceedings … Okinawa, Japan, 2006. v. 2, p. 1090-1095.
FERREIRA, B. P.; MAIDA, M. Monitoramento dos recifes de coral do Brasil: situação atual e perspectivas.
Brasília, D.F., Ministério do Meio Ambiente, Centro de
Informação e Documentação Ambiental, 2006. 120 p. GINSBURG, R. N.; KRAMER, P. R.; LANG, J. C.; SALE,
P. The Atlantic and Gulf Rapid Reef Assessment
(AGRRA) PDF. 1998. <http://www.agrra.org> – Last update November 7th 2003.
GREEN, R. H.; SMITH, S. R. Sample program design and environmental impact assessment on coral reefs. In: INTERNATIONAL CORAL REEF SYMPOSIUM, 8, 1996, Panama. Proceedings … Balboa, Panama: Smithsonian Tropical Research Institute, 1997. v. 2, p. 1459-1464.
HOUK, P.; VAN WOESIK, R. Coral reef benthic video surveys facilitate long-monitoring in the Commonwealth of the Northern Mariana Islands: toward an optimal sampling strategy. Pac Sci, v. 60, p. 177-189, 2006. KIKUCHI, R. K. P.; LEÃO, Z. M. A. N.; TESTA, V.;
DUTRA, L. X. C.; SPANÓ, S. Rapid Assessment of the Abrolhos Reefs, Eastern Brazil (Part 1: Stony Corals and Algae). Atoll Res. Bull., v. 496, p. 172-187, 2003a. KIKUCHI, R. K. P.; LEÃO, Z. M. A. N.; SAMPAIO, C. L.
S.; TELLES, M. D. Rapid Assessment of the Abrolhos Reefs, Eastern Brazil (Part 2: fish communities). Atoll
Res. Bull., , v. 496, p. 189-204, 2003b.
KREBS, C. J. Estimating Abundance: Quadrat Counts. In: C.J. KREBS (Ed.).Ecological Methodology, 2nd edition.
Ed. Bejamin Cummings, 1998a. Cap. 4, p. 16-69. KREBS, C. J. Species diversity Measures. In: C.J. KREBS
(Ed.). Ecological Methodology, 2nd edition. Ed. Bejamin
Cummings, 1998b, Cap. 12, p. 410-454
LABOREL, J. L. Les peuplements des madreporaires des cotes tropicales du Brésil. Annls Univ. d’Abidjan, Serie E, II, Fasc. 3, 1969. 260 p.
LABOREL, J. L. Madreporaires et hydrocoralliaires recifaux des cotes brésiliennes, Systematique, ecologie, repartition verticale et geographie . Annls. Inst.
océanogr., Paris. v. 47, p. 171-229, 1970.
LEÃO, Z.M.A.N; KIKUCHI, R.K.P. The Abrolhos Reefs of Brazil. Ecol. Stud., v. 144, p. 83-96, 2001.
LEÃO, Z. M. A. N; KIKUCHI, R. K. P.; TESTA, V. Corals and Coral Reefs of Brazil. In: CORTÉS, J. (Ed.). Latin
American Coral Reefs, Amsterdam: Elsevier, 2003. p.
9-52.
LEUJAK, W.; ORMOND, R. F. G. Comparative accuracy and efficiency of six coral community survey methods.
J. exp. mar. Biol. Ecol., v.351, p. 168-187, 2007.
LOYA, Y. Community structure and species diversity of hermatypic corals at Eilat, Red Sea. Mar. Biol., v. 13, p. 100-123, 1972.
LOYA, Y. Plotless and transect method. In: STODDART D.R.; JOHANNES R.E. (Eds.). In: Coral reefs: researches methods. Paris: UNESCO, 1978. p. 197-217. PAGE, C.; COLEMAN, G.; NINIO, R.; OSBORNE, K.
Surveys of benthic reef communities using underwater video. Long-term Monitoring of the
Great Barrier Reef - Standard Operational Procedure
Number 7. Townsvile: Autralian Institute of Marine Sciences, 2001. 49 p.
ROGERS, C. S.; MILLER, J. Coral bleaching, hurricane damage and benthic cover on coral reefs in St. John, U. S. Virgin Islands: a comparison of surveys with the chain transect method and videography. Bull. mar. Sci. v. 69, n. 2, p. 459-470, 2001.
SEGAL, B.; CASTRO, C. B. A proposed method for coral cover assessment: a case study in Abrolhos, Brazil. Bull.
mar. Sci., v. 69, n. 2, p. 487-496, 2001.
VOGT, H.; MONTEBON, A. R. F.; ALCALA, M. L. R. Underwater video sampling: an effective method for coral reef surveys? In: INTERNATIONAL CORAL REEF SYMPOSIUM, 8, 1996, Panama. Proceedings … Balboa, Panama: Smithsonian Tropical Research Institute, 1997, v. 2, p. 1447-1452.