Major Article
Corresponding author: Dr.Douglas Eulálio Antunes.
e-mail: [email protected]
Received 23 December 2015
Accepted 23 November 2016
Number of leprosy reactions during treatment:
clinical correlations and laboratory diagnosis
Douglas Eulálio Antunes
[1],[2],
Gabriela Porto Ferreira
[1],
Mariana Vitorino Candeiro Nicchio
[1],[2],
Sergio Araujo
[1],[2],
Ana Carolina Rodrigues da Cunha
[1],[2],
Rafaela Resende Gomes
[1],
Adeilson Viera da Costa
[1]and
Isabela Maria Bernardes Goulart
[1],[2][1]. Centro de Referência Nacional em Dermatologia Sanitária e Hanseníase, Hospital de Clínicas, Universidade Federal de Uberlândia, Uberlândia, Minas Gerais, Brasil. [2]. Programa de Pós-Graduação em Ciências da Saúde, Faculdade de Medicina,
Universidade Federal de Uberlândia, Uberlândia, Minas Gerais, Brasil.
Abstract
Introduction: The occurrence of leprosy reactions, a common event during treatment, may be mostly related to the action of
multidrug therapy on Mycobacterium leprae. The clinical and laboratory monitoring of patients with reactions is important, since collecting data that assists in predicting the risk of reactions may help to prevent disability. Methods: This was a sectional study, in order to correlate clinical and laboratory diagnosis with the number of reactions during treatment. Spearman’s correlation was used to verify the degree of association between the assessed variables. Results: This study was conducted with 211 patients with leprosy reactions during treatment of M. leprae. The borderline tuberculoid group was the most prevalent clinical form (74/211; 35.1%) and the type one reaction showed the highest frequency (136/211; 64.5%). It was observed that 73.5% (155/211) of reactions occurred within 3 months of the initiation of multidrug therapy. The diagnostic values, including the bacterial indices (BIs) of dermal smears (r = 0.21,p < 0.05) and skin biopsies (r = 0.20;p < 0.05), showed a positive correlation with the number of reactions during treatment. Conclusions: This research showed a positive correlation between bacillary load markers and
the number of leprosy reactions. This study provided scientifi c support to future research aiming to elucidate the infl uence of
antigenic load on the number of leprosy reactions during treatment.
Keywords: Leprosy. Leprosy reactions. Clinical correlation. Laboratory diagnosis.
INTRODUCTION
Leprosy, an infectious disease caused by Mycobacterium leprae (ML), causes immunological phenomena termed leprosy reactions that tend to increase following the initiation of multidrug therapy (MDT) and result primarily in neural damage(1).
Leprosy reactions are divided into type one and type two reactions. Type one reactions are mediated by cellular immunity and involve the production of T-helper (Th) 1 response cytokines, including interferon-gamma, interleukin (IL)-2, and IL-12(2). Conversely, the type two reactions are characterized as systemic; they are related to the deposition of immune complexes and predominant Th2 responses, involving tumor
necrosis factor-alpha (TNF-α), IL-6, IL-8, and IL-10(3). The mixed reaction, which has a lower occurrence and has been rarely described in the literature, occurs mainly in the
borderline lepromatous (BL) clinical form and is characterized by concurrent symptoms common to type one and two reactions(4).
Since 1981, the World Health Organization (WHO) has recommended MDT for the treatment of leprosy, in order to fi ght
bacterial infection(5). However, the risk of developing reactions increases with the use of MDT due to the antimicrobial action of MDT, which causes the release of antigens that stimulate the occurrence of leprosy reactions by disrupting the mycobacterial cell wall(6).
Assessing correlations between the number of reactions and
variables that refl ect the bacterial load, including the number of
that there is an absence of criteria to quantify the leprosy reactions and a lack of technology to support that procedure or to serve as a database for future research.
We aim to show the relationship between the number of
leprosy reactions and the bacterial load represented mainly by bacterial indices of skin biopsies and dermal smear detected during the diagnosis.
METHODS
Study and sample type
This is an observational cross-sectional study, consisting of 211 patients who presented with leprosy reactions during
treatment and who were clinically classifi ed according to the
criteria of Ridley and Jopling(7).
Data collection
Data, collected through secondary sources (medical records) were predominantly epidemiological, clinical, and laboratory variables obtained for correlation analysis purposes. Extracted
data included clinical and operational classifi cation, the type of reaction, the number of leprosy reactions, time to the fi rst
reaction episode during treatment, the number of inspected skin lesions at diagnosis, and the BIs of dermal smears and skin biopsies.
Inclusion and exclusion criteria
This study included only patients with leprosy reactions during treatment with MDT at the National Reference Center for Sanitary Dermatology and Leprosy from January 2002 to
December 2009. We excluded all patients with incomplete data,
those who were transferred to other locations during treatment, and those with leprosy reactions at the time of diagnosis.
Criteria for clinical and operational classifi cation The clinical forms of patients included in the study were based on the classification suggested by Ridley and Jopling(7), and included 7 groups, according to immunological, histological, and clinical characteristics, as follows: tuberculoid (TT), borderline tuberculoid (BT), borderline borderline (BB), borderline lepromatous (BL), subpolar lepromatous leprosy (LLs), and lepromatous lepromatous (LL). The operational
classifi cation was based on the criteria of the WHO together
with other auxiliary methods, including laboratory tests used in the diagnosis, such as anti-PGL-1 ELISA serology, polymerase chain reaction analysis of dermal skin smears, peripheral blood analysis, skin biopsies, and the Mitsuda test.
Criteria for defi nition of leprosy reactions
Leprosy reactions (type one, type two, and mixed) were categorized based on clinical and immunological criteria described in the literature(8).
Method of quantifi cation of leprosy reactions For the purpose of counting the number of reactions (type one, type two, and mixed), the following criteria were established: a new leprosy reaction was considered if symptoms
were exacerbated at 7 or more days following completion of the reaction treatment, while a reaction was considered to be a continuation of the previous reaction (the same leprosy reaction) if symptoms were exacerbated in less than 7 days after
completion of treatment. We propose this new methodology
for counting the number of leprosy reactions, based on the time of the mean half-life of thalidomide (5.5 hours) for type 2 leprosy reaction (or mixed), the mean half-life of prednisone (3 hours) for type 1 leprosy reaction (or mixed), the reappearance of classical clinical signs related to leprosy reactions, and the absence of a consensus in the literature regarding calculating the number of leprosy reactions(9) (10).
S tatistical analysis
We used the non-parametric Spearman’s rank correlation coeffi cient test to assess the degree of association between the
number of reactions during treatment and other clinical and laboratory variables. The statistical analysis was performed using GraphPad Prism, version 6 (GraphPad Software, Inc.,
La Jolla, CA, USA), and a signifi cance level of p < 0.05 was
assumed. Data were submitted to the D'Agostino-Pearson test to assess normality.
Ethical considerations
This study was approved by the Ethics Committee on Human Research of the Federal University of Uberlandia under the registration number 449/10 and protocol number 193/10. The ethical principles of this study support its methodology with the resolution of the National Health Council, number 466/2012.
RESULTS
This study involved 211 patients who developed leprosy reactions during treatment. As shown in Table 1, the BT (74/211; 35.1%) and LL (55/211; 26.1%) groups showed the highest frequencies among the clinical forms. The leprosy type 1 was seen in 64.5% (136/211) of patients, followed by the type two
reaction, with 30.8% (65/211) of patients developing this type
of immune response.
Table 2 shows the time to the fi rst leprosy reaction following
treatment initiation. Notably, the majority of reactions occurred
within the fi rst 3 months of treatment and the BT (68/211;
32.2%), BB (29/211; 13.7%), and LL (29/211; 13.7%) group patients presented with the earliest reactions during treatment.
It is also noteworthy that 83.6% (46/55) of patients of the LL form showed reaction within the fi rst year of treatment.
Table 3 shows the number of leprosy reactions per clinical
form. The mean number of reactions during treatment was 1.6 per patient. However, the means of the LLs (2.6) and LL (2.1) groups were above 1.6.
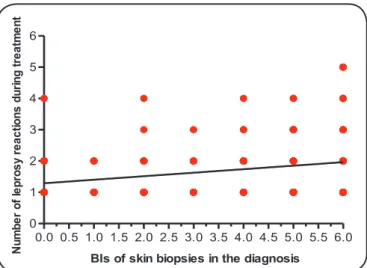
There was a positive correlation between the number of leprosy reactions during treatment and the number of skin lesions inspected during the clinical diagnosis of the patients;
however, the correlation was not signifi cant (r = 0.24,p > 0.05).
Figure 1 shows a positive correlation between the number
Clinical form
Type of reaction during treatment
Type 1 Type 2 mixed total
n % n % n % n %
Tuberculoid 9 4.3 - - - - 9 4.3
Borderline tuberculoid 74 35.1 - - - - 74 35.1
Borderline borderline 38 18.0 - - - - 38 18.0
Borderline lepromatous 15 7.1 10 4.7 5 2.4 30 14.1
Subpolar lepromatous leprosy - - - - 5 2.4 5 2.4
Lepromatous lepromatous - - 55 26.1 - - 55 26.1
Total 136 64.5 65 30.8 10 4.8 211 100.0
TABLE 1
Frequency distribution of patients during treatment according to clinical form and type of leprosy reaction.
Time to the fi rst reaction
Clinical form
TT BT BB BL LLs LL Total
(months) n % n % n % n % n % n % n %
>0 – 3 7 3.3 68 32.2 29 13.7 19 9.0 3 1.4 29 13.7 155 73.5
>3 – 6 2 0.9 4 1.9 7 3.3 4 1.9 1 0.5 11 5.2 29 13.7
>6 – 9 - - 2 0.9 1 0.5 3 1.4 1 0.5 5 2.4 12 5.7
>9 – 12 - - - - 1 0.5 4 1.9 - - 1 0.5 6 2.8
>12 – 15 - - - 3 1.4 3 1.4
>15 – 18 - - - 2 0.9 2 0.9
>18 – 21 - - - 2 0.9 2 0.9
>21 – 24 - - - 2 0.9 2 0.9
Total 9 4.3 74 35.1 38 18.0 30 14.2 5 2.4 55 26.1 211 100.0
TABLE 2
Frequency distribution of the time to the fi rst reaction episode during treatment according to clinical form.
TT: tuberculoid; BT: borderline tuberculoid; BB: borderline borderline; BL: borderline lepromatous; LLs: subpolar-lepromatous leprosy; LL: lepromatous lepromatous.
Clinical form
Number of leprosy reactions during treatment
1 2 3 4 ≥5 Total
n % n % n % n % n % n % mean
Tuberculoid 7 3.3 2 0.9 - - - 9 4.3 1.2
Borderline tuberculoid 53 25.1 16 7.6 3 1.4 2 0.9 - - 74 35.1 1.3
Borderline borderline 21 10 11 5.2 6 2.8 - - - - 38 18.0 1.6
Borderline lepromatous 17 8.1 11 5.2 1 0.5 1 0.5 - - 30 14.2 1.5
Subpolar lepromatous leprosy 1 0.5 1 0.5 2 0.9 1 0.5 - - 5 2.4 2.6
Lepromatous lepromatous 25 11.8 14 6.6 7 3.3 4 1.9 5 2.4 55 26.1 2.1
Total 124 58.8 55 26.1 19 9.0 8 3.8 5 2.4 211 100.0
TABLE 3
0.0 0.5 1.0 1.5 2.0 2.5 3.0 3.5 4.0 4.5 5.0 5.5 6.0 0
1 2 3 4 5 6
BIs of skin biopsies in the diagnosis
Nu
mb
er
of
le
pr
os
yr
eact
io
ns
du
ri
ng
tr
ea
tm
en
t
FIGURE 1. Association between the number of leprosy reactions during treatment and the bacterial indices (BIs) of skin biopsies taken at diagnosis (r = 0.20, p < 0.05).
0.0 0.5 1.0 1.5 2.0 2.5 3.0 3.5 4.0 4.5 5.0 5.5 6.0 0
1 2 3 4 5 6 7 8 9 10
BIs of dermal smear in the diagnosis
Nu
mb
er
of
le
pr
os
yr
eact
ions
du
ri
ng
tr
ea
tm
en
t
FIGURE 2. Association between the number of leprosy reactions during treatment and the bacterial indices (BIs) of dermal smears obtained at diagnosis (r = 0.21, p < 0.05).
the correlation was considered weak, this association exists and did not occur at random.
Regarding the association between the number of leprosy reactions during treatment and the BI of dermal smears
(Figure 2) in the same period, despite the correlation coeffi cient
being weak (r = 0.21, p < 0.05), there was a positive correlation between these two variables, suggesting that an increase in the BIs of dermal smears may increase the number of leprosy reactions during treatment.
DISCUSSION
The high number of leprosy reactions seen in the fi rst
3 months of treatment (155/211, 73.5%) was related to the effectiveness of MDT in the destruction of ML, mainly in
multibacillary (MB), with a massive release of antigens
following the initiation of therapy, remembering that >80% of
leprosy patients were MB in a recent study(11). The BT (74/211, 35.1%) and LL (55/211, 26.1%) clinical forms showed the highest frequencies among the clinical forms in this study.
The borderline group, consisting of BT, BB, and BL patients, represented the majority of patients in this study. These patients developed type one reactions only, with the exception of BL patients who developed type one, mixed, and type two reactions. This explains why the type one reaction had the highest incidence in this study, remembering also that this group, BT, BB, and BL, has a high immune instability and
that, when bacteriological levels rise, bacterial load infl uences
leprosy reactions, stimulating cell-mediated hypersensitivity phenomenon(12). Patients with a high BI, such as those with the LL clinical form, have a greater risk of experiencing a reaction when the BI is >4, explaining the high number of type two reactions in the present study(13).
As for the occurrence period of the fi rst leprosy reaction during treatment, more than half of the patients had the fi rst reaction within the fi rst 3 months of treatment. This is consistent
with studies reporting the occurrence of the type one reaction
in the fi rst 6 months, as observed in the borderline groups
(BT and BB) as shown in our present study(14). The borderline groups showed early reactions because of the large population of these individuals in the study. The LL clinical form, in our research, had a high number of subjects affected by leprosy
reactions during the fi rst year of MDT, triggered by the intense release of antigens in the blood fl ow leading to the formation
of immune complexes within tissues(15).
Few studies have quantifi ed the number of leprosy reactions per patient. This is because of the diffi culty in monitoring these
individuals and the lack of criteria for determining the beginning and end of a reaction. In the present study, we calculated the mean number of reactions during treatment in more detail, similar to recent studies(16) (17). In this study, the LLs and LL forms were more likely to develop reactions; both had a mean number of >2 leprosy reactions per patient during treatment(3).
the non-parametric Spearman’s rank correlation coeffi cient
detected a positive relationship between the number of leprosy reactions during treatment and the number of skin lesions inspected in the clinical diagnosis of patients. Few studies have evaluated this relationship directly, although another study did detect a relationship between the occurrence of leprosy type one reactions and the size of the lesion, in which lesions of >5cm were a risk factor(18). This study showed that 59.4% (44/74) of borderline tuberculoid patients were multibacillary, which explains how an increased BIs and skin lesions can be risk factors for type one reactions(19).
A positive correlation between the number of leprosy reactions during treatment and the BIs of skin biopsies collected at diagnosis was demonstrated by the Spearman’s correlation analysis, which indicated a weak, but statistically
signifi cant correlation. The BIs of biopsies reliably indicates the
of the correlation between anti-PGL-1 ELISA serology diagnosis and the number of reactions during treatment, since this also refers to the amount of antigen present in individuals(16) (17) (20).
Similar to the BIs of skin biopsies, the BIs of dermal smears was associated with the number of leprosy reactions
during treatment, indicating a strong infl uence again of the
bacterial load on the outcome of leprosy reactions. This fact was quoted in a study about the association of leprosy reactions and the bacterial load, which calculated odds ratios to measure the chance of patients with a positive initial dermal smear developing a leprosy reaction during and/or following treatment. The study found a result of 2.94, although it was not statistically
signifi cant(21).
The relationship between bacterial load and the number of leprosy reactions during treatment, represented in the present study by the BIs of dermal smears and skin biopsies, showed
a weak correlation in this sample; however, the scientifi c
community recognizes these associations through other studies(16).
In conclusion, this study about leprosy reactions during treatment showed that clinical and laboratory data can help to identify risk groups and create monitoring protocols for these patients, preventing neural injury and secondary infections.
Acknowledgements
The authors would like to thank the team at the National Reference Center for Sanitary Dermatology and Leprosy and Conselho Nacional de Desenvolvimento Científi co e Tecnológico (CNPq) for their fi nancial support.
Confl ict of Interest
The authors declare that there is no confl icts of interest.
Financial Support
Conselho Nacional de Desenvolvimento Científi co e Tecnológico (CNPq).
REFERENCES
1. Lockwood DN, Nicholls P, Smith WC, Das L, Barkataki P, van
Brakel W, et al. Comparing the clinical and histological diagnosis of
leprosy and leprosy reactions in the INFIR cohort of Indian patients with multibacillary leprosy. PLoS Negl Trop Dis 2012; 6: e1702. doi: 10.1371/journal.pntd.0001702.
2. Little D, Khanolkar-Young S, Coulthart A, Suneetha S, Lockwood
DN. Immunohistochemical analysis of cellular infi ltrate and gamma
interferon, interleukin-12, and inducible nitric oxide synthase expression in leprosy type 1 (reversal) reactions before and during prednisolone treatment. Infect Immun 2001; 69:3413-3417.
3. Kumar N, Droga S, Kaur I. Epidemiological characteristics of leprosy reactions: 15 years’ experience from North India. Int J Lepr
Other Mycobact Dis 2004; 72:125-133.
4. Silva SF, Griep RH. Reação hansênica em pacientes portadores de hanseníase em centros de saúde da área de planejamento 3.2 do município do Rio de Janeiro. Hansen Int 2007; 32:155-162.
5. World Health Organization. Leprosy disabilities: magnitude of the
problem. Wkly Epidemiol Rec 1995; 70:269-275.
6. Bührer-Sékula S, Smits HL, Gussenhoven GC, van Leeuwen J,
Amador S, Fujiwara T, et al. Simple and fast lateral fl ow test for classifi cation of leprosy patients and identifi cation of contacts
with high risk of developing leprosy. J Clin Microbiol 2003; 41: 1991-1995.
7. Ridley DS, Jopling WH. Classifi cation of leprosy according to
immunity. A fi ve group system. Int J Lepr Other Mycobact Dis
1966; 34:255-273.
8. Kahawita IP, Walker SL, Lockwood DNJ. Leprosy type 1 reactions
and erythema nodosum leprosum.An Bras Dermatol 2008;
83:75-82.
9. MacGregor RR, Sheagren JN, Lipsett MB, Wolff SM.
Alternate-day prednisone therapy. Evaluation of delayed hypersensivity responses, control of disease and steroid side effects. N Engl J Med
1969; 280:1427-1431.
10. Matthews SJ, McCoy C. Thalidomide: a review of approved and investigation uses. ClinTher 2003; 25:342-395.
11. Pocaterra L, Jain S, Reddy R, Muzaffarullah S, Torres O, Suneetha
S, et al. Clinical course of erythema nodosum leprosum: an 11-year cohort study in Hyderabad, India. Am J Trop Med Hyg 2006;
74:868-879.
12. Barreto JA, Belone AFF, Fleury RN, Soares CT, Lauris JRP. Manifestations of reactional tuberculoid pattern in borderline leprosy: comparative, histochemical and immunohistochemical study, in skin biopsies, between type 1 reactions occurred before and
during multidrug therapy. An Bras Dermatol 2005; 80:S268-S274.
13. Manandhar R, LeMaster JW, Roche PW. Risk factors for erythema
nodosum leprosum. Int J Lepr Other Mycobact Dis 1999; 67:270-278.
14. Rodrigues LC, Lockwood DNJ. Leprosy now: epidemiology, progress, challenges, and research gaps. Lancet Infect Dis 2011; 6:464-470.
15. Becx-Bleumink M, Berhe E. Occurrence of reactions, their diagnosis
and management in leprosy patients treated with multidrug therapy; experience in the leprosy control program of the All Africa Leprosy and Rehabilitation Training Center (ALERT) in Ethiopia. Int J Lepr
Other Mycobact Dis 1992; 60:173-184.
16. Rodrigues ALP, Almeida AP, Rodrigues BF, Pinheiro CA, Borges
DS, Mendonça MLH, et al. Occurrence of late leprosy reaction in leprosy patients: subsidies for implementation of a specifi c care
program. Hansen Int 2001; 25:17-25.
17. Antunes DE, Araujo S, Ferreira GP, Cunha ACSR, Costa AV,
Goncalves MA, et al. Identifi cation of clinical, epidemiological
and laboratory risk factors for leprosy reactions during and after
multidrug therapy. Mem Inst Oswaldo Cruz 2013; 108:901-908. 18. Sousa ALOM, Stefani MMA, Pereira GAS, Costa MB, Rebello
PF, Gomes MK, et al. Mycobacterium leprae DNA associated with type 1 reactions in single lesion paucibacillary leprosy treated
with single dose rifampin, ofl oxacin and minocycline. Am J Trop Med Hyg 2007; 77:829-833.
19. Singh N, Manucha V, Bhattacharya SN, Arora VK, Bhatia A.
Pitfalls in the cytological classifi cation of borderline leprosy in the Ridley-Jopling scale. Diagn Cytopathol 2004; 30:386-388.
20. Foss NT, de Oliveira EB, Silva CL. Correlation between TNF
production, increase of plasma C-reactive protein level and suppression of T lymphocyte response to concanavalin A during erythema nodosum
leprosum. Int J Lepr Other Mycobact Dis 1993; 61:218-226.
21. Brito MFM, Ximenes RAA, Gallo MEN, Bührer-Sékula S. Association between leprosy reactions after treatment and bacterial load evaluated using anti PGL-I serology and bacilloscopy.