Paulo NadanovskyI
Roger Keller CelesteII
Margo WilsonIII
Martin DalyIII
I Departamento de Epidemiologia. Instituto de Medicina Social (IMS). Universidade do Estado do Rio de Janeiro (UERJ). Rio de Janeiro, RJ, Brasil
II Programa de Pós-Graduação em Saúde Coletiva. IMS-UERJ. Rio de Janeiro, RJ, Brasil
III Department of Psychology, Behaviour and Neuroscience. McMaster University. Hamilton, ON, Canada
Correspondência | Correspondence: Paulo Nadanovsky
Universidade do Estado do Rio de Janeiro Instituto de Medicina Social
Rua São Francisco Xavier, 524, 7º andar 20550-900 Rio de Janeiro, RJ, Brasil E-mail: [email protected] Recebido: 21/8/2008
Homicide and impunity: an
ecological analysis at state level
in Brazil
Homicídio e impunidade: análise
ecológica em nível de estado no
Brasil
ABSTRACT
OBJECTIVE: To assess a new impunity index and variables that have been found to predict variation in homicide rates in other geographical levels as predictive of state-level homicide rates in Brazil.
METHODS: This was a cross-sectional ecological study. Data from the mortality information system relating to the 27 Brazilian states for the years 1996 to 2005 were analyzed. The outcome variables were taken to be homicide victim rates in 2005, for the entire population and for men aged 20-29 years. Measurements of economic and social development, economic inequality, demographic structure and life expectancy were analyzed as predictors. An “impunity index”, calculated as the total number of homicides between 1996 and 2005 divided by the number of individuals in prison in 2007, was constructed. The data were analyzed by means of simple linear regression and negative binomial regression.
RESULTS: In 2005, state-level crude total homicide rates ranged from 11 to 51 per 100,000; for young men, they ranged from 39 to 241. The impunity index ranged from 0.4 to 3.5 and was the most important predictor of this variability. From negative binomial regression, it was estimated that the homicide victim rate among young males increased by 50% for every increase of one point in this ratio.
CONCLUSIONS: Classic predictive factors were not associated with homicides in this analysis of state-level variation in Brazil. However, the impunity index indicated that the greater the impunity, the higher the homicide rate.
Brazil’s homicide rate in 2005 was 27 victims per 100,000 inhabitants, which was one of the highest rates in the world.a As has been noted by Duarte et al6, this death toll is by no means uniform across the country. State-level homicide rates in 2005, for example, ranged from 11 per 100,000 in Santa Catarina (southern Brazil) to 51 per 100,000 in Pernambuco (northeastern Brazil).
The obvious candidate predictors of violence are measurements of poverty and social development. Several of these have been shown to be associated with homicide rate variability among municipalities in the states of Rio de Janeiro (southeastern Brazil) and Pernambuco, and among neighborhoods within the city of São Paulo (southeastern Brazil).9,15,21 The degree to which access to resources is inequitable may also be relevant,8 since inequity exacerbates competition.5,22 In fact, the Gini index of income inequality has been
INTRODUCTION
a Rede de Informação Tecnológica Latino-Americana [internet]. Brasília; 2008 [cited 2008 Jul 01] Available from: http://www.ritla.net b Albuquerque RC. Um balanço social do Brasil, 1980-2005. Fórum Especial - A Grande Revolução - integração de desenvolvimento e democracia. 27 de setembro de 2007. Rio de Janeiro: Instituto Nacional de Altos Estudos; 2007. (Estudos e Pesquisas, 206).
the most consistent and substantial predictor of homi-cide rates in cross-national studies.8 It has also been a powerful predictor of variability among US states and Canadian provinces,5 and a signiicant predictor of within-state variability in Brazil.15,21 Another potential predictor is life expectancy: where prospects in life are poor or uncertain, illegal and dangerous ways of pursuing one’s interests become relatively attractive, resulting in elevated rates of violent death.22 Of course, all these measurements are likely to be associated with one another, and Albuquerque therefore combined them into a single Social Development Index.b
A rather different sort of potential predictor is the perceived likelihood and/or magnitude of punishment. From a “rational choice” perspective, low probabilities of arrest and conviction and/or short sentences reduce the prospective costs of committing a crime.16 Moreover, regardless of whether violent crime can reasonably be
RESUMO
OBJETIVO: Avaliar um novo índice de impunidade e variáveis que predizem
variação em taxas de homicídio em outros níveis geográicos como preditivos
das taxas de homicídio no nível de estados no Brasil.
MÉTODOS:Estudo ecológico transversal. Foram analisados dados do Sistema de Informações sobre Mortalidade referentes aos 27 estados brasileiros no período de 1996 a 2005. Foram consideradas variáveis de desfecho taxas de vitimização por homicídio em 2005 para a população inteira e para homens de 20-29 anos. Foram analisados como preditores medidas de desenvolvimento econômico e social, desigualdade econômica, estrutura demográfica e expectativa de vida. Foi construído um índice de impunidade calculado pelo número total de homicídios entre 1996-2005 dividido pelo número de pessoas na prisão em 2007. Os dados foram analisados empregando-se regressão linear simples e regressão binomial negativa.
RESULTADOS: Em 2005, taxas brutas de homicídio em nível de estado variaram de 11 a 51 por 100.000 e aquelas para homens jovens de 39 a 241. O índice de impunidade variou entre 0,4 e 3,5, sendo o preditor mais importante dessa variabilidade. Na regressão binomial negativa, estimou-se aumento de 50% na taxa de homicídio em homens jovens para cada aumento de um ponto nessa razão.
CONCLUSÕES: Preditores clássicos não estavam associados com a variação nas taxas de homicídio nessa análise em nível estadual no Brasil. Entretanto, o índice de impunidade indicou que quanto maior a impunidade, maior a taxa de homicídio.
a e.g. “… [impunity] … generates in the citizen’s consciousness a disbelief in justice and, in many, a conviction that, in our country, crime pays.” Ferreira Gullar Crime e castigo Folha de S. Paulo, 2006 ago 06; Caderno “Ilustrada”:E12.
b Gestoso JIC. Mensurando a impunidade no sistema de justiça criminal no Rio de Janeiro. Relatório Final. Rio de Janeiro: Secretaria Nacional de Segurança Pública; 2006[cited 2009 Sep 10]. Available from: http:// www.ucamcesec.com.br/at_proj_conc_texto.php?cod_proj=219 c Carvalho J. Impunidade é a regra nos assassinatos no país. O Globo, 2006 ago 06; Primeiro caderno – O País:19.
d In Brazil, the minimum sentence for murder, i.e. the crime of “homicídio doloso”, as defined in article 121 of the Brazilian Penal Code, which is equivalent to “Homicide with malice aforethought” (homicide with premeditated malice), is six years when the perpetrator does not have any previous record. If good behavior is demonstrated, murderers can be freed after serving two years in prison. Such short sentences could in themselves be considered to be a reflection of relative impunity.
e Ministério da Justiça. Sistema de Informações Penitenciárias – InfoPen [internet]. Brasília; 2004 [cited 2007 Oct 1]. Available from: http://www.mj.gov.br
f Ministério da Saúde. DATASUS. Sistema de Informações sobre Mortalidade - SIM. Brasília; 1975 [cited 2007 Oct 1]. Available from: interpreted as “rational”, there is substantial
interna-tional evidence that a high probability (“certainty”) of punishment deters it.14,17,20 But despite both this evidence and a widespread public perception in Brazil that crime pays,a it appears that nobody has yet attempted to assess possible links between impunity and homicide in Brazil. We therefore propose a novel “impunity index” in the present study, to address this question.
Ideally, impunity should be assessed as the likelihood that a homicide offender will avoid penalty. However, no means for assessing this likelihood on a state-by-state basis exist. Therefore, a proxy for assessing impunity had to be chosen for the present investigation. Homicide is a serious offence and such cases should, ideally, be solved and adjudicated reasonably promptly: a two-year period should be enough time for arrest and conviction. In Brazil, many homicide cases are not cleared and tried within two years,b,c and convicted killers might not serve substantial sentences.d For any given ten-year period, the offenders in homicides perpetrated over that period would be expected, if homicide were punished severely, to be in the prison population two years after the end of the period. Those who are not in prison either have not been apprehended or have been treated relatively leniently by the justice system. Both of these situations constitute components of impunity. In other words, Brazilian states that caught more murderers who had committed homicide during the period under consid-eration and kept them in prison for longer times would therefore be expected to exhibit lower scores in our impunity index. This is admittedly a somewhat arbitrary
index, but it is intended to relect both the probability
and the magnitude of punishment, and to capture both the incapacitating and the deterrent effect of prison on homicide. In theory, imprisonment reduces homicide in two ways: by removing killers from the streets, they are incapable of committing further homicides while incar-cerated (incapacitation); and the threat of being arrested prevents free people from killing (deterrence).14,17,20
It would be preferable to use only imprisoned killers rather than the entire prison population as the denominator. However, some states had large numbers of prisoners in police cells, for whom information regarding their crimes was unavailable, unlike those in penitentiaries, for whom crime categories were available.e
Many previous studies have used gross incarceration rates (proportion of the population in prison) to index the level of punishment.18,20 However, such rates are themselves dependent, in part, on crime rates, and therefore assessing their “effects” on criminal offending runs the risk of circularity (especially in cross-sectional studies).
The homicide victim rate is higher among young men than among any other demographic group, and this is the component of the total homicide rate that is most responsive to economic and social variables.4 Sexual selection theory suggests that the reason why young men are prepared to compete dangerously for intangible resources like status and face, as well as for more tangible material resources, is that all of these resources contribute towards men’s reproduc-tive success. Moreover, according to this perspecreproduc-tive, such competition is ultimately about access to women. Therefore, if the sex ratio is high, competition between men may be exacerbated.4
In order to address the problem of violence, the objec-tive of the present study was to assess a new impunity index and variables that have been found to predict variation in homicide rates in other geographical levels as predictive of state-level homicide rates in Brazil.
METHODS
This was a cross-sectional ecological study, with the Brazilian states (n = 27) as the unit of analysis.
The impunity index was constructed in accordance with the concepts outlined previously. The total number of homicides over the years 1996 to 2005 was divided by the number of individuals in prison (state penitentiaries and police cells) in 2007.e
The overall numbers of deaths due to homicide
(International Classiication of Diseases version 10,
Demographic variables were examined as potential predictors because previous research has suggested that the homicide victim rate among young men is not only the highest of any demographic group but also consti-tutes the component of the total homicide rate that is most responsive to economic and social variables.4 We therefore analyzed both the overall homicide victim rate and the rate for men aged 20-29 years. In addition, to assess the intensity of competition among young men, we analyzed potential predictors such as the percentage of the population that consisted of 20-29 year-old males in 2005; the percentage of 15-24 year-old females; and the sex ratio of 15-24 year-old females divided by 20-29 year-old males in 2005. Life expectancy at birth in 2000,22 the percentage of 20-29 year-olds who were illiterate in 2000 and the percentage of the population living in urban areas were also included. To assess material resources and poverty, we used per capita household income in 2000, along with the percentages of households in 2000 with any three of the following: a television set, a landline phone, a car and a refrigerator. For our index of economic inequality, we used the 2000
Gini coeficient, based on household income.a Finally, we included Albuquerque’s Índice de Desenvolvimento Social (IDS; General Social Development Index) for 2000. This index ranges from 0 to 1, with higher values indicating higher development, and is built from the following indicators: life expectancy at birth and infant mortality (health); literacy and number of years of formal education (education); unemployment rate (work); gross state product per capita and Gini index of household income inequality (income); access to piped water, electricity, refrigerator and television (living).b
For the data analysis, we modeled the counts of homicide in 2005 using negative binomial regression through generalized linear models with log-link.11 We ran a natural model for counting variables (Poisson), but to account for over-dispersion, we applied a nega-tive binomial distribution. With these regressions, we modeled the raw number of homicides, but to account for differences in population sizes between states (and
thereby, in effect, to model the inluences on homicide
rates), the relevant population size was used as an offset. All analyses were performed using the Stata 9.2 software.
RESULTS
The homicide victim rates per 100,000 inhabitants ranged from lows of 11 (overall) and 39 (20-29 year-old men) in Santa Catarina to highs of 51 (overall) and 241 (young men) in Pernambuco (Table 1).
In the bivariate correlations among variables across
states, only the impunity index was signiicantly corre -lated with homicide (Table 2). This index ranged from 0.4 in Acre (northern Brazil) and 0.5 in Santa Catarina to 3.5 in Alagoas (northeastern Brazil) (mean = 1.2; SD = 0.7; median = 1.0) (Table 1). Figures 1 and 2 display
the signiicant relationships between impunity and the
two homicide rates, along with the absence of apparent relationships between homicide and measurements of poverty, income inequality and education.
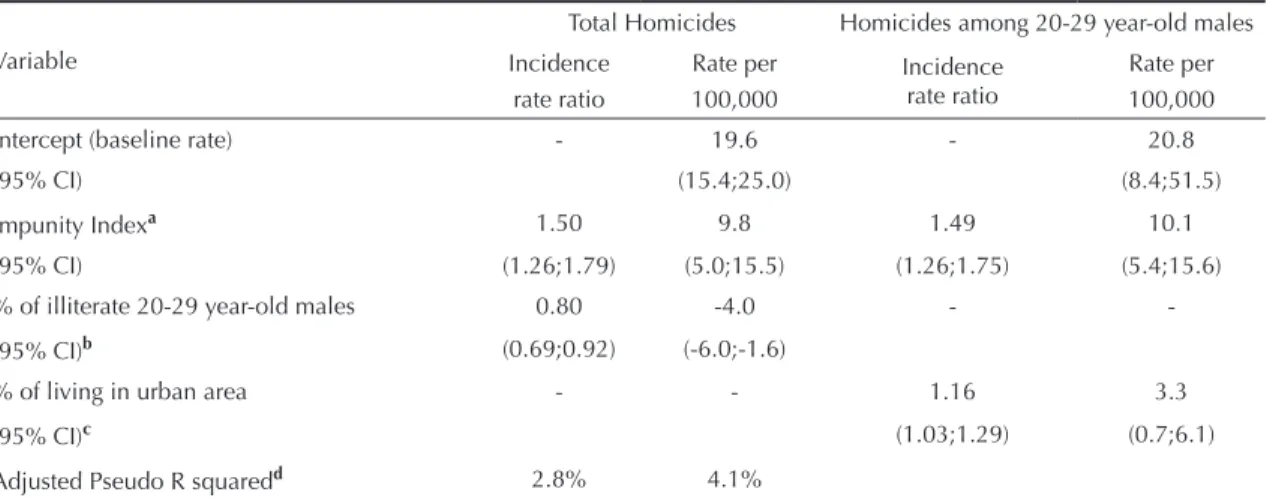
Negative binomial regression analysis (Table 3) showed
that impunity was the primary signiicant predictor for
both homicide rates, but additional lesser predictors were also detected: illiteracy among males aged 20-29 years predicted lower gross homicide rates and living in urban areas predicted higher rates among young men. The adjusted incidence rate of the impunity index for young men was 1.49, meaning that there was an increase of nearly 50% in the homicide rate for every one-point increase in the impunity index. The absolute change in homicide victim rate for an increase in the impunity index from zero to one was 10.1 homicides per 100,000 20-29 year-old males. The regression diagnosis showed that deviance residuals were normally distributed with no outliers (Table 3).
DISCUSSION
The only signiicant predictor of state-level homicide
rates in the present study was the novel impunity index. With many candidate predictors, it is possible that the relationship with impunity arose by chance. However, several additional considerations suggest
that it is genuine. In the irst place, whereas the simple
linear R² for homicide with young males as the victims, in relation to impunity, is 0.44 when all 27 states are included, it goes up to 0.52 if the eight states with the lowest-quality mortality data are excluded (those in which over 30% of male deaths are due to unknown causes).19 It goes up again, to 0.65, if the analysis is limited to the 11 states with the best quality data (those in which less than 15% of male deaths are due to unknown causes).19 Secondly, there was a system-atic tendency for the impunity index to make better predictions regarding homicide rates, towards the end of the impunity measurement period (1996-2005): R² = 0.10 for the impunity index and the 1999 homicide rate, 0.15 for 2000, 0.19 for 2001, 0.22 for 2002, 0.27 for 2003, 0.29 for 2004 and 0.44 for 2005. This trend is easily interpreted if the relationship is genuine rather than spurious: the farther away from the time when the impunity effect should be most strongly felt (which
a Organização das Nações Unidas. Programa das Nações Unidas para o Desenvolvimento. Atlas do desenvolvimento humano do Brasil. Brasília; 2004 [cited 2007 Oct 1]. Available from: http://www.pnud.org.br/atlas/
according to our hypothesis should be around 2005), the weaker the association is.
There is substantial data in the literature implicating income inequality, social development measures and population demography as predictors of homicide rate variability. The observation scales in these previous studies range from coarser than to similar levels and
iner than the state-level scale examined here. It is
therefore surprising that we found little evidence for such effects in the present analyses. This is especially so because the relatively clear evidence of a relation-ship with impunity indicates that the general pattern of results probably cannot be attributed to “noise” in the state-level homicide data. Moreover, the strong associa-tions, in predicted direcassocia-tions, with life expectancy and
socioeconomic variables suggest that the state-level data in our study are generally valid. With regard to the homicide data, “the overall quality (of reported deaths due to basic causes in Brazilian states) can be consid-ered at least to be satisfactory”.19 Brazilian mortality data quality is considered especially good in relation to violent deaths.19
Regarding income inequality, one possibility is that the Brazilian states may be above the threshold for a
relationship between the Gini coeficient and homi -cide.13 However, income inequality has been found to
be correlated with homicide rates on a iner scale, even
within Brazil: Lima et al15 found a small but statistically
signiicant positive relationship (R² = 0.03) between homicide and the Gini coeficient across municipalities
Table 1. Homicide victim rate per 100,000 among men aged 20-29 years in 2005; overall homicide victim rate per 100,000 inhabitants in 2005; impunity index, i.e. ratio of total homicides (1996-2005) to prison population (2007); per capita monthly household income in 2000, in Reais; percent of illiterate males 20-29 years of age in 2000; and Gini index of household income inequality in 2000, in the 27 Brazilian states.
State / Variable Hom males 20-29 Hom All Impunity Income Illiteracy (%) Gini
Pernambuco (PE) 241 51 2.4 184 19 0.67
Rio de Janeiro (RJ) 200 46 2.3 414 4 0.61
Espírito Santo (ES) 195 47 1.1 290 5 0.61
Alagoas (AL) 177 40 3.5 140 28 0.69
Amapá (AP) 137 33 0.9 211 7 0.64
Pará (PA) 114 28 1.4 169 12 0.66
Paraná (PR) 112 29 0.8 321 3 0.61
Distrito Federal (DF) 111 28 0.9 605 3 0.64
Sergipe (SE) 110 25 1.4 164 21 0.66
Rondônia (RO) 110 36 1.0 234 5 0.61
Goiás (GO) 106 26 0.9 286 6 0.61
Mato Grosso (MT) 101 32 1.0 288 6 0.63
Bahia (BA) 96 20 2.1 160 16 0.67
Ceará (CE) 96 21 1.0 156 22 0.68
Minas Gerais (MG) 96 22 0.7 277 5 0.62
Mato Grosso do Sul (MS) 91 28 0.6 287 5 0.63
Paraíba (PB) 89 21 0.6 150 26 0.65
São Paulo (SP) 86 22 0.9 443 3 0.59
Amazonas (AM) 83 19 1.6 174 10 0.68
Rio Grande do Sul (RS) 81 19 0.7 358 3 0.59
Roraima (RR) 79 24 0.9 232 7 0.62
Acre (AC) 73 18 0.4 181 20 0.65
Maranhão (MA) 71 15 1.1 110 22 0.66
Rio Grande do Norte (RN) 62 14 1.0 176 21 0.66
Piauí (PI) 57 12 1.1 129 25 0.66
Tocantins (TO) 53 15 0.7 173 11 0.66
Santa Catarina (SC) 39 11 0.5 349 3 0.56
Brazil average 106 26 1.2 247 12 0.64
Homicide and impunity
Nadano
vsk
y P et al
Variable A B C D E F G H I J K
Overall homicide victim rate (per 100,000 inhabitant) in 2005 0.55** 0.18 0.14 -0.02 0.07 0.02 -0.18 0.19 0.01 0.24 0.30
Homicide victim rate per 100,000 among men aged 20-29 years in
2005 0.66** 0.03 0.11 0.14 0.00 0.14 -0.01 0.10 -0.04 0.15 0.26
A. Impunity index: ratio of total homicides (1996-2005) to prison
population (2007) -0.11 0.11 0.34 -0.35 0.53** 0.39* -0.23 -0.40* -0.24 -0.13
B. Young men: percentage of the 2005 population consisting of men
aged 20-29 years 0.80** -0.02 0.16 -0.01 -0.43* 0.36 0.32 0.32 0.32
C. Young women: percentage of the 2005 population consisting of
women aged 15-24 years 0.58** -0.24 0.41* 0.06 0.13 0.04 0.00 0.11
D. Sex ratio: number of women aged 15-24 years divided by number
of men aged 20-29 years -0.66** 0.72** 0.70** -0.31 -0.40* -0.48* -0.29
E. Life expectancy at birth in 2000 -0.75** -0.80** 0.76** 0.83** 0.85** 0.71**
F. Economic inequality: Gini index of household income inequality
in 2000 0.78** -0.65** -0.77** -0.69** -0.52**
G. Illiteracy: percent of illiterate males aged 20-29 years in 2000 -0.76** -0.80** -0.86** -0.71**
H. Average economic prosperity: per capita monthly household
income in 2000, in Reais 0.95** 0.93** 0.83**
I. Access to material goods: percentage of households with three out
of TV, phone, car and refrigerator in 2000 0.93** 0.81**
J. Social development: Albuquerque (2007) social development index
in 2000 0.87**
K. Percentage of state population living in urban centers in 2000
* p < 0.05
within the state of Pernambuco. Szwarcwald et al21 also
reported a signiicant positive relationship (R² = 0.36)
across districts within the city of Rio de Janeiro but
a signiicant negative relationship (R² = 0.28) across
municipalities within the state. The meaning of these contrasting results at different places and different scales remains to be elucidated.
Longitudinal data suggest that reduced poverty and increased education are not having the expected ameliorative effect on Brazilian homicide rates. Social
conditions in Brazil have improved signiicantly since
the 1970s,a with apparent positive effects on health and life expectancy at birth, which increased from 58 years in 1970 to 65 in 1991 and 72 in 2005. The association between social development and life expectancy was also very strong in our cross-sectional analysis (Table 2). Nevertheless, homicide rates in most Brazilian states have increased, including increases in the decade from 1996 to 2005. Our cross-sectional analysis rein-forces this apparent lack of association between social development and reduction in homicide in Brazil.
Perhaps when impunity is extreme, as suggested by the fact that our index commonly exceeds 1.0 (meaning that homicides in the past decade in some states outnumber the total numbers of individuals incarcer-ated for any crime), there is limited scope for important social development variables to have an ameliorative effect on violence.
One important limitation of this study is that the direc-tion of the associadirec-tion cannot be established. Therefore, the association that we found is entirely compatible with too many homicides (or crime in general) causing high impunity rather than high impunity causing too many homicides. Increased crime may overwhelm the police and justice system, with impunity increasing as a consequence.17
The failure of socioeconomic development, income inequality, demographic structure and life expectancy to predict homicide may be a result of our focus on state-level data. Homicide in Brazil tends to be concentrated in large urban areas and, within these areas, its distribu-tion is again heterogeneous. This has led researchers
Table 3. Negative binomial regression on number of homicides in 2005. Brazilian states.
Variable
Total Homicides Homicides among 20-29 year-old males
Incidence rate ratio
Rate per 100,000
Incidence rate ratio
Rate per 100,000
Intercept (baseline rate) - 19.6 - 20.8
(95% CI) (15.4;25.0) (8.4;51.5)
Impunity Indexa 1.50 9.8 1.49 10.1
(95% CI) (1.26;1.79) (5.0;15.5) (1.26;1.75) (5.4;15.6)
% of illiterate 20-29 year-old males 0.80 -4.0 -
-(95% CI)b (0.69;0.92) (-6.0;-1.6)
% of living in urban area - - 1.16 3.3
(95% CI)c (1.03;1.29) (0.7;6.1)
Adjusted Pseudo R squaredd 2.8% 4.1%
Notes:
Coefficients from negative binomial regression are expressed on a log scale, and thus, this table presents the exponent of the regression coefficients
Total population and number of 20-29 males in the population entered as offset, respectively.
Other explanatory variables were tried but did not enter in the forward stepwise procedure at p < 0.20 for decision-making.1,12
aCoefficient of rate per 100,000 inhabitants represents the difference in impunity index score from 0 to 1 and the incidence rate ratio coefficient represents any increase of 1 point in the impunity index
bCoefficient of rate per 100,000 inhabitants represents the difference in percentage of illiterate males aged 20-29 years from 0 to 10 and the coefficient of the incidence rate ratio represents any increase of 10 percentage points.
cCoeffiicent of rate per 100,000 inhabitants represents the difference in percentage living in urban area from 0 to 10 and the coefficient of the incidence rate ratio represents any increase of 10 percentage points.
dThe models were built by means of the stepwise technique with the p-level set at 0.20 for decision-making.1,12 Since
forward and backward stepwise models yielded different sets of variables, we chose to report the most parsimonious, namely the forward models, which explained 2.8% of the variation in overall homicide victim rate and 4.1% of the variation in homicide victim rate for young men (Ben-Akiva and Lerman pseudo- R²).
Figure 1. Relationship between the homicide victim rate (per 100,000) in 2005 among 20-29 year-old men and a) impunity over the period 1996-2005; b) per capita income in 2000; c) illiteracy in 2000; and d) economic inequality in 2000.
RO
AC RR AM
PA AP TO MA PI CE RN PB PE AL SE BA MG ES RJ SP PR SC RS MS GO MT
DF 5 0 1 0 0 1 5 0 2 0 0 2 5 0 H o m ic id e v ic ti m r at e am o n g 2 0 -2 9 y ea r-o ld m al es i n 2 0 0 5
0 1 2 3 4
1a- Impunity Index
Linear R Sq= +0.441
RO AC AM RR PA AP TO MA PI CE RN PB PE AL SE BA MG ES RJ SP PR SC RS MSMT GO DF
100 200 300 400 500 600
1b- Per capita Household Income in 2000
Linear R Sq= +0.01
RO AC AM RR PA AP TO MA PI CE RN PB PE AL SE BA MG ES RJ SP PR SC RSMS MT GO DF 5 0 1 0 0 1 5 0 2 0 0 2 5 0 H o m ic id e v ic ti m r at e am o n g 2 0 -2 9 y ea r-o ld m al es i n 2 0 0 5
0 10 20 30
1c- Percentage of illiterate males aged 20-29 years in 2000
Linear R Sq= +0.0001
RO AC AM RR PA AP TO MA PI CE RN PB PE AL SE BA MG ESRJ SP PR SC RS MS MT GO DF
.55 .6 .65 .7
1d- Gini Index of Household Income Inequality in 2000
Linear R Sq= +0.021
to work with smaller areas, in order to identify which structural variables affect homicide. Moreover, there is great heterogeneity within states regarding the socioeco-nomic indicators that we used. Research at several levels is welcome, since all such investigations put together will probably paint a better picture of the realities. However, in our study we were interested in the possible relevance of impunity, which is a state-level variable because policing and justice are state prerogatives (not federal, nor regional or municipal) in Brazil.
Our most successful explanatory variable was a ratio, in which crime (in our study, homicide) was included both in the numerator of the outcome and in explanatory variables. The use of this type of variable, when trying
to assess the effect of prison on crime, could lead to substantial bias when measurement error is present (even if the errors in measuring crime are completely random and unrelated to the prison population).10,20 However, the fact that the impunity index was associated with socio-economic conditions in the expected direction (i.e. less impunity in better-off states) suggests that the measure-ment error was not so large as to create an illusion.
killers, our measure would be unrelated to the impunity
speciically associated with the act of homicide. It is
more likely, however, that where people have a rela-tively high probability of being jailed for lesser crimes, they also have a relatively high probability of being apprehended and jailed for murder. There is the possi-bility that certain states may impose prison sentences only for serious crimes including homicide, while in others, jail awaits those convicted of lesser offences; the homicides-prisoners ratio would be lower in the latter case even if the probability of being imprisoned for homicide were identical. If this were so, then our indicator might be predictive of homicide because of incapacitation rather than punishment for homicide: a
low ratio would relect a high prison population and
the disproportionate removal of potential killers from the streets before they could kill.3
In conclusion, our impunity index was the primary variable explaining the variation in homicide rates among Brazilian states, and the relationship was posi-tive. Surprisingly, income inequality, life expectancy and other economic and demographic variables that are commonly implicated as correlates of homicide rates were not found to be relevant. There are reasons to doubt that violence will be similarly associated with social disadvantage and inequality in every sort of society, given that in the absence of effective police and judiciary, Figure 2. Relationship between total homicide victim rate (per 100,000 inhabitants) in 2005 and a) impunity over the period 1996-2005; b) per capita income in 2000; c) illiteracy in 2000; and d) economic inequality in 2000.
RO AC AM RR PA AP TO MA PI CE RN PB PE AL SE BA MG ES RJ SP PR SC RS MS MT GO DF 1 0 2 0 3 0 4 0 5 0 T o ta l h o m ici d e vi ct im r at e in 2 0 0 5
0 1 2 3 4
1a- Impunity Index
Linear R Sq= +0.299
RO ACAM RR PA AP TO MA PI CE RN PB PE AL SE BA MG ES RJ SP PR SC RS MS MT GO DF
100 200 300 400 500 600
1b- Per capita Household Income in 2000 Linear R Sq= +0.04
RO AC AM RR PA AP TO MA PI CE RN PB PE AL SE BA MG ES RJ SP PR SC RS MS MT GO DF 1 0 2 0 3 0 4 0 5 0 T o ta l h o m ici d e vi ct im r at e in 2 0 0 5
0 10 20 30
1c- Percentage of illiterate males aged 20-29 years in 2000 Linear R Sq= +0.03
RO AC AM RR PA AP TO MA PI CE RN PB PE AL SE BA MG ES RJ SP PR SC RS MS MT GO DF
.55 .6 .65 .7
1. Altman DG. Practical statistics for medical research. London: Chapman and Hall; 1991.
2. Chagnon NA. Life histories, blood revenge, and warfare in a tribal population. Science. 1988;239(4843):985-92. DOI: 10.1126/ science.239.4843.985
3. Cook PJ, Ludwig J, Braga AA. Criminal records of homicide offenders. JAMA. 2005;294(5):598-601. DOI: 10.1001/jama.294.5.598
4. Daly M, Wilson M. Homicide. New Brunswick: Transaction Publishers; 1988.
5. Daly M, Wilson M, Vasdev S. Income inequality and homicide rates in Canada and the United States. Can J Criminol. 2001;43(2):219-36.
6. Duarte EC, Schneider MC, Paes-Sousa R, Silva JB, Castillo-Salgado C. Expectativa de vida ao nascer e mortalidade no Brasil em 1999: análise exploratória dos diferenciais regionais. Rev Panam Salud Publica. 2002;12(6):436-44. DOI: 10.1590/S1020-49892002001200009
7. Eisner M. Long-term historical trends in violent crime. Crime Justice. 2003;30:83-142.
8. Gartner R. The victims of homicide: a temporal and cross-national comparison. Am Sociol Rev. 1990;55(1):92-106. DOI: 10.2307/2095705
9. Gawryszewski VP,Costa LS. Homicídios e desigualdades sociais no Município de São Paulo. Rev Saude Publica. 2005;39(2):191-7. DOI: 10.1590/ S0034-89102005000200008
10. Gibbs JP, Firebaugh G. The Artifact Issue in Deterrence Research. Criminology. 1990;28(2):347-67. DOI: 10.1111/j.1745-9125.1990.tb01329.x
11. Hardin J, Hilbe J. Generalized Linear Models and Extensions. College Station: Stata Press; 2001.
12. Hosmer DW, Lemeshow S. Applied logistic regression. New York: Wiley; 2000.
13. Jacobs D, Richardson AM. Economic inequality and homicide in the developed nations from 1975
to 1995. Homicide Stud. 2008;12(1):28-45. DOI: 10.1177/1088767907311849
14. Levitt SD. Understanding why crime fell in the 1990s: Four factors that explain the decline and six that do not. J Econ Perspect. 2004;18(1):163-90. DOI: 10.1257/089533004773563485
15. Lima MLC, Ximenes RA, Feitosa CL, Souza ER, Souza WV, Albuquerque MFPM, et al. Conglomerados de violência em Pernambuco, Brasil. Rev Panam Salud Publica. 2005;18(2):122-8. DOI: 10.1590/S1020-49892005000700007
16. Mendes SM, McDonald MD. Putting severity of punishment back in the deterrence package. Policy Stud J. 2001;29(4):588-610. DOI: 10.1111/j.1541-0072.2001.tb02112.x
17. Nagin DS. Criminal deterrence research at the outset of the twenty-first century. Crime Justice. 1998;23:1-42. DOI: 10.1086/449268
18. Neapolitan JL. An examination of cross-national variation in punitiveness. Int J Offender Ther Comp Criminol. 2001;45(6):691-710. DOI: 10.1177/0306624X01456005
19. Paes NA. Qualidade das estatísticas de óbitos por causas desconhecidas dos Estados brasileiros. Rev Saude Publica. 2007;41(3):436-45. DOI: 10.1590/ S0034-89102007000300016
20. Spelman W. What recent studies do (and don’t) tell us about imprisonment and crime. Crime Justice. 2000;27:419-94.
21. Szwarcwald CL, Bastos FI, Viacava F, Andrade CL. Income inequality and homicide rates in Rio de Janeiro, Brazil. Am J Public Health. 1999;89(6):845-50. DOI: 10.2105/AJPH.89.6.845
22. Wilson M, Daly M. Life expectancy, economic inequality, homicide, and reproductive timing in Chicago neighbourhoods. BMJ. 1997;314(7089):1271-4.
REFERENCES
Nadanovsky P and Celeste RK were supported by the Conselho Nacional de Desenvolvimento Científico e Tecnológico (CNPq – National Council for Scientific and Technological Development), with a scientific productivity bursary and a doctoral grant, respectively).
the familiar tendency for violence to be primarily a recourse of the disadvantaged disappears.2,7
Police and judicial practices may be important deter-minants of state-level variability in homicide rates in
Brazil. Future analyses should investigate this matter
using more reined measurements, such as the resources