Carlos Augusto MonteiroI,II Maria Helena D’Aquino BenicioI,II
Silvia Cristina KonnoI,II
Ana Carolina Feldenheimer da SilvaII
Ana Lucia Lovadino de LimaII Wolney Lisboa CondeI,II
I Departamento de Nutrição. Faculdade de Saúde Pública. Universidade de São Paulo (USP). São Paulo, SP, Brasil
II Núcleo de Pesquisas Epidemiológicas em Nutrição e Saúde. (USP). São Paulo, SP, Brasil
Correspondence: Carlos Augusto Monteiro Departamento de Nutrição Faculdade de Saúde Pública da USP 01246-904 São Paulo, SP, Brasil E-mail: [email protected] Received: 8/19/2008 Approved: 12/1/2008
Causes for the decline in child
under-nutrition in Brazil,
1996-2007
ABSTRACT
OBJECTIVE: To describe the evolution of prevalence of under-nutrition among Brazilian underfi ves between 1996 and 2007, and to identify major factors responsible for this evolution.
METHODS: Data analyzed are from two Demographic Health Surveys carried out in Brazil in 1996 and 2006/7 based on probabilistic samples of roughly 4 thousand children under fi ve years of age. Identifi cation of factors responsible for temporal variation in prevalence of under-nutrition (height-for-age below -2 Z-scores; WHO 2006 standard) took into account changes in the distribution of four potential determinants of nutritional status. Statistical modeling of the independent association between these determinants and risk of under-nutrition, and calculation of “partial attributable fractions” were used to determine the relative importance of each factor in the evolution of infant under-nutrition.
RESULTS: Prevalence of under-nutrition fell by approximately 50%, from 13.5% (95%CI: 12.1%; 14.8%) in 1996 to 6.8% (5.4%; 8.3%) in 2006/7. Two-thirds of this reduction could be attributed to favorable evolution in the four factors studied: 25.7% to increased maternal schooling; 21.7% to increased purchasing power of families; 11.6% to expansion of healthcare; and 4.3%to improvements in sanitation.
CONCLUSIONS: The 6.3% annual rate of decline in the proportion of children with height-for-age defi cits indicates that, in another ten years, child malnutrition in Brazil may no longer be a public health issue. Achieving this will depend on the maintenance of economic and social policies that have favored an increase in purchasing power among the poor, and on public investments aimed at completing the universalization of access to essential services such as education, health, and sanitation among the Brazilian population.
DESCRIPTORS: Child. Malnutrition, epidemiology. Child Nutrition Disorders. Nutrition Surveys. Socioeconomic Factors. Child Health (Public Health).
INTRODUCTION
Under-nutrition during the fi rst years of life, as measured by anthropometric indicators of nutritional status, is a major health issue in developing countries. Exhaustive evidence shows that growth defi cits in childhood are associated with higher mortality, excess infectious disease, delayed psychomotor development, academic underachievement, and lower productive capacity in adult life.3,16 For
a BEMFAM. Pesquisa nacional sobre demografi a e saúde 1996: relatório da pesquisa. Rio de Janeiro, 1997.
b CEBRAP / Ministério da Saúde. Departamento de Ciência e Tecnologia. Pesquisa Nacional de Demografi a e Saúde da Criança e da Mulher: PNDS 2006. Brasília/DF, 2008. (Research Report).
c Macro International. Measure DHS: Methodology. [cited 2008 Nov 30] Available from: http://www.measuredhs.com/aboutsurveys/dhs/ methodology.cfm
Temporal trends in under-nutrition among the Brazilian underfi ve population are a common subject of study and analysis thanks to the availability of nation-wide anthro-pometric surveys carried out regularly in the country since the mid 1970s. Based on these surveys, decreasing trends in prevalence of childhood under-nutrition have been identifi ed between 1975 and 1989 and between 1989 and 1996. Such trends have been attributed more to increases in maternal schooling and expanded cove-rage of healthcare and sanitation than to changes in the purchasing power of the population.8-10 Data from the
latest nation-wide anthropometric survey, carried out in 2006/7, will allow us to update the temporal trends in child under-nutrition in Brazil, as well as to study in depth the factors that have infl uenced under-nutrition trends in the period between 1996 and 2007. This is the aim of the present study.
METHODS
All data included in the present study originate from two surveys, carried out in Brazil as part of the inter-national Demographic Health Surveys (DHS) program. The fi rst of these was conducted between March and June 1996 (National Demographic Health Survey [Pes-quisa Nacional sobre Demografi a e Saúde], and will be referred to as PNDS 1996.a The second survey took
place between November 2006 and May 2007 (National Woman and Child Demographic Health Survey) [Pes-quisa Nacional de Demografi a e Saúde da Criança e da Mulher], and will be referred to as PNDS 2007.b
Sampling and data collection
The sampling and data collection procedures employed in both surveys are described in detail elsewhere.a,b
The two surveys were based on complex sampling procedures that involved the stratifi cation of all of the country’s census tracts, random selection of clusters of tracts within each stratum, and random selection of households within each sector. In the two surveys, within the selected households, eligible subjects were all women aged 15-49 years and all biological children of these women aged between zero and 59 months. The major difference between the sampling procedures employed by the two surveys was the exclusion, in PNDS 1996, of the sparsely populated rural sectors of the North Region.
The sample of children aged 0-59 months surveyed in the two studies, already excluding those living in the rural North, totaled 4.801 children in 1996 and 4.424
in 2007. Approximately 14% of children in 1996 and 9% in 2007 did not undergo anthropometric evaluation (most often because they were not home at the time of the interview) and were therefore excluded from the study. In addition to children not examined, we also ex-cluded children whose measured weight or height were biologically incompatible,7 representing under 1% of all
children examined. The fi nal sample of children with valid height (the anthropometric variable central to the present analysis) was 4.132 children in 1996 and 4.034 children in 2007. The sample with valid weight was 4.061 children in 1996 and 4.002 children in 2007.
In both surveys, weight and length (up to age 23 mon-ths) or height (24 months and older) were obtained by teams of two trained and standardized investigators, using electronic scales with 100 g precision and stadio-meters with 1 mm precision. The remaining information of interest to the study was obtained by means of ques-tionnaires adapted from the DHS model.c
Data analysis
Temporal variation in prevalence of under-nutrition
The nutritional status of children was classifi ed based on height-for-age and weight-for-height indices.17
The-se indices, expresThe-sed in z-scores, were calculated using a reference standard that reproduces the distribution of these indices in children under optimal health and nutrition conditions.18 Children with height-for-age
below –2 were classifi ed as stunted and children with weight-for-height below –2 were classifi ed as wasted.17
The temporal variation in risk of childhood under-nutri-tion in Brazil was established by comparing estimated prevalences of stunted and wasted children (and their corresponding 95% confi dence intervals).
Selection and defi nition of explanatory variables
Taking into account a traditional model of causality for childhood under-nutrition,14 and considering the
body of information collected by the PNDSs in 1996 and 2007, we selected four determinants of child nutri-tional status as potential explanatory variables for the temporal variation in risk of under-nutrition between 1996 and 2007: family purchasing power, mother’s schooling, access to health care, and sanitation conditions in the environment.
a Associação Brasileira de Empresas de Pesquisas. Adoção do CCEB 2008: Critério de Classifi cação Econômica Brasil. [cited 2008 Nov 30] Available from: http://www.abep.org/codigosguias/AdocaoCCEB2008.pdf
de Empresas de Pesquisas – ABEP] based on a socio-economic survey carried out in 2005, which included approximately 11 thousand Brazilian families.a These
criteria take into account the total score reached by a family in a scale of nine items (type and number of consumer goods in the household, characteristics of the home, and schooling of the head of household) designed to maximize the correlation between total score and family income. In the case of absence of information on one or more items in the scale, we used values imputed based on regressions of the remaining items on the mis-sing item. The ABEP classifi cation originally includes eight classes in order of decreasing purchasing power (A1, A2, B1, B2, C1, C2, D, and E). In the present study, given the scarcity of children in the higher purchasing power categories, the fi ve highest classes were grouped into a single class. We also classifi ed maternal schooling into four categories, corresponding to 0-3, 4-7, 8-11, and 12 or more years of schooling.
Access to health care was evaluated based on ante-natal and delivery care. Given the strong correlation between these two components, they were combined into a single variable, which was divided into three categories: 6 or more antenatal care appointments and hospital delivery; presence of one of these two items; and absence of both items.
Sanitation conditions considered whether or not the child’s home was connected to the public water supply and sewage networks. Also in this case, we constructed a single variable with three categories: connection to both networks, connection to a single network (in prac-tice, connection to the water network), and absence of connection to water supply and sewage networks.
Valid information on purchasing power, schooling, health care, and sanitation were obtained for approxi-mately 98% of children in 1996 and 93% of children in 2007 (4.052 and 3.741 children, respectively).
Causes of temporal variation in prevalence of under-nutrition
Given the low frequency of wasted children in the two surveys, the analysis of causes of temporal varia-tion in prevalence of under-nutrivaria-tion was restricted to stunted children.
The study of factors that infl uenced temporal variation in prevalence of stunted children was carried out in four stages. In the fi rst stage, we studied the evolution of each of the four putative determinants of stunting by comparing their distribution in 1996 and 2007.
In the second stage, we examined, at the beginning and end of the period, the strength of the association
between determinants of nutritional status and occur-rence of stunting. This analysis was carried out using Poisson multiple regression models1 for each survey.
These models, from here on referred to as 1996 model and 2007 model, generated adjusted relative risks of stunting that estimate, for each survey, the intensity and direction of independent associations between each explanatory variable in the model (determinant of nutri-tional status) and presence of stunting in the child.
In the third stage, we estimated the effect that changes seen in the distribution of the four determinants may have had on the evolution of prevalence of stunting across the period. In principle, this effect could have been estimated in a relatively simple fashion by com-paring the predicted values for the mean probability of stunting when the 1996 risk model is applied, suc-cessively, to the PNDS 1996 database itself and to the PNDS 2007 database. Subtracting the second value from the fi rst would provide an estimate of absolute temporal variation in risk of stunting in the period, and dividing this difference by the fi rst value would provide an esti-mate of relative variation. The premise necessary for the validity of such estimates would be that the association between the explanatory variables and nutritional status remained constant between 1996 and 2007.
A second alternative to estimate the joint effect of changes in the distribution of determinants, analogous to the preceding estimation, would be to compare predicted values for the mean probability of stunting when the 2007 model is applied, successively, to data from PNDS 2007 itself and then to data from PNDS 1996. In this case, there would also be an implicit as-sumption of lack of change in the association between explanatory variables and risk of stunting in the two surveys. There are two options if one wants to avoid such an assumption.6 The simplest of the two, which
is the one employed in the present analysis, consists in adopting the mean value of effects estimated based on each of the models. The other option, which we did not consider due to its greater complexity, would be to estimate the effect of changes in the distribution of determinants employing a unique multiple regression model constructed by merging the databases of the two surveys, thus allowing for interactions between each determinant and year of survey.
where RR96i and RR07i represent, respectively, the adjusted relative risk of stunting for the ith combination
between the categories of the four determinants of nutritional status in 1996 and 2007 and P96i and P06i represent the proportion of children found in each ith
combination, respectively, in PNDS1996 and in a hypo-thetical distribution constructed by fi xing the marginal distribution of the determinant of interest as observed in PNDS 2007 and the marginal distribution of the other determinants as observed in PNDS 1996. Note that there are 144 possible combinations (I) between the categories of the four studied determinants, and that the equation above resorts again to considering the mean of effects obtained considering, successively, the risk models for 1996 and 2007.
The generalized attributable fraction calculated us-ing this equation allows us to estimate the effect on prevalence of stunting that would be expected given the changes in distribution of each of the four deter-minants analyzed. However, the effects thus calculated for each determinant are not additive, and tend to total more than the previously calculated joint effect of simultaneous changes in all four determinants. This imperfect decomposition of the joint effect originates from the artifi cial assumption that the change in each determinant precedes changes in the other three. In order to avoid this limitation, it is necessary to resort to the concepts of “sequential attributable fraction” and partial attributable fraction.”5 The concept of
“sequen-tial attributable fraction” assumes that, when multiple risk factors are present, each of these factors contains 2n-1 different values for the attributable fraction, where
n is the number of exposure variables (the different at-tributable fraction values are a function of the number of possible combinations given the order of removal of each risk factor). The mean of the 2n-1 attributable
fraction values calculated for each risk factor is the “partial attributable fraction” of each factor, and the sum of these will coincide with the attributable fraction calculated for the entire set of risk factors.5
fraction” consists, in essence, of an extension of the concept of “populational attributable fraction” for settings in which there are changes in the distribution, rather than necessarily elimination, of one or more risk factors. Given the strong correlation between the factors at hand, we used adjusted estimates of the generalized attributable fraction.2
The equation presented below estimates the generalized attributable fraction (F) associated to change in the distribution of each of the determinants of nutritional status analyzed:
For each of our four exposure variables, we calculated sequential attributable fraction values obtained with the modifi cation of the variable’s marginal distribution (be-tween 1996 and 2007), based on four scenarios: 1) prior to change in the distribution of the other three variables; 2) after change in the distribution of each the other three variables, one by one; 3) after change in the distribu-tion of pairs of other three variables, two by two; and 4) after change in the marginal distribution of all three remaining variables. The mean value obtained for each variable in these four scenarios is termed the “partial
attributable fraction” for each variable, i.e., its effect on the temporal variation in prevalence of stunting.
All statistical analyses in the present study were per-formed with the aid of Stata software, version 10. All analyses took into account the individual weighting fac-tors of each survey as well as the effect of the complex sampling strategy on the standard error of estimates.
RESULTS
Table 1 presents estimates for the prevalence of an-thropometric defi cits in the Brazilian population under fi ve years of age in 1996 and 2007. Prevalence of child stunting fell by half in the period (from 13.5% to 6.8%), which corresponds to an annual decrease rate of 6.3%. The proportion of wasted children , which was already low at the baseline, also showed a slight reduction in the period, from 2.1% to 1.6%.
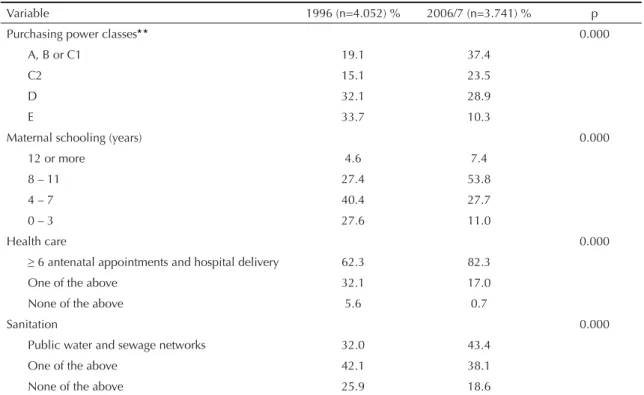
Table 2 describes the evolution of the distribution of the underfi ve population according to four potential determinants of nutritional status. In all cases, distribu-tions observed in 2007 were more favorable than those found in 1996. For example, the proportion of children in the highest purchasing power classes (A, B, or C1) and of children born to mothers with at least eight years of schooling both doubled in the period (from 19.1% to 37.4% and from 32% to 61.2%, respectively). Though smaller in magnitude, there were also increases in the proportion of children with access to antenatal and delivery care (from 62.3% to 82.3%) and in the proportion of children living in homes which were connected to the public water supply and sanitation networks (from 32% to 43.4%).
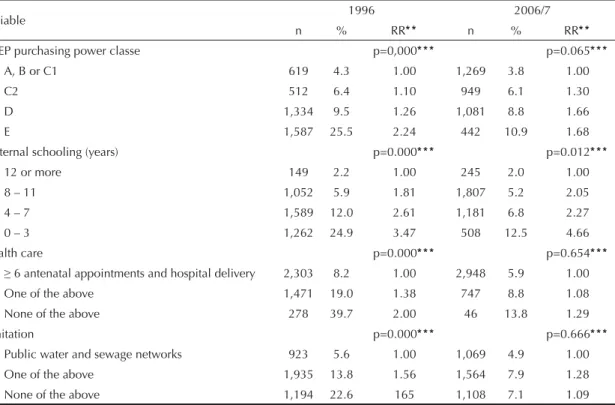
and with less access to health care and sanitation. Ad-justed analysis for both years showed a strong inverse correlation, with a dose-response effect, between ma-ternal schooling and child stunting. The same analysis confi rms the inverse relationship between stunting and family purchasing power and access to health care and sanitation in 1996, but shows also a weakening of this relationship in 2007.
Table 4 compares predicted values for the mean prob-ability of stunting when multiple regression models adjusted for each of the two surveys are applied,
successively, to the database of the survey that gener-ated the model and to the database of the other survey. As expected, probabilities predicted based on risk mod-els and distributions considered for the same survey are very close to the prevalence of stunting observed in that survey. The small differences between these values are due to the exclusion, in both surveys, of children for whom not all data necessary for modeling was available. Most importantly, however, replacing the 1996 distribution (database) with the 2007 distribution (database) determines substantial absolute reductions in mean probability of stunting: 0.134 – 0.074 = 0.060, when the 1996 risk model is considered, or 0.092 – 0.065 = 0.027, when the 2007 risk model is considered. The mean of these two reductions in the prevalence of stunting – 0.0435, considered in the present analysis as indicative of the joint effect of favorable evolution in the four determinants of nutritional status – represents roughly one-third (32.4%) of the mean probability of stunting in 1995 (0.134), or almost two-thirds (63.0%) of the reduction effectively observed in the 1996-2006 period (0.134 – 0.065 = 0.069).
The decomposition of the joint effect into partial effects, which is based on calculating “partial attributable fractions,” showed that improvements in purchasing power, maternal schooling, health care, and sanitation led to relative reductions in the prevalence of stunting of Table 1. Prevalence (%) of under-nutrition among Brazilian
children under fi ve years of age according to two
anthropo-metric indicators. Brazil,* 1996 and 2006/7.
Indicador 1996 2006/7
anthropometric n %
(IC 95%) n
% (IC 95%)
HAZ < -2 4,132 13.5
(12.1;14.8) 4,034
6.8 (5.4;8.3)
WHZ < -2 4,061 2,1
(1.6;2.6) 4,002
1,6 (0.9;2.3) HAZ and WHZ: height-for-age and weight-for-age z scores, calculated based on World Health Organization reference
curves19
* Excluding the rural North.
Table 2. Distribution of children under fi ve years according to family purchasing power, maternal schooling, access to health
care, and sanitation conditions. Brazil,* 1996 and 2006/7.
Variable 1996 (n=4.052) % 2006/7 (n=3.741) % p
Purchasing power classes* * 0.000
A, B or C1 19.1 37.4
C2 15.1 23.5
D 32.1 28.9
E 33.7 10.3
Maternal schooling (years) 0.000
12 or more 4.6 7.4
8 – 11 27.4 53.8
4 – 7 40.4 27.7
0 – 3 27.6 11.0
Health care 0.000
≥ 6 antenatal appointments and hospital delivery 62.3 82.3
One of the above 32.1 17.0
None of the above 5.6 0.7
Sanitation 0.000
Public water and sewage networks 32.0 43.4
One of the above 42.1 38.1
None of the above 25.9 18.6
* Excluding the rural North.
* * According to the criteria of the Associação Brasileira de Empresas de Pesquisas. Adoção do CCEB 2008: Critério de
11.1%, 13.2%, 5.9%, and 2.2%, respectively. It should be noted that the sum of these reductions corresponds exactly to the 32.8% reduction estimated previously for the joint effect associated with favorable evolution of the four determinants, or to about two-thirds of the reduction measured in the period. The fi gure describes the relative participation of each determinant in the total decrease in prevalence of stunting observed in Brazil between 1996 and 2007, indicating that improvement in maternal schooling (25.7%) and in family purchas-ing power (21.7%) would account for almost half this reduction, another 15% being attributed to expanded health care (11.6%) and sanitation (4.3%).
DISCUSSION
Based on a comparison of two nation-wide probabilistic surveys carried out approximately 11 years apart (1996 and 2006/7), the present study has shown evidence of a reduction of approximately 50% in prevalence of child stunting in Brazil. Taking into account the association, in each of these years, between determinants of nutri-tional status and stunting, and also the evolution of these determinants across the period, we were able to attribute roughly two-thirds of this decline to improvements in – by order of importance – maternal schooling, family purchasing power (especially among the poorest), ac-cess to health care, and sanitation conditions.
The probabilistic nature of the two surveys, their comparability in terms of procedures for data collec-tion and analysis of anthropometric data, and the use of comprehensive indicators for evaluating nutritional status (defi cits in height-for-age and weight-for-age) speak in favor of the internal and external validity of results pertaining to temporal variation in prevalence of under-nutrition. With regards to identifying the Table 3. Prevalence (%) and relative risk of stunting among children under fi ve years according to family purchasing power,
maternal schooling, access to health care, and sanitation conditions. Brazil,* 1996 and 2006/7.
Variable 1996 2006/7
n % RR* * n % RR* *
ABEP purchasing power classe p=0,000* * * p=0.065* * *
A, B or C1 619 4.3 1.00 1,269 3.8 1.00
C2 512 6.4 1.10 949 6.1 1.30
D 1,334 9.5 1.26 1,081 8.8 1.66
E 1,587 25.5 2.24 442 10.9 1.68
Maternal schooling (years) p=0.000* * * p=0.012* * *
12 or more 149 2.2 1.00 245 2.0 1.00
8 – 11 1,052 5.9 1.81 1,807 5.2 2.05
4 – 7 1,589 12.0 2.61 1,181 6.8 2.27
0 – 3 1,262 24.9 3.47 508 12.5 4.66
Health care p=0.000* * * p=0.654* * *
≥ 6 antenatal appointments and hospital delivery 2,303 8.2 1.00 2,948 5.9 1.00
One of the above 1,471 19.0 1.38 747 8.8 1.08
None of the above 278 39.7 2.00 46 13.8 1.29
Sanitation p=0.000* * * p=0.666* * *
Public water and sewage networks 923 5.6 1.00 1,069 4.9 1.00
One of the above 1,935 13.8 1.56 1,564 7.9 1.28
None of the above 1,194 22.6 165 1,108 7.1 1.09
* Excluding the rural North.
* * RR: Relative risk of stunting adjusted for the remaining variables in the table by Poisson multiple regression.
* * * Wald’s test for linear trend.
Table 4. Probability of child stunting predicted based on two multiple regression models and two scenarios for the distribution of the explanatory variables included in the
models.* Brazil,* * 1996 and 2006/7.
Model Population
distribution
Probability of stunting (95%CI)
1996 1996 0.134 (0.128;0.141)
1996 2007 0.074 (0.070;0.078)
2007 2007 0.065 (0.062;0.068)
2007 1996 0.092 (0.090;0.096)
* Poisson regression models having as a dependent variable
the presence of height-for-age defi cit (0=no; 1=yes) and as explanatory variables family purchasing power, maternal schooling, access to health care, and sanitation conditions (as expressed in Tables 2 and 3). The 1996 and 2007 denominations refer to the year of the survey upon which models were constructed and from which distributions were extracted.
causes behind this variation, we consider the following as strengths of the present analysis: 1) the use of the same databases for quantifying risk of stunting associ-ated with the determinants studied and for determining the evolution in the distribution of these determinants with time; 2) the use of multiple regression models that quantify the independent association between each determinant and nutritional status at the beginning and end of the period; and 3) the use of non-biased estimates of the fraction of the decline attributable to the set of determinants investigated and the perfect decomposi-tion of this fracdecomposi-tion into specifi c components.
Substantial declines in prevalence of child under-nutrition have been documented previously in Brazil based on comparisons of nation-wide surveys carried out during the second half of the Twentieth Century.8,9
Such declines corresponded to a mean rate of decline in prevalence of stunting of 5.0% per year between 1975 and 1989 and of 5.7% per year between 1989 and 1996. The approximately 6.3% per year reduction found in the present analysis therefore represents an intensifi cation of the secular declining trend in child under-nutrition in Brazil. The recent evolution in the growth of Brazilian children indicates that the United Nations’ Millennium Development Goal for child under-nutrition (reducing it by half between 1990 and 2015) will be widely exceeded in Brazil.15
Factors responsible for the decline in child stunting in the time interval delimited by the surveys carried out in Brazil since 1975 are not immediately comparable due to the different analytical strategies used in their identifi cation and in the unequal availability of data for
the corresponding periods. Be as it may, the decline in under-nutrition between 1975 and 1989 was attributed essentially to moderate gains in family income and to the exceptional expansion in the coverage of public educa-tion, sanitaeduca-tion, and health care services.8 Improvements
in maternal schooling, greater access to primary health care, and expansion of the public water supply network were considered as the factors most relevant factors to the decline in under-nutrition between 1989 and 1996, increases in family income again playing a modest role in this decline.9 Thus, the decline in child under-nutrition
observed in 1996-2007 apparently distinguishes itself from declines observed in previous periods by being the result of the combined effect of a strong increase in family purchasing power and of an intense expansion in population access to essential public services.
The increase in purchasing power of Brazilian families between 1996 and 2007, particularly in classes with lower purchasing power, is consistent with estimates based on the National Household Surveys [Pesquisas Nacionais sobre Amostragem de Domicílios – PNAD], which indicate nation-wide improvements in income distribution and the reduction in the proportion of the population living below the poverty line, especially from 2003 onwards.11 According to scholars in the fi eld,
the recent trend towards improved income distribution and reduced poverty in Brazil would be a consequence of the reactivation of economic growth and of conse-quent reductions in unemployment, increases in mini-mum wage beyond infl ation, and marked expansion of the coverage of income transfer programs.11
The favorable evolution in maternal schooling between 1996 and 2007, the single factor that contributed the most to the decline in child undernutrition in the period, refl ects the virtual universalization of access to elementary education and the improvement in its quality indicators taken place in Brazil throughout the 1990s.4 It should be noted that most mothers of children
studied in 2007 either attended elementary school or were of elementary school age in the 1990s, whereas for most mothers studied in 1996, the reference period for elementary education was in the 1980s. The expansion in access of mothers and children to health care, on the other hand, coincides with the expansion in the country of the Family Health Program [Programa de Saúde da Família – PSF], whose aims emphasize prevention and education, as well as the promotion of equity in service supply.13 In 1998, 3,062 PSF teams were present in
roughly one-fi fth of Brazilian municipalities, provid-ing coverage to approximately ten million people; in 2006, 26,729 teams were present in over 90% of municipalities, covering 86 million people.a The slight
improvement in the sanitation conditions of the homes of Brazilian children is consistent with the relatively slow expansion of coverage of sewage disposal and water supply networks in Brazil. Between 2001 and Figure. Relative participation (%) of different factors in the
decrease in prevalence of child stunting between 1996 and
2007. Brazil.*
* Excluding the rural North.
Purchansing power 21.7%
Maternal schooling 25.7% Health
care 11.6% Sanitation
4.3% Other Factors 36.7%
1. Barros AJ, Hirakata VN. Alternatives for logistic regression in cross-sectional studies: an empirical comparison of models that directly estimate the
prevalence ratio. BMC Med Res Methodol. 2003;3:21.
DOI: 10.1186/1471-2288-3-21
2. Benichou J. A review of adjusted estimators of
attributable risk. Stat Methods Med Res.
2001;10(3):195-216. DOI: 10.1191/096228001680195157
3. Black RE, Allen LH, Bhutta ZA, Caulfi eld LE, de Onis M, Ezzati M, et al. Maternal and child undernutrition: global and regional exposures and health
consequences. Lancet. 2008;371(9608):243-60. DOI:
10.1016/S0140-6736(07)61690-0
4. Draibe S. A política social no período de FHC
e o sistema de proteção social. Tempo Social.
2003;15(2):63-101. DOI: 10.1590/S0103-20702003000200004
5. Eide GE, Gefeller O. Sequential and average attributable fractions as Aids in the selection of
preventive strategies. J Clin Epidemiol.
1995;48(5):645-55. DOI: 10.1016/0895-4356(94)00161-I
6. Grummer-Strawn LM. The effect of changes in population characteristics on breastfeeding trends
in fi fteen developing countries. Int J Epidemiol.
1996;25(1):94-102. DOI: 10.1093/ije/25.1.94
7. Mei Z, Grummer-Strawn LM. Standard deviation of anthropometric Z-scores as a data quality assessment tool using the 2006 WHO growth standards: a
cross country analysis. Bull World Health Organ.
2007;85(6):441-8. DOI: 10.2471/BLT.06.034421
8. Monteiro CA, Benicio MHD’A, Iunes RF, Gouveia NC, Taddei JA, Cardoso MA. Nutritional status of Brazilian
children: trends from 1975 to 1989. Bull World Health
Organ. 1992;70(5):657-66.
9. Monteiro CA, Benicio MHD’A, Freitas ICM. Evolução da mortalidade infantil e do retardo de crescimento nos anos 90: causas e impacto sobre desigualdades
regionais. In: Monteiro CA, organizardor. Velhos e novos males da saúde no Brasil: a evolução do país e de suas doenças. 2. ed. São Paulo: Hucitec/Nupens-USP; 2000. p.393-420.
10. Monteiro CA, Conde WL, Popkin BM. Is obesity replacing or adding to under-nutrition ? Evidence from
different social classes in Brazil. Public Health Nutr.
2002;5(1A):105-12. DOI: 10.1079/PHN2001281
11. Neri MC, coordenador. Miséria, desigualdade e políticas de renda: o Real do Lula. Rio de Janeiro: FGV/IBRE/CPS; 2007.
12. Neri MC, coordenador. Trata Brasil: saneamento e saúde. Rio de Janeiro: FGV/IBRE/CPS; 2007.
13. Santana ML, Carmagnani MI. Programa de saúde da família no Brasil: um enfoque sobre seus pressupostos
básicos, operacionalização e vantagens. Saude Soc.
2001;10(1):33-54.
14. UNICEF Policy Review. Strategy for improved nutrition of children and women in developing countries. New York; 1990. (Policy review paper, E/CEF/1990/1.6).
15. United Nations. The millennium development goals report 2007. New York; 2007.
16. Victora CG, Adair L, Fall C, Hallal PC, Martorell R, Richter L, et al. Maternal and child undernutrition: consequences for adult health and human capital.
Lancet. 2008;371(9609):340-57. DOI: 10.1016/S0140-6736(07)61692-4
17. World Health Organization. Physical status: the use and interpretation of anthropometry. Geneva; 1995. (Report of a WHO Expert Committee. Technical report series, 854).
18. World Health Organization. WHO child growth standards: length/height-for-age, for-age, weight-for-lenght, weight-for-height and body mass index-for-age: methods ad development. Geneva; 2006.
REFERENCES
Research fi nanced by the Brazilian Ministry of Health (Grant MS/CEAP no. 134/2006).
Lima ALL was supported by Fundação de Amparo à Pesquisa do Estado de São Paulo (FAPESP –postdoctoral fellowship; Process FAPESP no. 06/55316-9).
2006, coverage of the sewage network increased from 81.1% to 83.2%.a Scholars in Brazilian social policies
have drawn attention to the lesser visibility and politi-cal attractiveness of investments in sanitation, as well as to the need to prioritize this issue in the Brazilian public policy agenda.12
Finally, it is worthy of note that, if the 6.3% annual decline rate in prevalence of stunting is maintained, the proportion of Brazilian children with height-for-age defi cits would drop below 3% in a little over ten years,
which would mean reaching the (genetically) expected proportion of children of low stature under optimal conditions of diet, health, and nutrition across the entire population.18 However, in order to achieve this goal in
another ten years – or preferably even earlier – it will be necessary to maintain or even intensify the initiatives that have fostered the increase in purchasing power among the poor, and, not less importantly, to ensure public investments that allow for the completion of universal-ization of access to essential services such as education, health, and sanitation among the Brazilian population.