BAR, Curitiba, v. 8, n. 1, art. 3, pp. 37-47, Jan./Mar. 2011
Estimating Total Claim Size in the Auto Insurance Industry: a
Comparison between Tweedie and Zero-Adjusted Inverse
Gaussian Distribution
Adriana Bruscato Bortoluzzo * E-mail address: [email protected] Ibmec São Paulo São Paulo, SP, Brazil.
Danny Pimentel Claro E-mail address: [email protected] Ibmec São Paulo São Paulo, SP, Brazil.
Marco Antonio Leonel Caetano E-mail address: [email protected] Ibmec São Paulo São Paulo, SP, Brazil.
Rinaldo Artes E-mail address: [email protected] Ibmec São Paulo São Paulo, SP, Brazil.
* Corresponding author: Adriana Bruscato Bortoluzzo Rua Quatá, 300, São Paulo, SP, 04546-042, Brazil.
Abstract
The objective of this article is to estimate insurance claims from an auto dataset using the Tweedie and zero-adjusted inverse Gaussian (ZAIG) methods. We identify factors that influence claim size and probability, and compare the results of these methods which both forecast outcomes accurately. Vehicle characteristics like territory, age, origin and type distinctly influence claim size and probability. This distinct impact is not always present in the Tweedie estimated model. Auto insurers should consider estimating total claim size using both the Tweedie and ZAIG methods. This allows for an estimation of confidence interval based on empirical quantiles using bootstrap simulation. Furthermore, the fitted models may be useful in developing a strategy to obtain premium pricing.
Introduction
There is a well known problem in the insurance industry concerning the proper pricing of an insurance policy. An insurance company’s pure premium for an insured individual is made up of two components: claim probability and expected claim size. The claim probability for any individual is related to the number of claims expected to occur in a given year. The claim size is simply the dollar cost associated with each claim. The difficulty of estimating the size and probability of claims in the insurance industry has been extensively reported in the literature (e.g. Jong & Heller, 2008). In the past, the main difficulty was related to the credibility of the insurance company datasets (Weisberg & Tomberlin, 1982). Insurance datasets were typically very large, containing from tens of thousands to millions of cases. Problems such as missing values and inconsistent or invalid records arose. As current information technology systems have become more sophisticated over the years, the processing of information has become more credible than ever before.
The challenge then is to employ a proper statistical technique to analyze insurance data. Claims and risks have long been estimated using a pure algorithmic technique or a simple stochastic technique (Wüthrich & Merz, 2008). These methods result in poor estimations. Huang, Zhao and Tang (2009) consider a risk model in which the claim number process is treated as a Poisson model and the individual claim size is assumed to be a fuzzy random variable. Jørgensen and Souza (1994) suggested a Poisson sum of Gamma random variables called Tweedie to estimate insurance risk. According to Smyth and Jørgensen (2002), there is also another problem in that the proposed Tweedie model does not permit the separate estimation of probability and claim size.
Recent studies have perceived that a zero-adjusted Inverse Gaussian (ZAIG) distribution may be appropriate to estimate claim and risk in insurance data (Heller, Stasinopoulos, & Rigby, 2006). A mixed discrete-continuous model, with a probability mass of zero and an Inverse Gaussian continuous component, appears to estimate accurately in extreme right skewness distributions. This suggests that probabilities can be calculated from datasets with a large number of zero claims. The ZAIG model explicitly specifies a logit-linear model for the occurrence of a claim (i.e. claim probability). When a claim has been made, the ZAIG model also specifies log-linear models for the mean claim size and the dispersion of claim sizes. It is important to measure the probability and size of claims separately because it is possible for the probability to depend on a set of independent variables which is different from those that influence claim size.Therefore, ZAIG estimation appears to be more appropriate for estimating the price of insurance policies.
Once an estimation method has been defined, the challenge is to identify potential explanatory variables. Typically, policy holders are divided into discrete classes on the basis of certain measurable characteristics predictive of their propensity to generate losses. We evaluate claims by considering vehicle variables that are frequently used in the literature. In addition to territory, claims have also been studied in relation to the car manufacturer and vehicle’s characteristics: age, type and origin. Based on previous research, all of these variables must be used in the estimation.
Our objective is to present the ZAIG method of estimation to determine probability claims and the expected claim size in the insurance industry and to formally test the results with an estimation based on a Tweedie regression model using an insurance dataset. Insurance data were collected to analyze the impact of factors estimated by the Tweedie and ZAIG methods.
Theoretical Background
Insurance: importance of predictions and predictors
The probability and claim size forecast is very important, since an insurance company can use these estimates to offer or not offer premium discounts depending on an individual client’s characteristics or create strategies for detecting fraudulent claims (Viaene, Ayuso, Guillen, Van Gheel, & Dedene, 2007). An insurance company can also estimate total claim size using vehicles characteristics to get an idea of how much will be spent on the claim over a certain period and for a specific client portfolio. Insurance companies are constantly looking for ways to better predict claims. Overall, insurance involves the sum of a large number of individual risks of which very few will result in insurance claims being made. Meulbroek (2001) argues that insurance companies need to treat risk management as a series of related factors and events. Boland (2007) suggests that, in order to handle claims arising from incidents that have already occurred, insurers must employ predictive methods to deal with the extent of this liability. Therefore, an insurance company has to find ways to predict claims and appropriately charge a premium to cover this risk.
The prediction problem has to be considered in the light of competitive market insurance (Weisberg, Tomberlin, & Chartterjee, 1984). It is possible for an insurer to benefit at least temporarily by identifying segments of the market that are currently being overcharged and offering coverage at lower rates or by avoiding segments that are being undercharged (Doherty, 1981). Regulators are usually concerned about the possibility of rate structures that severely penalize individuals with some characteristics (e.g. where they live, model of vehicle). Therefore, insurers look for better ways to capture the characteristics of individuals that affect claim size and probability, and consequently identify insured drivers that have a higher propensity for generating losses.
Insurance companies attempt to estimate reasonable prices for insurance policies based on the losses reported for certain kinds of policy holders. This estimate has to consider past data in order to grasp the trends that have occurred (Weisberg & Tomberlin, 1982). Information available to predict the price for a period in the future usually consists of the claim experience for a population or a large sample from the population over a period in the past. Accurate estimation may consider a large number of exposures in a dataset and a stable claim generation process over time.
The predictors for estimating the appropriate price for insurance policies were selected from the automobile industry. In our study, we consider the issue of price prediction in the context of the automobile industry because the most sophisticated proposals have been developed in this industry (Jong & Heller, 2008). Previous research in the automobile setting has used predictors such as territory (e.g. Chang & Fairley, 1979) and car manufacturer (e.g. Heller et al., 2006). Weisberg et al. (1984) suggest including variables associated with the status of the vehicle such as age, type and origin.
Previous studies have recognized the utility of the Tweedie method in estimating auto insurance claims (Smyth & Jørgensen, 2002) and recent studies have shown that the ZAIG method may produce accurate models of estimation (Heller et al., 2006). In order to estimate, it is necessary to let yibe the size expended on claims for client i and to let xi be a vector of independent variables related to this client. One may represent the variable yi as
⎩ ⎨ ⎧ =
y π probabilit with
, W
) π -(1 y probabilit with
0, y
i i
i i
It is important to note that a claim is, in general, a rare event. A small proportion of claims in a sample may lead to problems in predicting claim occurrence by a logistic model because, in this case, the predicted probabilities tend to be small. King and Zeng (2001) proposed a correction to be used in these situations. They used the fact that, in the presence of rare events, the independent variable coefficients are consistent, but the intercept may not be.
Tweedie regression models
A Tweedie distribution (Jørgensen, 1987, 1997) is a member of the class of exponential dispersion models. It is defined as a distribution of the exponential family (e.g. Jong & Heller, 2008) with mean μ and variance φ μ p; in this work, as in Jørgensen and Souza (1994) and Smyth and Jørgensen (2002), we consider the case 1<p<2. It is possible to write
⎩ ⎨ ⎧ > = = 0 N if , W 0 N if 0, y i i i
i ,
∑
= = Ni
i j
ij
i X
W , (1)
where Ni is a Poisson random variable that represents the number of claims that have occurred for the client i and
i iN
i
X
X
1,
L
,
are independent identically distributed Gamma random variables (continuous variables). As a consequence Wi also follows a Gamma distribution, which has a positive and right skewed density probability function. In this work, we use a log-linear Tweedie regression model, given by x i T ie
=
,
where xi is a matrix of independent variables and γ is the parametric vector.
ZAIG regression model
The variable yi follows a ZAIG distribution (Heller et al., 2006) if Wi is a Gaussian inverse random variable. The Gaussian inverse is a positive and highly skewed distribution with two parameters: the mean (μi) and a dispersion parameter (λi). It may be proved that
i i i
)
π
E(y
=
and(
2)
i i i 2 i i
i) π 1 π
Var(y = − + .
In the context of this work, μi is the expected claim size and λi is a parameter related to claim size dispersion. It is possible to propose regression models for πi, μi and λi as
( )
xh
π T
i 1
i= , h
( )
z T i 2i= ,
h
( )
w
δ
T i 3i
=
,where h1, h2 and h2 are continuous twice differentiable invertible functions, β, γ and δ are parametric vectors, and xi, ziand wi are vectors of independent variables for client i.
The following models are adjusted:
x x
i T
i T i
e
1
e
π
+
=
, i=
e
xTi and x δi
T i
e
=
.(2)
In short, this modeling option assures that μi and λiare, as expected, always positive and that πi is modeled as a logistic regression. It is important to remember the bad performance of logistic models in predicting claims, when the frequency of claims in the sample is small.
Results and Discussion
Dataset and sample summary statistics
A sample was collected from a major automobile insurance company resulting in a dataset of 32,783 passenger vehicle records belonging to a corporate fleet. As all corporation employees could drive the vehicle, it makes no sense to use individual driver characteristics as explanatory variables for explaining probability and claim size.
The dataset was processed to remove missing values and generate a selection of relevant variables. We have focused the analysis on yearly claims involving robbery or accidents with claim sizes which were greater than the vehicle’s value. Claim size refers to the dollar cost paid as a liability of a claim. Claim probability refers to the percentage of claims over the period of a year. The average annual claim probability is 1.17%, and the average claim size is $243.98. When the event occurs, the average claim size increases to $21,048.03.
For every insurance policy holder, twenty explanatory variables were employed. The variables correspond to vehicle characteristics and are coded by means of binary variables, as described in Table 1. Table 2 shows the descriptive statistics of the variables.
Table 1
List of Explanatory Variables
Variable Description
Vehicle Age (II) Equals 1 if the insured vehicle is one or two years old (in relation to contract year), otherwise 0
Vehicle Age (III) Equals 1 if the insured vehicle is three or four years old (in relation to contract year), otherwise 0
Vehicle Age (IV) Equals 1 if the insured vehicle is five or six years old (in relation to contract year), otherwise 0
Vehicle Age (V) Equals 1 if the insured vehicle is seven to nine years old (in relation to contract year), otherwise 0
Vehicle Age (VI) Equals 1 if the insured vehicle is ten or more years old (in relation to contract year), otherwise 0
Origin Equals 1 if the insured vehicle is imported and 0 if it is domestic
Model/Manufac. A combination of different models and manufacturers in the dataset. Groups were assigned on the basis of a CHAID analysis.
Territory Clusters of territory were assigned based on Hierarchical Cluster Analysis Method for claim size. It divides the region into a set of exclusive areas thought to be relatively homogeneous in terms of claims. Vehicles are assigned to territories according to where they were usually garaged.
Table 1 (continued)
Variable Description
Vehicle Type (II) Equals 1 for a midsize vehicle, otherwise 0 Vehicle Type (III) Equals 1 for a luxury vehicle, otherwise 0
Intercept New Vehicle (zero years old in relation to contract year - Vehicle’s Age (I)), Domestic, Model/Manufacturer (I), Territory (I) and small vehicle (Vehicle Type (I))
Table 2
Descriptive Statistics for Proportion of Claims and for Claim Size
Variable Value Percentage of Claim
Claim size
Sample Size Total Sample Claim Size>0
Mean SD Mean SD
Vehicle Age
I 0.94 307.44 3,522.98 32,795.57 16,171.44 8,854 II 1.08 246.91 2,719.76 23,072.27 12,883.00 10,559 III 1.12 208.37 2,173.75 18,807.96 8,813.48 6,589 IV 1.10 160.62 1,691.55 14,660.81 7,063.96 3,286 V 2.12 226.53 1,642.89 10,672.59 3,990.81 2,497 VI 2.20 203.04 1,494.61 9,210.65 4,374.82 998 Origin Domestic 1.20 252.60 2,748.35 21,098.32 13,842.19 30,320 Imported 1.11 137.86 1,857.72 19,974.17 10,491.21 2,463 Model/Manuf.
I 1.69 332.55 2,899.69 19,749.50 10,790.52 11,462 II 1.27 628.48 6,015.09 49,380.62 21,589.70 1,100 III 0.38 73.89 1,319.75 19,644.96 9,559.60 1,861 IV 1.11 155.25 1,659.29 14,244.86 7,255.25 6,331 V 2.48 374.20 2,997.42 15,092.71 12,335.49 484 VI 0.82 263.54 3,630.81 32,256.95 26,900.88 612 VII 0.53 92.36 1,361.69 17,497.01 7,007.88 3,789 VIII 0.73 148.82 2,189.99 20,401.90 16,009.04 2,879 IX 1.37 430.87 4,094.29 31,547.34 16,003.95 1,684 X 0.62 204.76 2,697.10 33,030.77 9,728.11 2,581 Territory I 2.07 502.80 4,213.33 24,259.88 16,871.42 2,895 II 1.08 218.91 2,494.36 20,445.81 12,964.14 29,888 Vehicle Type Small 1.22 184.61 1,860.49 15,351.51 7,435.96 15,218 Midsize 1.45 371.67 3,554.41 25,586.44 15,029.12 11,290 Luxury 0.53 158.21 2,586.10 30,083.29 19,567.01 6,275 Complete Sample 1.17 243.98 2,691.84 21,048.03 13,700.82 32,783
depending on the model and the manufacturer (Model/Manuf). Region I has the largest percentage of claims as well as the highest cost for these claims. In terms of vehicle size, most of the claims are for small and midsize cars, while the costs increase in percentage according to the size of the vehicle.
Inferential analysis
The ZAIG model was estimated by the GAMLSS package (Stasinopoulos & Rigby, 2007; Stasinopoulos, Rigby, & Akantziliotou, 2008) for the R system (R Development Core Team, 2007). The Tweedie model was estimated using the SPSS package (version 16.0). In this section we divide the sample into two parts: a subsample of 22,783 to fit the models, and a subsample of 10,000 to forecast the total claim size.
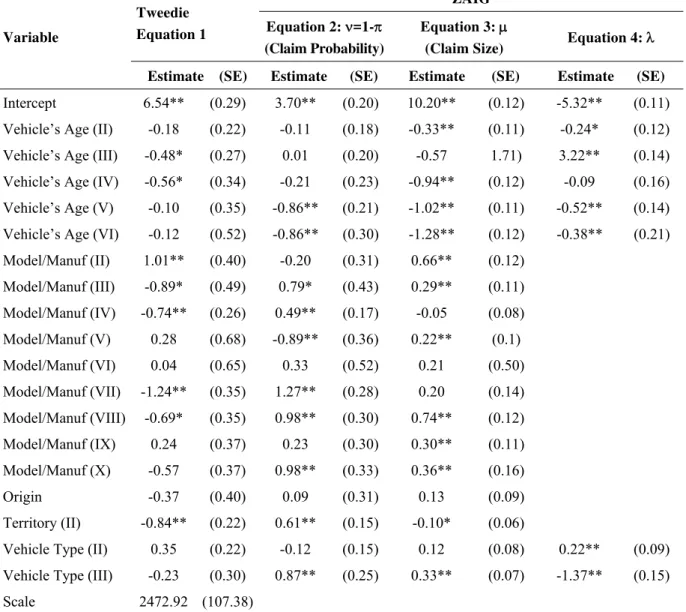
Table 3 shows the results of the estimates. The dependent variable is the claim size and refers to robberies or accidents with repair sizes greater than the vehicle’s value.
Table 3
Tweedie and ZAIG Model Results
Variable
Tweedie
Equation 1
ZAIG
Equation 2: ν=1-π
(Claim Probability)
Equation 3: μ
(Claim Size) Equation 4: λ
Estimate (SE) Estimate (SE) Estimate (SE) Estimate (SE)
Intercept 6.54** (0.29) 3.70** (0.20) 10.20** (0.12) -5.32** (0.11) Vehicle’s Age (II) -0.18 (0.22) -0.11 (0.18) -0.33** (0.11) -0.24* (0.12) Vehicle’s Age (III) -0.48* (0.27) 0.01 (0.20) -0.57 1.71) 3.22** (0.14) Vehicle’s Age (IV) -0.56* (0.34) -0.21 (0.23) -0.94** (0.12) -0.09 (0.16) Vehicle’s Age (V) -0.10 (0.35) -0.86** (0.21) -1.02** (0.11) -0.52** (0.14) Vehicle’s Age (VI) -0.12 (0.52) -0.86** (0.30) -1.28** (0.12) -0.38** (0.21) Model/Manuf (II) 1.01** (0.40) -0.20 (0.31) 0.66** (0.12)
Model/Manuf (III) -0.89* (0.49) 0.79* (0.43) 0.29** (0.11) Model/Manuf (IV) -0.74** (0.26) 0.49** (0.17) -0.05 (0.08) Model/Manuf (V) 0.28 (0.68) -0.89** (0.36) 0.22** (0.1) Model/Manuf (VI) 0.04 (0.65) 0.33 (0.52) 0.21 (0.50) Model/Manuf (VII) -1.24** (0.35) 1.27** (0.28) 0.20 (0.14) Model/Manuf (VIII) -0.69* (0.35) 0.98** (0.30) 0.74** (0.12) Model/Manuf (IX) 0.24 (0.37) 0.23 (0.30) 0.30** (0.11) Model/Manuf (X) -0.57 (0.37) 0.98** (0.33) 0.36** (0.16)
Origin -0.37 (0.40) 0.09 (0.31) 0.13 (0.09)
Territory (II) -0.84** (0.22) 0.61** (0.15) -0.10* (0.06)
Vehicle Type (II) 0.35 (0.22) -0.12 (0.15) 0.12 (0.08) 0.22** (0.09) Vehicle Type (III) -0.23 (0.30) 0.87** (0.25) 0.33** (0.07) -1.37** (0.15)
Scale 2472.92 (107.38)
Several explanatory variables were significantly related to dependent variables. Considering all vehicle age variables, we can say that there is a significant increase in the expected claim probability as the vehicle becomes older. On the other hand, the expected claim size decreases for older vehicles. This is in line with intuition and descriptive analysis, because old vehicles are less expensive to replace and there is also the fact that old vehicles are more attractive targets. One might suggest that old vehicles are more attractive targets because there is a great auto part replacement market that gets flooded with stolen parts for these old cars. Older cars also tend to be poorly maintained, and this increases the probability of accidents.
The variable model/manufacturer is related to claim probability and size. In general, the model/manufacturer is more closely related to claim probability than claim size. It is noteworthy that there is no way of clearly identifying whether claim size or probability is causing the significance of the Tweedie coefficients.
The variable for vehicle origin does not influence the claim probability or size. This suggests,
ceteris paribus, that domestic and imported vehicles tend to have the same claim size. Territory is
generally related to claim probability and size; in this case there are some regions that have more carjackings than others.
Vehicle type is related to claim size and probability. The claim probability decreases for luxury vehicles. However luxury cars lead to higher claim sizes compared to small and midsize cars. Looking at the Tweedie results, the difficulty in accurately predicting claims becomes obvious given the non-significance of the Tweedie coefficient for vehicle type. One might suggest that the non-significant coefficient is due to a negative claim probability effect and a positive claim size effect, as found in the ZAIG coefficients.
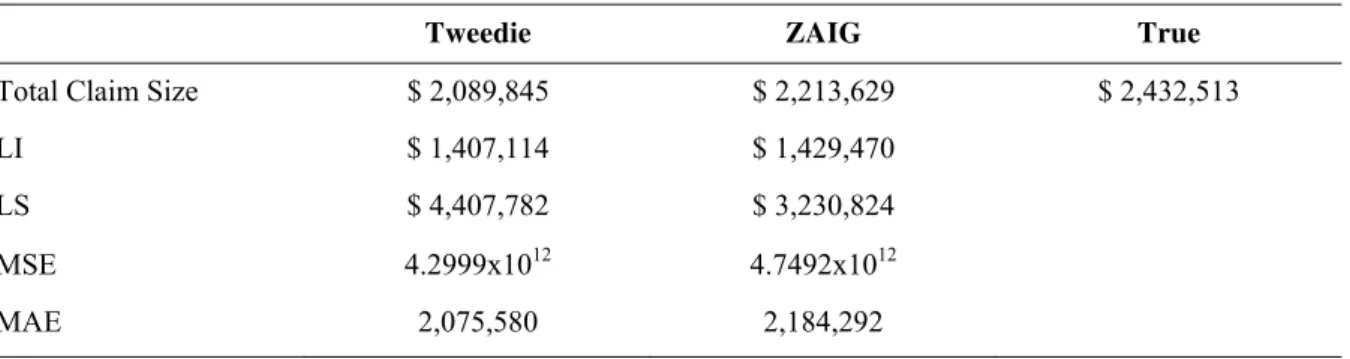
The total claim size forecast was made by adding together the individual forecast claim sizes based on the Tweedie and ZAIG models. Using parametric bootstrap simulation, we obtained a 95% confidence interval, based on empirical quantiles of 5,000 bootstrap estimates. For further details, see Efron and Tibishirani (1986).
Table 4 shows the estimated and true total claim size and the 95% confidence interval. The ZAIG model was better than the Tweedie model when it came to forecasting the total claim size, and both models showed negative bias. We notice that the forecasts lie within the confidence bands for both models, indicating good estimation results. Using inferior and superior limits, the insurance company can begin to picture total claim size dispersion.
We also calculated the mean squared error (MSE) and the mean absolute error (MAE) for the residuals. The results are very similar for both the Tweedie and ZAIG models.
Table 4
Total claim size, inferior and superior limits, mean squared error and mean absolute error for Tweedie and ZAIG models
Tweedie ZAIG True
Total Claim Size $ 2,089,845 $ 2,213,629 $ 2,432,513
LI $ 1,407,114 $ 1,429,470
LS $ 4,407,782 $ 3,230,824
MSE 4.2999x10¹² 4.7492x10¹²
Concluding Remarks
In this work we have tackled a well-known problem in the insurance industry, which is the proper pricing of an insurance policy. Employing the ZAIG estimation method for claims and risks in the insurance industry, we found distinct factors that influence claim size and probability. Factors such as territory, a vehicle’s advanced age, origin and type distinctly influence claim size and probability. The distinct impact is not always present in the Tweedie estimated model. The ZAIG estimation method also allows insurance companies to create a score system to predict claims, based on the logistic model. This score system identifies policy holders who tend to be more risky. These estimated models thus may be employed to develop a strategy for premium pricing. Moreover, insurance companies can use vehicle characteristics to estimate total claim size and thus get an idea of how much they will have to spend on a claim over a certain period of time and for a specific client portfolio.
Some limitations to this study should be pointed out. First, the methods require a high computational effort that may preclude the use of larger datasets. Second, there is room for developing suitable methods for longitudinal data analysis. Future work may consider the use of estimating equation techniques or multivariate ZAIG distributions. We concentrated our research on the auto insurance industry and specific vehicle variables. Further studies may address other insurance industries and include customer related variables.
Received 03 February 2010; received in revised form 28 June 2010.
References
Boland, P. J. (2007). Statistical and probabilistic methods in actuarial science. Boca Raton: Chapman & Hall/CRC.
Chang, L., & Fairley, W. B. (1979). Pricing automobile insurance under multivariate classification of risks: additive versus multiplicative. The Journal of Risk and Insurance, 46(2), 75-98.
Doherty, N. A. (1981). Is rate classification profitable? The Journal of Risk and Insurance, 48(2), 286-295.
Efron, B., & Tibshirani R. (1986). Bootstrap methods for standard errors, confidence intervals, and other measures of statistical accuracy. Statistical Science, 1(1), 54-75. doi: 10.1214/ss/1177013815
Gan, N. (2000). General zero-inflated models and their applications. Unpublished doctoral dissertation, North Carolina State University, North Carolina, United States of America.
Heller, G., Stasinopoulos, M., & Rigby, B. (2006, July). The zero-adjusted inverse Gaussian distribution as a model for insurance claims. Proceedings of the International Workshop on
Statistical Modelling, Galway, Ireland, 21.
Huang, T., Zhao, R., & Tang, W. (2009). Risk model with fuzzy random individual claim amount.
European Journal of Operational Research, 192(3), 879-890.doi:10.1016/j.ejor.2007.10.035
Jong, P., & Heller, G. Z. (2008). Generalized linear models for insurance data. Cambridge: Cambridge University Press.
Jørgensen, B. (1997). Theory of dispersion models. London: Chapman & Hall.
Jørgensen, B., & Souza, M. C. P. de (1994). Fitting Tweedie´s compound Poisson model to insurance claims data. Scandinavian Actuarial Journal,1(1), 69-93.
King, G., & Zeng, L. (2001). Logistic regression in rare events data. Political Analysis, 9(2), 137-163.
Meulbroek, L. (2001). A better way to manage risk. Harvard Business Review, 79(2), 22-23.
R Development Core Team (2007). R: A language and environment for statistical computing. R
foundation for statistical computing, Vienna, Austria. Retrieved January 12, 2008, from
http://cran.r-project.org/doc/manuals/refman.pdf
Smyth, G. K., & Jørgensen, B. (2002). Fitting tweedie’s compound poisson model to insurance claims data: dispersion modeling. Actuarial Studies in Non-life insurance (ASTIN) Bulletin, 32(1), 143-157.doi: 10.2143/AST.32.1.1020
Stasinopoulos, D. M., & Rigby, R. A. (2007). Generalized additive models for location scale and shape (GAMLSS). Journal of Statistical Software, 23(7), 1-46.
Stasinopoulos, D. M., Rigby R. A., & Akantziliotou, C. (2006). Instructions on how to use the
GAMLSS package in R (Technical Report 01/06), London, UK, STORM Research Centre,
London Metropolitan University.
Viaene, S., Ayuso, M., Guillen, M., Van Gheel, D., & Dedene, G. (2007). Strategies for detecting fraudulent claims in the automobile insurance industry. European Journal of Operational
Research, 176(1), 565-583. doi:10.1016/j.ejor.2005.08.005
Weisberg, H. I., & Tomberlin, T. J. (1982). A statistical perspective on actuarial methods for estimating pure premiums from cross-classified data. The Journal of Risk and Insurance, 49(4), 539-563.
Weisberg, H. I., Tomberlin, T. J., & Chartterjee, S. (1984). Predicting insurance losses under cross-classification: a comparison of alternative approaches. Journal of Business & Economic
Statistics, 2(2), 170-178.