Oncogenic Signals by
mir-181a-1/b-1
Rita Fragoso1,2., Tin Mao1,2., Song Wang1,2
, Steven Schaffert1,2, Xue Gong1,2, Sibiao Yue1,2, Richard Luong3, Hyeyoung Min1,2,4, Yumi Yashiro-Ohtani5,6, Mark Davis7, Warren Pear5,6, Chang-Zheng Chen1,2*
1Department of Microbiology and Immunology, Stanford University School of Medicine, Stanford, California, United States of America,2Baxter Laboratory for Stem Cell Biology, Stanford University School of Medicine, Stanford, California, United States of America,3Department of Comparative Medicine, Stanford University School of Medicine, Stanford, California, United States of America,4Chung-Ang University College of Pharmacy, Seoul, Korea,5Abramson Family Cancer Research Institute, University of Pennsylvania School of Medicine, Philadelphia, Pennsylvania, United States of America,6Department of Pathology and Laboratory Medicine, University of Pennsylvania School of Medicine, Philadelphia, Pennsylvania, United States of America,7Howard Hughes Medical Institute and Department of Microbiology and Immunology, Stanford University School of Medicine, Stanford, California, United States of America
Abstract
Oncogenes, which are essential for tumor initiation, development, and maintenance, are valuable targets for cancer therapy. However, it remains a challenge to effectively inhibit oncogene activity by targeting their downstream pathways without causing significant toxicity to normal tissues. Here we show that deletion of mir-181a-1/b-1 expression inhibits the development ofNotch1oncogene-induced T cell acute lymphoblastic leukemia (T-ALL).mir-181a-1/b-1controls the strength and threshold of Notch activity in tumorigenesis in part by dampening multiple negative feedback regulators downstream of NOTCH and pre-T cell receptor (TCR) signaling pathways. Importantly, although Notch oncogenes utilize normal thymic progenitor cell genetic programs for tumor transformation, comparative analyses of mir-181a-1/b-1function in normal thymocyte and tumor development demonstrate that mir-181a-1/b-1 can be specifically targeted to inhibit tumor development with little toxicity to normal development. Finally, we demonstrate thatmir-181a-1/b-1, but notmir-181a-2b-2 andmir-181-c/d, controls the development of normal thymic T cells and leukemia cells. Together, these results illustrate that NOTCH oncogene activity in tumor development can be selectively inhibited by targeting the molecular networks controlled bymir-181a-1/b-1.
Citation:Fragoso R, Mao T, Wang S, Schaffert S, Gong X, et al. (2012) Modulating the Strength and Threshold of NOTCH Oncogenic Signals by mir-181a-1/b-1. PLoS Genet 8(8): e1002855. doi:10.1371/journal.pgen.1002855
Editor:H. Leighton Grimes, Cincinnati Children’s Hospital Medical Center, United States of America
ReceivedMarch 4, 2012;AcceptedJune 11, 2012;PublishedAugust 9, 2012
Copyright:ß2012 Fragoso et al. This is an open-access article distributed under the terms of the Creative Commons Attribution License, which permits unrestricted use, distribution, and reproduction in any medium, provided the original author and source are credited.
Funding:This work was supported by NIH grants (HL081612, 1R01AI073724, and 1DP1 OD00643501), a W. M. Keck Young Scholar Award and a Stanford Developmental Cancer Research Award to C-ZC. RF was in part supported by the Fundac¸a˜o para a Cieˆncia e a Tecnologia fellowship (POPH/FSE/SFRH/BPD/43526/ 2008). The funders had no role in study design, data collection and analysis, decision to publish, or preparation of the manuscript.
Competing Interests:The authors have declared that no competing interests exist.
* E-mail: [email protected]
.These authors contributed equally to this work.
Introduction
Oncogenes elicit driving signals required for tumor initiation, development and maintenance and are valuable targets for cancer therapy. However, oncogenes often have essential functions in normal cellular physiology and produce intracellular proteins that are difficult to inhibit with small molecule drugs without causing significant toxicity to normal tissues. Therefore, it is imperative to identify downstream networks that can be targeted to dampen the oncogenic signals in tumor cells with limited toxicity to normal cells. Despite intense efforts, it remains a challenge to identify the downstream pathways controlled by oncogenes that are essential and specific for tumor development but not for normal develop-ment.
MicroRNAs (miRNAs) are an abundant class of small regulatory RNAs that control gene expression at the post-transcriptional levels. Some miRNAs are capable of potentiating tumorigenic activity of oncogenes, such asMycandNotch1, possibly by repressing known tumor suppressors [1,2]. In some cases,
miRNAs can function as oncogenes and aberrant expression of such an miRNA is sufficient to induce cancer [3,4]. Finally, some miRNAs can inhibit activities of oncogenes when delivered into tumor cells through viral transduction [5,6]. Clearly, miRNAs are integral components of oncogenic and tumor suppressing networks; however, the quantitative nature of miRNA effects on gene expression and cellular functions raises the issue as to whether loss of a miRNA would be sufficient to inhibit oncogene-induced tumorigenesis [7,8,9]. More importantly, few studies have demonstrated that miRNAs have essential roles in tumor development caused by human oncogenes using rigorous loss-of-function analyses.
clinical evaluation ofc-secretase inhibitors (GSIs) for the treatment of T-ALL. Treatment of patients with these inhibitors was unsuccessful because of limited anti-leukemic activity and severe gastrointestinal toxicity [12]. In humans and in animal models, transformation byNotch1oncogenes blocks T cell development at the immature double-positive (DP) cell stage but not at the mature T cell stages [13], indicating thatNotch1oncogenes may utilize the genetic programs that operate in normal thymic progenitor cells for tumor transformation. Intriguingly, miR-181a family miRNAs are highly expressed in T-ALL leukemia cells and down-regulated during remission [14], suggesting that miR-181 miRNAs play a role in the pathogenesis of human T-ALL. Here we carried out comparative analyses to examine the roles of mir-181 alleles in normal development and NOTCH-induced T-ALL using a loss of function approach. We found thatmir-181ab1controls the strength and threshold of Notch1 oncogenes by repressing the negative feedback regulators downstream of NOTCH and pre-TCR signaling. Deletion of mir-181ab1 effectively inhibits NOTCH-induced T-ALL without significant impact on normal develop-ment. These findings illustrate a general approach in uncovering pathways that are essential for oncogene activity in tumor development.
Results
Targeted deletion ofmir-181alleles in mice
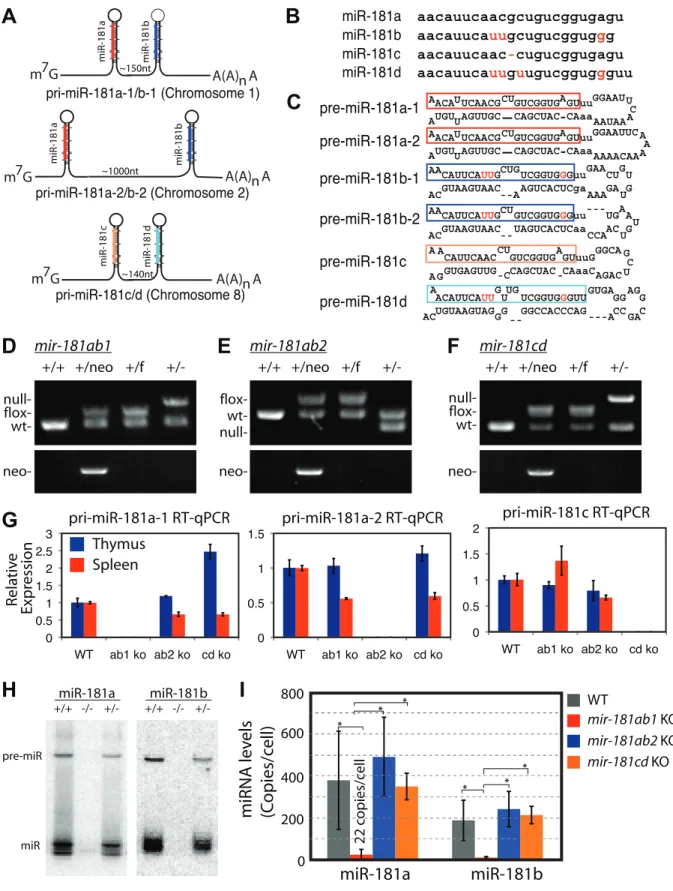
The members of the miR-181 family of genes, which will be referred to asmir-181ab1,mir-181ab2andmir-181cd, produce four nearly identical mature miRNAs (181a, 181b, miR-181c and miR-181d, respectively) from three polycistronic transcripts (Figure 1A–C). Given the dynamic expression of miR-181 miRNAs during normal lymphocyte development and during T-ALL progression [14–18] and that Notch1 oncogenes utilize genetic programs in early thymic progenitor cells for T-ALL
development [13], we used loss-of-function analyses to identify the mir-181 allele with critical roles in the development of normal thymic progenitor cells and in development of NOTCH-induced T-ALL. We obtained conditional mouse strains for all mir-181 alleles (Figure 1D–F and Figure S1A–G). Germline deletion of each individualmir-181allele completely abolished expression of pri-miRNA transcripts from the corresponding allele (Figure 1G). No protein coding genes were found within 10 kb up- or downstream of the mir-181ab1 and mir-181ab2 alleles (Figure S1G), and it is unlikely that loss of mir-181ab1 and mir-181ab2 would affect expression of protein-coding genes further from the alleles. Interestingly,Nanos3, a germline specific gene that plays an essential role in germ cell development, is about 2 kb upstream of mir-181cd(Figure S1G). However,mir-181cd null mice are viable and have no apparent defects in fertility. Thus, loss ofmir-181cd did not affect Nanos3 expression to a degree that would compromise the fertility ofmir-181cdnull mice.
Since Notch1 oncogenes may utilize the genetic programs that operate in normal thymic progenitor cells for tumor transforma-tion [13], we further characterized mature miR-181 miRNA expression in these germline knockout mice to determine whether one or more alleles contribute to miR-181 expression in thymocytes. T cell differentiation in the thymus can be divided into discrete stages based on CD4 and CD8 expression: CD4 and CD8 double-negative (DN) early thymic progenitors, more differentiated CD4 and CD8 double-positive (DP) thymocytes and differentiated CD4 or CD8 single-positive (SP) thymocytes. DN cells are further subdivided into DN1 (CD44+
CD252), DN2 (CD44+ CD25+), DN3 (CD442 CD25+) and DN4 (CD442
CD252) cell populations, listed in the order of their appearance during development. The DN1 subset also encompasses the earliest thymic T-cell progenitors, ETPs [19]. Previous sequencing analyses of small RNAs in CD4 and CD8 DP cells showed that mature miR-181a is expressed at levels about 100-fold higher than those of mature miR-181c [17]. Interestingly, loss of the mir-181ab1 allele reduced mature miR-181a expression to near background levels in the thymus as indicated by the northern blot analyses (Figure 1H). Furthermore, as shown by qPCR analyses, loss of themir-181ab1 allele reduced mature miR-181a and mature miR-181b expression to,22 and 8 copies per cell in DP cells (Figure 1I), respectively. Deletion ofmir-181ab2and mir-181cd alleles did not affect mature miR-181a and miR-181b expression levels (Figure 1I). Together, these results demonstrate that miR-181a and miR-181b are predominantly expressed from mir-181ab1in thymocytes, suggesting thatmir-181ab1, but not mir-181ab2andmir-181cd, may play a specific role in early thymocyte development.
mir-181ab1, but notmir-181ab2ormir-181cd, affects early thymocyte development
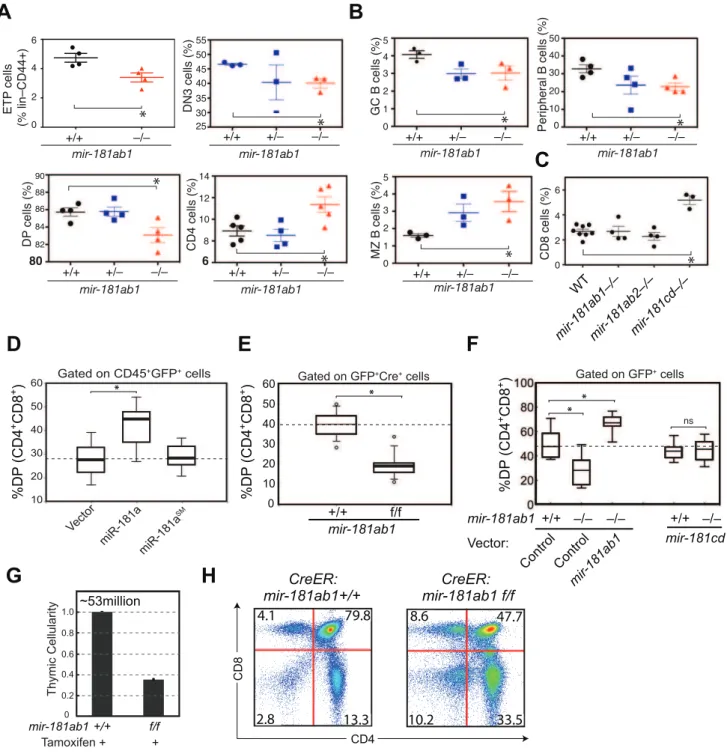
We then systematically examined the consequences of loss of individual mir-181 alleles on the development of T and B lymphocyte populations in various lymphoid and hematopoietic organs with a focus on the thymocyte populations (see Table S1 for cell populations and FACS definitions of,40 individual T and B lymphocyte populations). Consistent with predominant expression of mature miR-181a and miR-181b frommir-181ab1, the deletion of mir-181ab1 caused more apparent defects in early thymocyte development than deletion of the other alleles. We noted statistically significant but modest decreases in ETP, DN3 and DP cell populations and an increase in CD4 SP thymocytes upon mir-181ab1 deletion (Figure 2A and Figure S2A, B). mir-181ab1 deletion also resulted in significant changes in germinal center, marginal zone and peripheral B cell development (Figure 2B).
Author Summary
Figure 1. Generation of conditionalmir-181alleles in mice.(A) Schematics of putative primary miR-181 transcripts. (B) Alignment of mouse miR-181 family mature miRNAs. (C) Predicted stem-loop structures of miR-181 family miRNAs. (D-F) PCR confirmation of the deletion of neo cassette and (D)mir-181ab1, (E)mir-181ab2and (F)mir-181c/d. (G) RT-qPCR analyses of primary miR-181 expression in the thymus (blue) and spleen (red) of
mir-181knockout mice. (H) Northern blot analyses to confirm loss of miR-181a and miR-181b expression in the thymus upon the loss ofmir-181ab1
alleles. (I) Mature miR-181a and miR-181b expression in DP cells from WT,mir-181ab12/2andmir-181ab22/2mice determined by quantitative miRNA
Germline deletion ofmir-181cdcaused more than a 2-fold increase in the percent of CD8 T cells in the thymus but did not cause notable changes in other T and B lymphocyte populations examined including DN1–4, DP and CD4 cells (Figure 2C). Germline deletion ofmir-181ab2had no apparent effects on any of the cell populations examined. Cell populations without significant
changes upon the loss of individualmir-181alleles are not shown in Figure 2. Moreover, loss of individual mir-181 alleles did not significantly change the cellularity of hematopoietic organs, such as bone marrow, spleen, thymus and peripheral blood, in the germline-knockout mice. Thus, changes in proportions shown in Figures 2A–C should correlate with corresponding changes in cell
Figure 2. Effects ofmir-181ab1deletion on normal development.(A and B) Effects of germline deletion ofmir-181ab1on (A) T lymphocyte and (B) B lymphocyte development (*,p,0.05, Mann-Whitney rank sum tests). (C) Effects of germline deletion ofmir-181cdon CD8 thymocyte development. (D) Effects ofmir-181a-1ectopic expression on DP thymocyte development determined by the OP9-DL1 assay. (E) Effects of Cre-mediated deletion ofmir-181ab1on DP thymocyte development determined using the OP9-DL1 assay. (F) Effects of germlinemir-181ab1deletion andmir-181cddeletion on DP thymocyte development in the OP9-DL1 assay. (G and H) Effects of induced deletion of themir-181ab1alleles on thymocyte developmentin vivo. CreER:mir-181ab1+/+and CreER:mir-181ab1f/fmice were injected with tamoxifen four times at two-day intervals to induce the deletion ofmir-181ab1alleles and analyzed at day 5 after the last tamoxifen injection to determine (G) thymic cellularity and (H) CD4/CD8 profiles. Representative results of two independent analyses are summarized or presented in (G) and (H).
numbers. miR-181 miRNAs are also expressed in the brain and in muscle [15], but further analyses must be carried out to dissect the function ofmir-181alleles in these tissues. Overall, germline mir-181knockout mice are viable and have no noticeable defects for up to twelve months.
The effects of mir-181ab1 on early T cell development were further confirmed within vitroandin vivoanalyses. Using an OP9-DL1 stromal (expressing NOTCH ligand, delta-like 1) co-culture assay [20] that recapitulates early thymic T cell development in culture (Figure S2C), we showed that ectopic mir-181a-1 expres-sion in thymic progenitor cells potentiates DP cell development (Figure 2D, and Figure S2D,E), whereas conditional (Figure 2E and Figure S2F–I) or germline (Figure 2F) deletion ofmir-181ab1 inhibits it. The ectopic expression ofmir-181ab1, but notmir-181cd, in thymic progenitors rescued the defects caused by mir-181ab1 germline deletion (Figure 2F), demonstrating that these two alleles have different functions in early T cell development [21]. Most importantly, conditional deletion of the allele using tamoxifen-induced CreER resulted in 50–75% decrease in cellularity in the thymus (Figure 2G,p,0.05) – a decrease from an average of,53 million cells/thymus in wild-type mice to ,23 million cells/ thymus in mice withmir-181ab1 alleles floxed – and a significant reduction in the percentage of DP cells (Figure 2H, p,0.05). Finally, miR-181a expression decreased during the DN3a to DN3b transition during b-selection (Figure S2J), and loss of mir-181ab1 resulted in a significant reduction in the percentage of DN3 and DN4 cells that expressed intracellular TCR-b (Figure S2K), but preTaexpression in DN3 subsets was normal (data not shown). These results suggest that mir-181ab1 contributes to the DN3 to DP transition, possibly by regulatingb-selection and post
b-selection expansion, and its effects are intrinsic to thymic progenitor cells. Importantly, the fact that strong effects on thymic T cell development as a result of mir-181ab1 deletion in vitro (Figure 2E–F) and acute deletion of mir-181ab1 in vivo were observed (Figure 2G, H), suggests that it is likely that such effects might be compensated in germline knockout mice through homeostatic mechanisms that maintain the stability and robustness of immune systems (Figure 2A–C). In summary,mir-181ab1, but not mir-181ab2 or mir-181cd, has specific roles in early T cell development in the thymus.
Loss ofmir-181ab1dampens ICN1 oncogenic activity in T-ALL induction
The fact thatNotch1oncogenes block T cell development at the immature DP cell stage but not at the mature T cell stages [13] suggests that Notch1 oncogenes utilize the genetic programs of normal thymic progenitor cells for T-ALL induction. Indeed, NOTCH and pre-TCR signals, which act synergistically to promote thymic T cell development during b-selection and post
b-selection T cell expansion, are also critical for NOTCH-induced T-ALL development [22,23]. Given the role ofmir-181ab1in early thymocyte development and during the DN3 to DP transition (Figure 2D–H and S2J, K),mir-181ab1may also be important for NOTCH-induced T-ALL.
We next examined the effects of loss ofmir-181ab1on T-ALL induced by the intracellular domain of NOTCH1 (ICN1) (Figure 3A). Loss of mir-181ab1 caused a 32% increase in the median survival time of T-ALL mice from 41 days to 54 days (Figure 3B,p,0.0001, 20 mice/group, a representative plot of 4 independent experiments is shown). The delayed mortality correlated strongly with a drastic decrease of ICN1-infected blood cells (as measured by the number of GFP+cells) and DP leukemia
cells (GFP+
DP) in the peripheral blood (PB) and in hematopoietic and non-hematopoietic organs of recipient mice at 4 weeks after
transplantation (Figure 3C–F and Figure S3A–D). It is important to note the distinct developmental kinetics of GFP+
and GFP+
DP cells in the wild-type and knockout groups. In mice reconstituted with ICN1:181ab1+/+
bone marrow (BM) cells, the percentage of GFP+
and GFP+
DP cells in peripheral blood increased during the 6 weeks after transplantation (Figure 3C and Figure S3A), whereas in mice reconstituted with ICN1:181ab12/2 BM cells the percentage of GFP+
and GFP+
DP cells first decreased from 2 to 4 weeks and then increased from 4 to 8 weeks post-transplantation (Figure 3C and Figure S3A).
Loss of mir-181ab1 also compromised other steps that are required for the development of ICN1-induced T-ALL. For example, ICN1:mir-181ab12/2DP cells can develop in the thymus (Figure 3F, bottom panel, 2-week time point), whereas ICN1: mir-181ab1+/+DP cells cannot. Thus, loss of mir-181ab1 altered the
tissue distribution of ICN1-infected T-ALL cells and enabled the development (or migration) of ICN1-infected DP cells in the thymus at 2 weeks post-transplantation (Figure 3F, lower panel). This is significant because ICN1 expression in hematopoietic progenitor cells is known to block T cell development in the thymus while promoting ectopic T-cell development in BM and other organs [13,24]. Interestingly, loss of mir-181ab2 did not inhibit development of ICN1-induced T-ALL, and loss of mir-181cdactually exacerbated ICN1-induced T-ALL (Figure S3F–G). Finally, loss ofmir-181ab1did not have detrimental effects on the reconstitution potentials of hematopoietic stem/progenitor cells (Figure S3E and see Text S1 for additional details and Figure S3H for histology). Since multiple independent infections and large cohorts of recipients were used in each of these analyses, it is unlikely that the effects observed here are due to variations in clonal outgrowth. Together, these results demonstrate that mir-181ab1, but not mir-181ab2 ormir-181cd, specifically potentiates ICN1-induced T-ALL.
mir-181ab1deletion affects the strength and threshold of ICN1 oncogenic activity
Intriguingly, we noted that mir-181ab1 deletion appeared to have stronger inhibitory effects on T-ALL cells with lower levels of ICN1 expression and presumably weaker NOTCH oncogenic signals (Figure 3G–K). Two distinct GFP cell populations were found in the BM of T-ALL mice at 2, 4 and 6 weeks after transplantation: One cell population expressed lower levels of GFP (GFPlow) and the other cell population expressed higher levels of GFP (GFPhigh) (Figure 3G). As shown by FACS analyses of intracellular ICN1 (Figure 3H), GFPhigh DP cells have higher levels of ICN1 protein than do the GFPlowDP cells. To determine the leukemogenic potential of DP cells with different levels of ICN1 expression, we carried out secondary transplantation analyses. We sorted GFPhigh and GFPlowDP cells from primary ICN1:181ab1+/+and ICN1:181ab12/2T-ALL mice at 2, 4 and 6
weeks post-transplantation and transplanted sorted DP cells into new recipients to generate secondary T-ALL mice. We then monitored the leukemogenic potential of these DP cells.
Consistent with previous observations on the correlation between the signaling strength of variousNotch1 mutants and T-ALL activity [25], we noted that GFPhigh DP cells, but not the GFPlow DP cells, isolated from ICN1:181ab1+/+
recipients (Figure 3I, J), whereas the equivalent cell populations from ICN1:181ab1+/+
primary recipients did. Finally, although the GFPhigh DP cells from ICN1:181ab1+/+
and ICN1:181ab12/2 primary T-ALL mice collected at 6 weeks after transplantation were strongly leukemogenic, mir-181ab1 deletion significantly reduced the oncogenic activity of ICN1 (Figure 3K). There were essentially no GFPlow DP cells in T-ALL mice at 6 weeks after transplantation. Thus, loss ofmir-181ab1 effectively inhibited T-ALL development in recipients of cells with lower levels of ICN1 expression (GFPlow DP cells) (Figure 3J) and delayed T-ALL development in recipients of cells with high levels of ICN1 expression (GFPhigh DP cells) (Figure 3K). These results also demonstrate thatmir-181ab1deletion has strong intrinsic effects on the development of DP leukemia cells, although we cannot rule out that this miRNA may affect non-T cell types that can dampen NOTCH-induced T-ALL. Most importantly, these findings show that loss ofmir-181ab1 may be more effective in suppressing T-ALL development induced byNotch1 mutations with lower levels of ICN1 and weaker signaling strength than that induced by mutations with higher levels of ICN1 and stronger signaling strength. These results demonstrate that mir-181ab1controls the strength and threshold of ICN1 oncogenic signals. Thus, mir-181ab1deletion can delay T-ALL development induced by strong Notch oncogenes (Figure 3B) and blocks T-ALL development induced by weaker oncogenic signals (Figure 3I–K).
mir-181ab1deletion inhibits T-ALL development induced by a human Notch1 mutant
Among the known humanNotch1mutants, the P12DP mutant is one of the strongest [25] and is found in 15–20% of pediatric T-ALL patients. Loss of mir-181ab1 strongly inhibited T-ALL development induced by P12DP, causing a decrease in mortality from 60% in P12DP:181ab1+/+T-ALL mice to 10%, a striking
80% reduction in mortality (Figure 4A, 20 mice/group, a representative plot of 2 independent experiments is shown.). Importantly, percentages of P12DP-infected PB cells (GFP+
) and pre-leukemia cells (GFP+
DP cells) decreased in both P12DP:181ab1+/+
and P12DP:181ab12/2T-ALL mice at 5 weeks after transplantation (Figure 4B). Infected cells reappeared in 12 out of 20 P12DP:181ab1+/+T-ALL mice (Figure 4B) and caused
mortality as early as 10 weeks after transplantation (Figure 4A). In contrast, GFP+
DP cells only reappeared in 2 out of 20 P12DP:181ab12/2 T-ALL mice after 20 weeks post-transplanta-tion and caused mortality no earlier than 24 weeks after transplantation. Thus, loss of mir-181ab1 nearly completely blocked leukemia development induced by P12DP. Viral integra-tion effects may have caused higher P12DP expression and stronger oncogenic signaling in the two P12DP:181ab12/2T-ALL mice that died of T-ALL (Figure 4B and Figure S3I).
Comparable percentages of GFP+
cells were found in the majority of the hematopoietic/lymphoid organs of P12DP:181ab1+/+
and P12DP:181ab12/2 T-ALL mice at 6 to 7
weeks (Figure 4C, upper panel) and at ,48 weeks after transplantation (Figure 4D, upper panel). Therefore, loss of mir-181ab1 did not have observable detrimental effects on the reconstitution potential of P12DP-infected bone marrow cells. Of note, at,48 weeks after transplantation (Figure 4D, lower panel), the P12DP:181ab12/2T-ALL mice that did not develop leukemia
had a significant percentage of P12DP-infected (GFP+
) DP cells in the thymus but not in the PB, BM or spleen (*,p,0.05). These results demonstrate that loss of mir-181ab1 inhibits extrathymic development of P12DP-infected (GFP+) DP cells and rectifies
extrathymic tissue-distribution of oncogenic T-ALL cells previ-ously observed in BM, spleen and other organs [13]. Thus, the loss of mir-181ab1 effectively reduced the tumorigenic activity of the P12DP oncogene below a functional threshold. These findings further confirm thatmir-181ab1 deletion effectively inhibits T-ALL development induced by weaker NOTCH oncogenic signals as a result of low ICN1 oncogene expression (Figure 3) or P12DP mutations (Figure 4). Since P12DP is one of the strongest Notch1 oncogenes identified in human T-ALL cells, targetingmir-181ab1 may effectively inhibit T-ALL development induced by other humanNotch1mutants.
mir-181ab2andmir-181cddo not functionally
compensate for the loss ofmir-181ab1in ICN1-induced T-ALL
The fact that strong NOTCH oncogenic signals can overcome the inhibitory effects ofmir-181ab1deletion raised the question of whethermir-181ab2ormir-181cdmight compensate for the loss of mir-181ab1 in T-ALL development. Levels of 181a, miR-181b and miR-181c remained at a few copies per cell in ICN1:181ab1+/+
T-ALL mice at 2, 4 and 6 weeks after transplantation (Figure 5A), but the levels of miR-181a and miR-181c in ICN1-infected DP cells increased from less than 10 copies/cell at 2 and 4 weeks to 80 and 35 copies/cell, respectively, at 6 weeks post-transplantation in ICN1:181ab12/2T-ALL mice (Figure 5B). This suggests that ICN1 may up-regulate the expression of miR-181a and miR-181c frommir-181ab2and mir-181cdalleles, respectively, to compensate for the loss ofmir-181ab1. Deletion of both mir-181ab1 and mir-181ab2 did not further potentiate the effects of loss ofmir-181ab1 on ICN1-induced T-ALL development (Figure 5C, E). In fact, loss of bothmir-181ab1 and mir-181cd actually diminished the inhibitory effects of mir-181ab1deletion on T-ALL development (Figure 5D, F). Together, these results indicate that increased expression of miR-181a and miR-181c from the correspondingmir-181ab2andmir-181cdalleles at the late stage of ICN1-induced T-ALL does not compensate for the loss ofmir-181ab1.
Loss ofmir-181ab1effectively dampens ICN1-controlled oncogenic programs
To determine whethermir-181ab1affects T-ALL development by directly controlling NOTCH signaling, we carried out
Figure 3. Loss ofmir-181ab1delays T-ALL and inhibits T-ALL development induced by low levels of ICN1.(A) Schematic of experimental design. (B) Kaplan-Meier survival curves show the effect of loss ofmir-181ab1on the percentages of mice surviving at different time points after T-ALL induction with ICN1 (p,0.0001, n = 20 mice/experimental group, a representative plot of 4 independent experiments is shown). (C–F) Effects of loss ofmir-181ab1on the percentage of total ICN1-infected cells (all GFP+
cells) and the percent of ICN1-infected DP leukemia cells (GFP+
DP cells) in (C) peripheral blood, (D) bone marrow, (E) spleen and (F) thymus of T-ALL mice (*,p,0.05; **,p,0.01; ***,p,0.001;). (G) Mice transplanted with ICN1:181ab1+/+
or ICN1:181ab12/2BM cells have distinct profiles of GFP+
cells at 2, 4 and 6 weeks after transplantation. Gates that define GFPhighand
GFPlowcells are indicated. (H) Relative levels of ICN1 expression in GFPhighand GFPlowcells were determined by intracellular staining of ICN1 and
FACS analyses. (I–K) The Kaplan-Meier survival curves of the secondary transplantation analyses. ICN1-infected DP cells (GFP+
DP cells) were sorted from primary recipients at (I) 2, (J) 4 and (K) 6 weeks after transplantation and transferred to each of five secondary recipients. Secondary recipients were analyzed for survival and development of DP leukemia cells in the peripheral blood to determine the leukemogenic potentials of GFPhighand GFPlowcells from primary recipients transplanted with ICN1:181ab1+/+
transcriptional profiling analyses. To this end we generated triplicate microarray data sets from normal DP thymocytes, primary ICN1:181ab1+/+
GFPlow DP cells and primary IC-N1:181ab12/2 GFPlow and GFPhigh DP cells from T-ALL mice at 4 weeks post-transplantation (Table S2). It is important to note that at 4 weeks post-transplantation, although ICN1:181ab12/2 and ICN1:181ab1+/+
DP cells express similar levels of ICN1 (Figure S3J), these cells have different leukemogenic potential. Primary ICN1:181ab1+/+
GFPlow DP cells induce leukemia in secondary recipient mice, whereas ICN1:181ab12/2 GFPlow or GFPhighcells do not (Figure 3J). Thus, comparing the changes in
gene expression between the primary ICN1:181ab1+/+
GFPlowDP cells and ICN1:181ab12/2GFPlowor GFPhighcells should reveal the effects of mir-181ab1deletion on ICN1-controlled oncogenic programs on a global level.
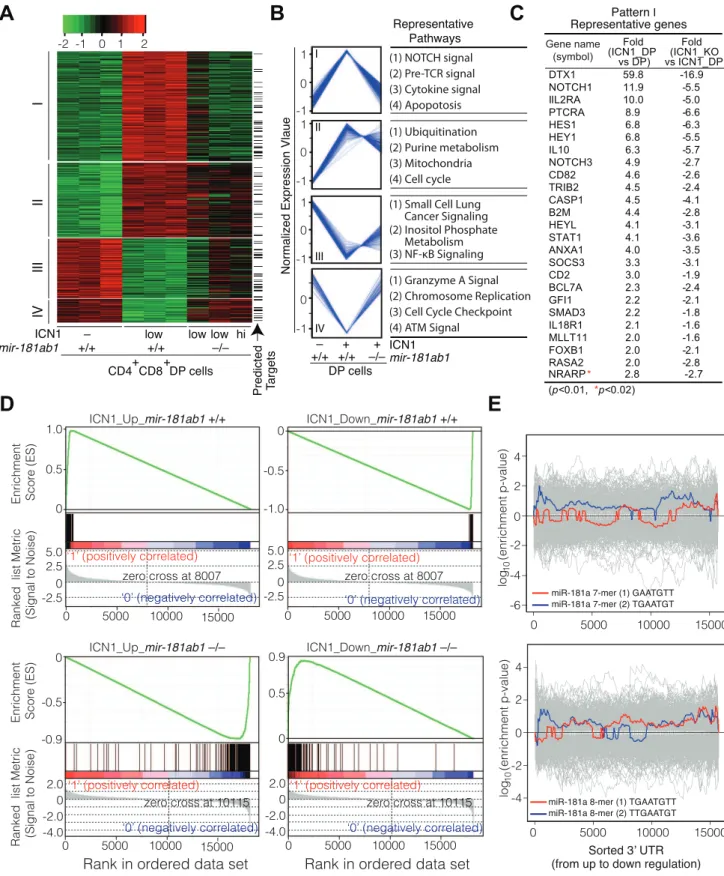
ICN1 expression in DP cells resulted in aberrant expression of over 500 genes (.2-fold, p,0.01, Table S3). Unsupervised hierarchical clustering analyses classified the ICN1-controlled gene set into four clusters, I–IV (Figure 6A, B). The cluster I genes, which were up-regulated by ICN1 and reverted in themir-181ab1 null T-ALL DP cells, include numerous genes that are known to be critical for NOTCH (e.g.,Dtx1,Notch1,Hes1,Hey1andNrarp),
Figure 4. Loss ofmir-181ab1inhibits leukemia development induced by the human NOTCH1 mutant P12DP.(A) Kaplan-Meier survival curve showing the effects of loss ofmir-181ab1on the percentages of mice surviving at different time points after T-ALL induction with P12DP (p,0.01, n = 20 mice/experimental group, a representative plot of two independent experiments is shown). (B) Effects of loss ofmir-181ab1on the percentage of total P12DP-infected cells (all GFP+cells) and the percent of P12DP-infected DP cells (GFP+DP cells) in peripheral blood at different
time points after reconstitution (*,p,0.05). (C and D) The percentage of GFP+
cells (upper panel) and GFP+
DP cells (lower panel) in BM, spleen and thymus of T-ALL mice at (C) 6 to 7 weeks or (D),48 weeks after transplantation (*,p,0.05).
pre-TCR (e.g.,Ptcra), cytokine and apoptosis pathways (Figure 6C, Table S3). Down-regulation of some direct targets of the ICN1 oncogene (Dtx1,Hes1andHey1) as a result ofmir-181ab1deletion was confirmed by quantitative PCR analyses (Figure S3K). Expression of genes in the other clusters (II–IV) was less impacted by mir-181ab1 deletion, and these clusters are not enriched for known NOTCH pathway genes. Gene set enrichment analyses also confirmed that ICN1-controlled gene sets were effectively reversed to basal or near basal levels in the absence ofmir-181ab1 (Figure 6D). Overall, loss ofmir-181ab1had drastic effects on the expression of the ICN1-controlled gene set and reverted a significant portion of them back to the levels of normal DP cells (Figure 6A, B). However, Sylamer analyses did not reveal significant enrichment of 7-mer or 8-mer miR-181a seed sequences among the up-regulated genes (Figure 6E). Given that over 25% of ICN1-regulated genes (,550, .2-fold, p,0.01, Table S3) were predicted to be targets of miR-181a by
TargetScan, PicTar or miRanda (Figure 6A, indicated by arrow), it is likely thatmir-181ab1deletion affects the expression of many downstream NOTCH targets. Together, these results suggest that mir-181ab1plays a critical role in potentiating NOTCH oncogenic signals.
mir-181ab1dampens negative feedback regulators of NOTCH and pre-TCR pathways
mir-181ab1 deletion did not completely block NOTCH onco-genic signaling as it did not completely revert the expression of many cluster I genes to the level observed in normal DP cells (Figure 6C). This observation suggests that mir-181ab1 deletion may have dampened NOTCH oncogenic signals by permitting higher expression of negative feedback molecules, which results in a reduction in NOTCH signaling as indicated by lower induction of NOTCH target genes. Thus,mir-181ab1may mediate its effects on the ICN1 oncogenic program through dampening the negative
Figure 5. The differential effects of loss of individualmir-181family genes on ICN1-induced T-ALL.(A and B) Copy numbers of mature miR-181a, miR-181b, miR181c and miR-181d in ICN1-infected DP cells from (A) ICN1:181ab1+/+
and (B) ICN1:181ab12/2recipient mice at 2, 4 and 6
weeks post-transplantation determined by standard curve-based miRNA qPCR analyses. (C and D) Kaplan-Meier survival curves indicate the percentage of mice (20 mice/group) surviving at different time points after reconstituting with (C) ICN1-infectedmir-181ab1/ab22/2(p,0.001) or (D)
ICN1-infectedmir-181ab1/cd2/2BM cells (p.0.05). (E and F) Effects of loss ofmir-181family genes on the percentage of total ICN1-infected cells (all GFP+
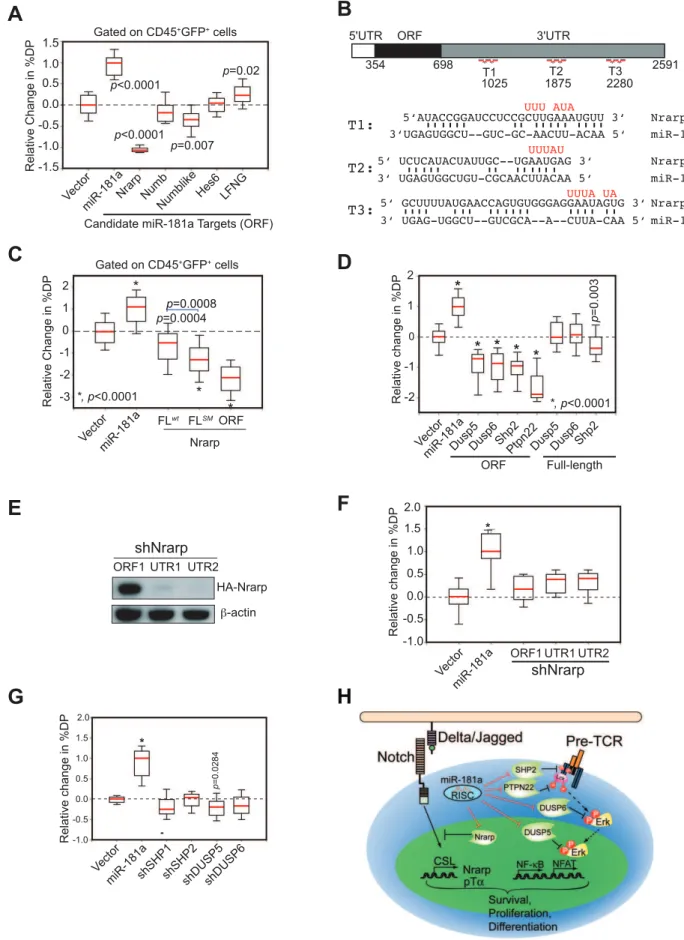
feedback loops controlled by Notch1 oncogenes. We found that many known negative regulators of the NOTCH signaling pathway, such as Nrarp, Numb, Numb-like, Hes6and Lunatic Fringe (Lfng) mRNAs, contain multiple putative miR-181a binding sites in their 39UTR regions (Figure S4A). We devised a biological screen to identify the functionally relevant targets using the OP9-DL1 co-culture assay (Figure S2C). If candidate targets are functionally relevant, ectopic expression of the miR-181a-insensitive version of the targets (binding sites absent or mutated) in thymic progenitor cells should inhibit or dampen the effects of miR-181a on normal DP cell development, resulting in a phenotype that opposes that of ectopic expression miR-181a. In contrast, if candidate targets are functionally irrelevant, ectopic expression of the miR-181a-insensitive version of the targets should have no such effects.
We found that ectopic expression of only the open reading frame (ORF) of Nrarpcaused strong inhibition of DP thymocyte development; ectopic expression of theNumb-likeORF had only a slight effect (,25% reduction); and ectopic expression ofNumb-like, Numb, Hes6 orLfng ORFs had no significant effects on DP cell development (Figure 7A and see Figure S4B for representative FACS plots). Thus, consistent with the observed function of Nrarp during early thymocyte development [26], these results demon-strate thatNrarpmRNA is likely a functional target of miR-181a in early thymocyte development. Further epistatic analyses showed that expression ofNrarp-FLwt, which contains the full-lengthNrarp 39UTR and intact miR-181a binding sites, had limited suppressive activity (Figure 7B, C, and see Figure S4C for representative FACS plots). However, the suppressive activity ofNrarp-FL on T cell development significantly increased when the predicted pairings to the miR-181a seeds were abrogated. Moreover, the NrarpORF had much stronger suppressive activity than didNrarp -FLSM, suggesting that there may be cryptic miR-181a binding sites in the 39 UTR of Nrarp. All three Nrarp expression constructs produced similar levels ofNrarptranscripts in a miR-181a-negative cell line as demonstrated by qPCR analyses (Figure S4D). Thus, the differential functional activities observed are not due to inherent differences in Nrarp mRNA levels. Since endogenous NrarpmRNAs are present in these assays (Figure S4E), these results demonstrate thatNrarptranscripts are suppressed by endogenous miR-181a in early thymocytes. Together, our data show that the predicted miR-181a binding sites in theNrarp39UTR (Figure 7B) are targeted by endogenous miR-181a during early T cell development.
We previously showed that miR-181a potentiates TCR signaling by suppressing the expression of multiple phosphatases, includingDusp5,Dusp6,Shp2andPtpn22, in DP and mature T cells [16]. Since pre-TCR and TCR pathways share common signaling molecules and, more importantly, NOTCH and pre-TCR signaling act synergistically to promote early T cell and T-ALL development [23,27], miR-181a may also regulate pre-TCR signaling during these developmental processes. Indeed, we found that ectopic expression of the coding regions (miR-181a-insensitive forms) of Dusp5, Dusp6, Shp2 andPtpn22 efficiently inhibited the development of DP thymocytes, whereas expression of the full-length cDNA versions (miR-181a-sensitive forms) of these phosphatases had little or no effect (Figure 7D and see Figure S4F for representative FACS plots). Since the mRNA transcripts of these phosphatases are readily detectable in various thymic progenitor populations (Figure S4E), and they are validated
miR-181a targets in DP and mature T cells [16], these results demonstrate that these phosphatase transcripts are also suppressed by the endogenous miR-181a during early T cell development. Importantly, expression of shRNAs targetingNrarp,Shp2,Dusp5or Dusp6 genes did not recapitulate the phenotype of miR-181a ectopic expression in early T cell development (Figure 7E–G) despite the fact that these shRNAs can suppress the expression of corresponding proteins more effectively than miR-181a [16]. Together, these results demonstrate that the effects of miR-181a on early T cell development are mediated through the regulation of multiple negative feedback regulators in both NOTCH and pre-TCR signaling pathways (Figure 7H).
miR-181a contributes to the maintenance of NOTCH oncogenic activity in T-ALL cells
Since both NOTCH and pre-TCR pathways are important for T-ALL development [22,23] and can each be targeted for T-ALL treatment [28,29], the above findings (Figure 7A–D) suggest that mir-181ab1controls similar pathways in T-ALL cells and in normal DP cells. We went on to examine whether miR-181a contributes to the maintenance of NOTCH oncogenic activity in T-ALL cells by altering expression of similar targets in mouse and human T-ALL cells. First, we stably expressed wild-type miR-181a (miR-181aWT) in T6E cells, a murine T-ALL cell line [30]. As shown by western blot analyses, expression of miR-181aWT resulted in ,40% less HA-tagged Nrarp from a full-lengthNrarpcDNA than observed in cells that expressed a seed mutant miR-181a (Figure 8A). Second, transient inhibition of miR-181a expression in T6E cells with antagomirs resulted in up-regulation ofNrarp(by 61%), Dusp5 (by 50%), Dusp6 (by 100%) and Shp2 (by 84%) mRNAs compared to cells treated with the mismatched control (Figure 8B). Thus, miR-181a dampens expression of at least some of the same targets in T6E cells as it does during normal thymocyte development (Figure 7). Finally, in the T6E cells treated with antagomir-181a, we observed increased Nrarp and DUSP6 protein expression (Figure 8C), down-regulation of expression from Notch1 controlled targets including c-Myc, Dtx1, Hes1 and Hey1(Figure 8D), a decrease in proliferation (Figure 8E), and an increase apoptosis (Figure 8F). Further supporting the observations made in T6E cells, we noted that expression ofNrarp-FLmut (an miR-181a-insensitive mRNA) but not Nrarp-FLwt (miR-181a-sensitive) in T-ALL DP cells from primary recipients suppressed the development of T-ALL DP cells and tumorigenic potential in secondary recipients (Figure 8G). Moreover, induced deletion of mir-181ab1caused a significant and persistent decrease in the DP leukemia cell population with low levels of ICN1 expression (GFPlow DP cells) in T-ALL mice (Figure 8H). Finally, we examined whether miR-181a contributes to the maintenance of NOTCH oncogenic activity in human T-ALL cells. We found that antagomir inhibition of miR-181a in the human T-ALL cell line DND41 [31] had effects similar to those we observed in murine T6E T-ALL cells (Figure 6C, 8B–D and S3K). Antagomir miR-181a treatment of DND-41 cells caused a reduction in cell proliferation (Figure 8I), an increase of apoptotic cells in the culture (Figure 8J), up-regulation of miR-181a targets (Figure 8K), and down-regulation of Notch targets (Figure 8L). Together, these findings demonstrate that miR-181a contributes to the mainte-nance of human and mouse T-ALL cells by dampening the
by ICN1. (E) Enrichment of 7- and 8-mer miR-181a seed sequences among the differentially expressed genes caused by the loss ofmir-181ab1in DP leukemia cells was determined by Sylamer analysis. The colored and gray lines correspond to enrichment of miR-181a seeds and unrelated miRNA seeds, respectively.
negative feedbacks and potentiating NOTCH and pre-TCR signals (Figure S5), suggesting that miR-181a may be a therapeutic target in human T-ALL.
Discussion
In this study, we examined the roles of threemir-181genes, mir-181ab1,mir-181ab2andmir-181cd, in normal thymocyte develop-ment and in T-ALL developdevelop-ment. We found that deletion of mir-181ab1, but not mir-181ab2 and mir-181cd, effectively inhibited NOTCH1-induced T-ALL. Moreover, the effects of mir-181ab1 deletion onNotch1oncogenic potential depend on the expression levels and the signaling strength of the oncogenes. In particular, we showed thatmir-181ab1deletion inhibits the oncogenic activity of P12DP — one of the strongest NOTCH1 mutants identified in human T-ALL patients [25] — indicating that targeting mir-181ab1may effectively inhibit the tumorigenic potential of other human Notch1mutants. Our results demonstrate that mir-181ab1 can regulate the strength and threshold of Notch1 oncogenic activity. It is important to note that deletion ofmir-181ab1had a quantitative effect on normal development that was sufficient to dampen Notch1 oncogenic potential and dramatically improve mortality in T-ALL mice (Figure 4). Together with our previous study showing that miR-181a functions as a rheostat in regulating the strength and threshold of TCR signaling and T cell sensitivity to antigen [16], these results illustrate a general model of miRNA function in controlling the strength and threshold of receptor signaling by regulating multiple targets during normal and oncogenic developmental processes. These findings support the notion that quantitative regulation of oncogenic signal strength can be sufficient to block cancer development [8] and demonstrate that miRNAs may be effective therapeutic targets [9].
Our comparative analyses revealed that the pathways controlled by mir-181ab1 are not of equal importance in normal thymic progenitor cells and T-ALL DP cells (Figure 2–4). The fact that co-expression ofmir-181a-1together with ICN1 did not significantly potentiate the oncogenic activity of ICN1 (Figure S6) implies that endogenous mir-181ab1 and the pathways it controls may be sufficient to potentiate Notch1 oncogene signaling. Clearly the effects ofmir-181ab1deletion were compensated for during normal thymic progenitor development but not during T-ALL develop-ment (Figure 2–4). It is possible that normal vertebrate immune systems, which have central roles in controlling host immunity and homeostasis, may have many intrinsic mechanisms to withstand many forms of perturbations and can compensate for the mir-181ab1deletion. In contrast, T-ALL cells may be more reliant on the pathways controlled by mir-181ab1 and homeostatic mecha-nisms most likely do not exist in T-ALL cells. Our findings illustrate that comparative studies on the pathways utilized by normal cells and tumor cells can reveal how tumorigenic pathways may be selectively inhibited with limited damage to normal tissues. Since germlinemir-181ab1knockout mice are viable and have no noticeable defects for up to twelve months, inhibition of
mir-181ab1activity should block NOTCH1-induced tumorigenesis without significant side effects. However, since miR-181 miRNAs are highly expressed in brain and muscle tissue [15], further studies should be carried out to examine the function ofmir-181 alleles in the development and function of non-hematopoietic tissues and organs.
The ability to regulate multiple targets enables a miRNA to mediate its biological function by controlling varied gene sets in different cell types. This results in the expansion of regulatory complexities conferred by the same set of protein-coding genes during normal lineage development and tumorigenesis. In this study, dissecting the multi-target networks controlled by miRNAs during normal thymic T cell development and NOTCH-induced T-ALL allowed us to unravel the downstream molecular networks that contribute to normal thymic T cell development and NOTCH-induced tumorigenesis. Early studies have elegantly shown that NOTCH and pre-TCR signals play critical roles during normal thymic progenitor cell development and T-ALL development [22,23]. However, neither NOTCH nor pre-TCR signals can be targeted effectively for treatment of T-ALL with inhibitors like GSI or cyclosporine, respectively, due to weak therapeutic effects and severe toxicity [28,29]. Our finding thatmir-181ab1modulates both normal and leukemogenic DP cell development in part by repressing the negative feedback regulators of NOTCH and pre-TCR signaling pathways (Figure 2–4, 6, 7) demonstrates that it is possible to targetmir-181ab1to inhibit both NOTCH and pre-TCR signals simultaneously and effectively block T-ALL development. Given the extensive list of predictedmir-181ab1targets (Figure 6A and Table S3), we could not exhaustively identify all functional targets formir-181ab1in normal and T-ALL DP cells and therefore, loss ofmir-181ab1may also compromise other pathways that are required for NOTCH-induced T-ALL. A recent study by Cichocki et al.suggested that miR-181 might influence human natural killer cell development by targeting NLK, a negative regulator of WNT and NOTCH signaling [32]. We found that NLK mRNA is expressed in DP T-ALL cells. However, ICN1 expression did not change theNLKmRNA levels in DP cells and loss ofmir-181ab1did not alterNLKmRNA levels in DP cells (Table S2). Although these observations suggest that NLK might not be regulated by miR-181a in T-ALL cells at the mRNA level, it will be interesting to explore whether NLK is regulated by miR-181a at a translational level. Of note, according to various target prediction program [33,34] and functional analyses, miR-181a may regulate similar targets in human T-ALL cells (Figure 8), including Nrarp (Figure S7) and various phosphatase mRNAs. Many validated miR-181a targets in mouse cells Together, these findings illustrate that study of miRNA function in cancer will help to elucidate the molecular networks required for oncogenic transformation and shed insights into the downstream networks that can be targeted to inhibit tumor development.
Interestingly, our results showed that the miR-181 family miRNAs are not functionally equivalent during normal and T-ALL development even though all have the same seed nucleotides.
independent experiments shown). (B) Wild-type and mutant (red) miR-181a target sites in theNrarp39UTR (T1, T2, T3) and the predicted base pairings between mouseNrarpand miR-181a. (C) Functional regulation ofNrarpby miR-181a during early T cell development. TheNrarpgene with a wild-type full-length UTR (FLwt) or a full-length UTR with the miR-181a-binding site mutated (FLmut) were ectopically expressed in thymic progenitors and tested for effects on early thymocyte development (box plots, n = 48; replicates pooled from four independent experiments). (D) miR-181a-sensitive (ORF+39UTR) and miR-181a-insensitive (ORF only) phosphatases were ectopically expressed in thymic progenitors and cultured over OP9-DL1 stromal cells to examine their effects on DP development (*,p,0.0001). (E)NrarpshRNAs suppress expression of Nrarp protein as determined by western blot analyses. (F) Effects ofNrarpshRNAs on DP cell development in the OP9-DL1 assay (*,p,0.05). (G) Effects of shRNAs targetingSHP1,
SHP2,DUSP5orDUSP6on DP cell development in the OP9-DL1 assay. Data in (F) and (G) are displayed as a relative change in % DP in box plots (n = 12, representative of three independent experiments, *,p,0.0001). (H) Schematic diagram of the mechanism by which miR-181a may regulate normal T cell development.
Deletion ofmir-181ab2andmir-181cdhas different effects on T-ALL development, and neither allele could compensate for the loss of mir-181ab1(Figure 5, and Figure S3F, G). There are several likely causes of the differential effects of loss ofmir-181ab1,mir-181ab2and mir-181cdon normal DP cell development and ICN1-induced T-ALL development. First, differences in expression levels in DP leukemia
cells may contribute to their various effects on T-ALL development (Figure 5A, 5B). Second, their differential expression patterns in various thymic T cell populations may underlie their varied effects on normal thymocyte and T-ALL development [14–18]. Lastly, the extended nucleotide differences between miR-181a, miR-181b, miR-181c, and miR-181d and their coding genes may contribute to
Figure 8. Targets of miR-181a in T-ALL cells and the effects of miR-181a inhibition in T-ALL cells.(A) Western blot analyses were used to determine the levels of HA-tagged Nrarp protein in T6E cell lines expressing wild-type miR-181a or miR-181aSM
(normalized tob-actin loading control). (B–D) Levels of miR-181a target expression determined by (B) qPCR or (C) western blot analyses and (D)Notch1target expression in mock-treated T6E cells or cells mock-treated with 10mg/ml antagomir against miR-181a (Ant181a) or mismatch control (MM-Ant181a) for 48 hours (mean6SD,
n = 3, *p,0.05). (E and F) Effects of Ant181a and MM-Ant181a on T6E leukemia cell (E) proliferation and (F) apoptosis (mean6SD, n = 3, *,p,0.05). (G) Kaplan-Meier survival curves and the percentages of ICN1-infected DP cells show the effects of Nrarp target expression on ICN1-induced T-ALL development (5 mice/group). Sorted ICN1-BM cells from primary recipient mice were infected with the same titer of virus expressing eitherNrarp -FLmut
(miR-181a-insensitive) orNrarp-FLwt (miR-181a-sensitive) and transplanted into lethally irradiated recipients (5 mice/group). (H) Effects of
conditional deletion ofmir-181ab1on the T-ALL development at 2 weeks after leukemia induction (see also Figures S8A, B). Percentages of GFPlow and GFPlowDP cells in the peripheral blood of recipient mice transplanted with either ICN1:181ab1+/+/Cre-ER
BM cells or ICN1:181a1b1f/f/Cre-ER
BM cells were determined by FACS analyses (20 mice/group). Red arrow indicates the initiation of CreER-mediatedmir-181ab1deletion. (I and J) Effects of Ant181a and MM-Ant181a (25mg/ml) on human T-ALL DND41 cell (I) proliferation and (J) apoptosis after 96 h in culture (mean6SD, n = 4, *,
p,0.05). (K and L) Levels of (K) miR-181a targets and (L)Notch1target expression in DND41 cells treated with Ant181a (25mg/ml) for 48 hours (mean 6SD, n = 3, *p,0.05).
their varied effects on T-ALL development [21]. Further in-depth analyses will be needed to examine these possibilities and to elucidate the mechanisms through which various mir-181 alleles mediate differential activities during normal thymocytes and T-ALL development. Of interest, mice with all threemir-181alleles deleted could not be generated from crossing the single knockouts presumably due to early lethality (data not shown), suggesting that there might be toxicity if all three mir-181 alleles are targeted simultaneously for T-ALL treatment. Thus, the fact thatmir-181ab1, but not mir-181ab2 and mir-181cd, controls the development of normal DP cells and T-ALL DP cells suggests that specific targeting mir-181ab1may be an effective approach to inhibition of NOTCH-induced T-ALL development.
Methods
See Text S1 for more detailed descriptions.
Mice
C57BL/6J or 129/SvJ mice were obtained from Jackson Laboratory and maintained at the Stanford University Depart-ment of Comparative Medicine Animal Facility in accordance with National Institutes of Health guidelines. Knockout strains are maintained on either a 129 background or mixed B6.
Bone marrow transplantation
Hematopoietic stem/progenitor BM cells were isolated from mice treated with 5-fluorouracil (59FU) and infected with MigR1, ICN1, P12DP or ICN1:mir-181a-1retroviruses. Secondary trans-plantation was carried out by sorting GFP+DP+BM cells from
primary T-ALL recipient mice. A mixture of 16105infected cells and 16105 total BM cells (supporting cells) were intravenously injected into lethally irradiated (9.5 Gy) 129-strain recipient mice (,6 weeks old). To assess T-ALL development, peripheral blood samples were acquired from the recipient mice at various time points after transplantation and analyzed by FACS to determine the percentage of DP cells. The Kaplan-Meier estimator was used to determine the median rate of survival. The p values were determined using the Mantel-Cox test.
OP9-DL1 assay forin vitroT cell differentiation
Sorted or total thymocytes were cultured and differentiated on OP9-DL1 cells as described [20,21]. FACS analyses were carried out to determine the effects of miRNAs on DP thymocyte development. Anti-CD45 antibody staining and/or FSC/SSC gating were used to differentiate infected thymocytes and GFP+
stromal cells. The results are summarized in box-plots to describe the % DP cells from more than 12 replicate cultures. The ends of the boxes define the 25thand 75thpercentiles; a line indicates the median and bars define the 5thand 95thpercentiles. In some cases, the results were normalized so that the negative control had a median activity of 0 and the wild-typemir-181a-1expressing vector had a median activity of 1. Due to the heterogeneous nature of the thymic progenitor cells and intrinsic variation between the batches of mice used, normalization allowed for comparison among the independent repeats. Mann-Whitney rank sum tests were performed to determine statistical significance.
Microarray expression profiling and miRNA target analyses
Total RNAs were labeled using Illumina’s Total Prep RNA Amplification Kit and hybridized to Illumina MouseRef-8_V2 BeadChips according to the manufacturer’s instructions. Data were normalized using the quantile method (the Bioconductorlumi
package). SAM analyses were performed to select differentially expressed genes (.2-fold,p,0.01). Gene expression patterns were determined by hierarchical clustering with Pearson correlation as similarity metric. Heatmaps were generated with the Gplots R package. Ingenuity Pathways Analyses were carried out to determine the functional pathways within gene clusters. Gene set enrichment analyses (GSEA) were used to determine the effects of mir-181ab1 deletion on the gene sets up- or down-regulated by ICN1 in T-ALL DP cells (permutation = 1000). miR-181a targets with perfect ‘‘seed’’ matches were identified using TargetScans 5.1 (http://www.targetscan.org/), PicTar (http://pictar.mdc-berlin. de/) or miRanda (http://www.microrna.org/microrna/home. do). Alternatively, the m-fold program was used to identify putative miR-181a binding sites on selected target mRNAs. Sylamer analyses were carried out to determine the enrichment of seed matches among the genes up- or down-regulated in the absence of mir-181ab1 [35]. Control seeds were from other miRNAs in the miRBase (release 12).
Supporting Information
Figure S1 Generation of conditional mir-181 alleles by gene targeting in ES cells. (A–C) Schematic representation of the target strategies for generating conditional (A) mir-181a-1/b-1 (mir-181ab1), (B)mir-181a-2/b-2 (mir-181ab2)and (C)mir-181c/d (mir-181cd)alleles. Restriction enzyme sites and probes for Southern blot analyses are also indicated. DT: diphtheria toxin cassette. (D– F) Southern blot analyses of mouse embryonic stem cell clones with targeted (D) mir-181ab1, (E) mir-181ab2 and (F) mir-181c/d alleles. Genomic DNA from targeted ES clones was digested with BglII, EcoRV, and XbaI and probed with corresponding probes. (G) Schematics depicting the mir-181 loci and known protein-coding genes within the regions.
(PDF)
Figure S2 Effects of loss of mir-181ab1 on normal thymocyte development. (A and B) Representative FACS plots showing the effects ofmir-181ab1germline deletion on (A) DN T cell subsets and (B) ETPs. (C) Schematic of the modified OP9-DL1 co-culture assay. (D) Effects of seed mutations on miR-181a function in early thymocyte development (box plots, n = 12, representative of four experiments). Representative FACS plots are shown here. (E) Northern blot analyses of mature miRNA expression from the wild-type and seed mutant (SM) miR-181a expression constructs. (F and G) The effects ofmir-181ab1deletion on cellularity (F) and apoptosis (G) of the OP9-DL1 culture. (H) Deletion of the floxed mir-181a-1/b-1alleles by Cre/GFP virus expression determined by PCR analyses. (I) miR-181a expression in DP thymocytes infected with Cre/GFP viruses determined by miRNA qPCR analyses. (J) Down-regulation of miR-181a expression during DN3a to DN3b transition determined by miRNA qPCR analyses. (K) Intracellular TCR-b expression in DN3 populations and DN4 thymic progenitor populations before and aftermir-181ab1deletion. (PDF)
Figure S3 Effects of loss ofmir-181ab1on ICN1-induced T-ALL development. (A) Percentage of ICN1 infected cells (GFP+
) and percentage of DP leukemia cells among the ICN1-infected cells in the bone marrow of T-ALL mice at various time points after reconstitution determined by FACS analyses. Each line represents the changes in percent of GFP+
and GFP+
DP cells of individual recipient. (B–D) Percentage of GFP+
and GFP+
alleles (* p,0.05, **p,0.01, ***p,0.001). (E) Loss ofmir-181ab1 does not compromise the long-term reconstitution potential of hematopoietic stem/progenitor cells. FACS analyses of GFP+cells
in the peripheral blood of mice transplanted withmir-181ab1+/+
and mir-181a1b12/2bone marrow progenitor cells transduced with the control vector MigR1. (F and G) Effects of loss of (F)mir-181ab2and (G)mir-181cdalleles on the median survival of ICN1-induced T-ALL mice. Kaplan-Meier survival curves show the percentage of mice surviving at different time points after T-ALL induction (p.0.05). (H) Histological analysis (H&E staining) of T-ALL mice at 2 and 4 weeks after transplantation. Representative sections from BM, spleen and thymus of ICN1-induced T-ALL mice are shown. Bars equal 20 microns (bone marrow), 100 microns (spleen) and 200 microns (thymus). (I) FACS analyses were carried out to determine the changes in GFP expression levels in P12DP-infected PB cells from 3 to 21 weeks after transplantation for those two P12DP:181ab12/2T-ALL mice that died of T-ALL. (J) Compar-ison of ICN1 expression levels between ICN1:181ab1+/+
and ICN1:181ab12/2 BM cells in both GFPhigh and GFPlow cells population at 4weeks after transplantation. (K) Effects of loss of mir-181ab1on expression of Notch target genes (Hes1,Deltex1,Hey1) in DP leukemia cells as determined by qPCR analyses (mean6SD, n = 3, *p,0.05).
(PDF)
Figure S4 mir-181a1b1targets in normal thymic progenitors and T-ALL cells. (A) Schematic diagram of predicted miR-181a binding sites in mRNAs of some of the negative regulators of Notch signaling. Numb, Numb-like, Hes6, and LFNG are presented schematically to include the 59UTR (yellow), ORF (orange), and 39UTR (blue). The approximate locations of the predicted miR-181a pairing site is presented as a bold red line and numbered. Nucleotide numbers that define the three regions correspond to their respective GenBank accession number. (B) The coding regions of individual candidate targets, which lack all or a majority of predicted miR-181a binding sites, were expressed in thymic progenitors, and their effects on DP cell development were determined by using the OP9-DL1 assay. Representative FACS plots for Figure 7A are shown here. (C) Wild-type full-length (FLwt) and the mutant full-length (FLmut) Nrarp were expressed in thymic progenitors to determine the effects of these predicted miR-181a binding sites on early thymocyte development. Representative FACS plots for Figure 7C are shown here. (D) Constructs harboring the wild-type full-length (FLwt), the mutant full-length (FLmut), or the coding region (ORF) of Nrarp produce similar levels of Nrarp transcripts (determined by quantitative RT-PCR, mean 6 SD, n = 3). (E) The relative levels of miR-181a and its cognate targets in DN1–4 and DP thymocytes were determined by miRNA or mRNA qPCR analyses and normalized to the corresponding levels in DP cells (mean6 SD, n = 3). (F) miR-181a sensitive (ORF+39UTR) and insensitive (ORF only) phosphatases were ectopically expressed in thymic progenitors and cultured over OP9d stromal cells to examine their effects on DP development. Representative FACS plots for Figure 7D are shown.
(PDF)
Figure S5 Schematic diagram depicting the proposed model by which mir-181ab1 contributes to the leukemogenic potential of Notch oncogenes through damping the negative feedbacks in Notch and pre-TCR signaling pathways.
(PDF)
Figure S6 Overexpression of mir-181a-1 does not potentiate ICN1-induced T-ALL development. (A) The retroviral construct
used to co-express ICN1 andmir-181a-1. (B) Schematics depicting the experiment. (C) Kaplan-Meier survival curves show the percentages of mice surviving at different time points after reconstituting with BM cells infected with either ICN1/ mir-181a-1(n = 10 mice) or ICN1/mir-181a_sm (n = 10 mice) viruses. (D) Effects of mir-181a-1 overexpression on the percentage of total ICN1-infected cells (all GFP+
cells) and the percent of ICN1-infected DP leukemia cells (GFP+
DP cells). The p values were determined using the Mantel-Cox test (*,p,0.05).
(PDF)
Figure S7 Predicted base pairings between human Nrarp and miR-181a.
(PDF)
Figure S8 Inducible deletion ofmir-181ab1in ICN1-infected DP leukemia cells. (A) Schematics depicting a strategy for inducible deletion ofmir-181ab1in T-ALL mice. (B)mir-181ab1deletion was induced by intraperitoneal injection of tamoxifen (2 mg/kg) every 2 days during a 10-day period. (C) Deletion of mir-181ab1 in hematopoietic/lymphoid organs was confirmed by PCR analysis at 4, 7 and 12 days after the first tamoxifen injection. At 12 days after the first tamoxifen injection, mir-181ab1 was deleted from bone marrow, spleen, lymph node and thymus cells.
(PDF)
Table S1 List of hematopoietic and lymphoid populations examined by FACS analyses.
(XLS)
Table S2 Raw data of gene expression profiling of wild-type DP, ICN1-DP, and ICN1_DP_181KO cells. Three independent biological replicates for wild-type DP, ICN1-DP, and ICN1_DP_181KO cells were isolated by FACS sorting from control and ICN1-induced T-ALL recipient mice at 4 weeks after transplantation. Gene expression profiles of the wild-type DP, ICN1-DP, and ICN1_DP_181KO cells were determined by using the Illumina mouse Ref-8_V2 BEADCHIP array.
(XLS)
Table S3 Complete list of ICN1-regulated genes and their differential expression in the absence of mir-181ab1. Hierarchical clustering analyses clustered this set of genes into four groups (I, II, III, IV). Ingenuity Pathways Analyses (Ingenuity Systems, www. ingenuity.com) were carried out to determine whether these genes belong to over-represented canonical pathways (p,0.01). miRNA target prediction analyses were also carried out using TargetScan and PicTar and miRanda. The results of pathway and target analyses were denoted as ‘‘1’’ if positive and ‘‘0’’ if negative. (XLS)
Text S1 Supplemental results and supplemental experimental procedures.
(DOC)
Acknowledgments
We thank the members of Chen lab for comments and discussions and Christopher P. Arnold for primary miR-181 probes.
Author Contributions
References
1. He L, Thomson JM, Hemann MT, Hernando-Monge E, Mu D, et al. (2005) A microRNA polycistron as a potential human oncogene. Nature 435: 828–833. 2. Mavrakis KJ, Van Der Meulen J, Wolfe AL, Liu X, Mets E, et al. (2011) A cooperative microRNA-tumor suppressor gene network in acute T-cell lymphoblastic leukemia (T-ALL). Nat Genet.
3. Costinean S, Zanesi N, Pekarsky Y, Tili E, Volinia S, et al. (2006) Pre-B cell proliferation and lymphoblastic leukemia/high-grade lymphoma in E(mu)-miR155 transgenic mice. Proc Natl Acad Sci U S A 103: 7024–7029. 4. Medina PP, Nolde M, Slack FJ (2010) OncomiR addiction in an in vivo model of
microRNA-21-induced pre-B-cell lymphoma. Nature 467: 86–90.
5. Kota J, Chivukula RR, O’Donnell KA, Wentzel EA, Montgomery CL, et al. (2009) Therapeutic microRNA delivery suppresses tumorigenesis in a murine liver cancer model. Cell 137: 1005–1017.
6. Li X, Sanda T, Look AT, Novina CD, von Boehmer H (2011) Repression of tumor suppressor miR-451 is essential for NOTCH1-induced oncogenesis in T-ALL. J Exp Med 208: 663–675.
7. Hatley ME, Patrick DM, Garcia MR, Richardson JA, Bassel-Duby R, et al. (2010) Modulation of K-Ras-dependent lung tumorigenesis by MicroRNA-21. Cancer Cell 18: 282–293.
8. Berger AH, Knudson AG, Pandolfi PP (2011) A continuum model for tumour suppression. Nature 476: 163–169.
9. Salmena L, Poliseno L, Tay Y, Kats L, Pandolfi PP (2011) A ceRNA hypothesis: the Rosetta Stone of a hidden RNA language? Cell 146: 353–358.
10. Pear WS, Aster JC, Scott ML, Hasserjian RP, Soffer B, et al. (1996) Exclusive development of T cell neoplasms in mice transplanted with bone marrow expressing activated Notch alleles. J Exp Med 183: 2283–2291.
11. Weng AP, Ferrando AA, Lee W, Morris JPt, Silverman LB, et al. (2004) Activating mutations of NOTCH1 in human T cell acute lymphoblastic leukemia. Science 306: 269–271.
12. Smith MA (2009) Update on developmental therapeutics for acute lymphoblastic leukemia. Curr Hematol Malig Rep 4: 175–182.
13. Pui JC, Allman D, Xu L, DeRocco S, Karnell FG, et al. (1999) Notch1 expression in early lymphopoiesis influences B versus T lineage determination. Immunity 11: 299–308.
14. Landgraf P, Rusu M, Sheridan R, Sewer A, Iovino N, et al. (2007) A mammalian microRNA expression atlas based on small RNA library sequencing. Cell 129: 1401–1414.
15. Chen CZ, Li L, Lodish HF, Bartel DP (2004) MicroRNAs modulate hematopoietic lineage differentiation. Science 303: 83–86.
16. Li QJ, Chau J, Ebert PJ, Sylvester G, Min H, et al. (2007) miR-181a Is an Intrinsic Modulator of T Cell Sensitivity and Selection. Cell 129: 147–161. 17. Kuchen S, Resch W, Yamane A, Kuo N, Li Z, et al. (2010) Regulation of
microRNA expression and abundance during lymphopoiesis. Immunity 32: 828–839.
18. Schotte D, Chau JC, Sylvester G, Liu G, Chen C, et al. (2009) Identification of new microRNA genes and aberrant microRNA profiles in childhood acute lymphoblastic leukemia. Leukemia 23: 313–322.
19. Allman D, Sambandam A, Kim S, Miller JP, Pagan A, et al. (2003) Thymopoiesis independent of common lymphoid progenitors. Nat Immunol 4: 168–174.
20. Schmitt TM, de Pooter RF, Gronski MA, Cho SK, Ohashi PS, et al. (2004) Induction of T cell development and establishment of T cell competence from embryonic stem cells differentiated in vitro. Nat Immunol 5: 410–417. 21. Liu G, Min H, Yue S, Chen CZ (2008) Pre-miRNA loop nucleotides control the
distinct activities of mir-181a-1 and mir-181c in early T cell development. PLoS ONE 3: e3592. doi:10.1371/journal.pone.0003592
22. Campese AF, Garbe AI, Zhang F, Grassi F, Screpanti I, et al. (2006) Notch1-dependent lymphomagenesis is assisted by but does not essentially require pre-TCR signaling. Blood 108: 305–310.
23. Maillard I, Tu L, Sambandam A, Yashiro-Ohtani Y, Millholland J, et al. (2006) The requirement for Notch signaling at the beta-selection checkpoint in vivo is absolute and independent of the pre-T cell receptor. J Exp Med 203: 2239– 2245.
24. Allman D, Karnell FG, Punt JA, Bakkour S, Xu L, et al. (2001) Separation of Notch1 promoted lineage commitment and expansion/transformation in developing T cells. J Exp Med 194: 99–106.
25. Chiang MY, Xu L, Shestova O, Histen G, L’Heureux S, et al. (2008) Leukemia-associated NOTCH1 alleles are weak tumor initiators but accelerate K-ras-initiated leukemia. J Clin Invest 118: 3181–3194.
26. Yun TJ, Bevan MJ (2003) Notch-regulated ankyrin-repeat protein inhibits Notch1 signaling: multiple Notch1 signaling pathways involved in T cell development. J Immunol 170: 5834–5841.
27. Ciofani M, Schmitt TM, Ciofani A, Michie AM, Cuburu N, et al. (2004) Obligatory role for cooperative signaling by pre-TCR and Notch during thymocyte differentiation. J Immunol 172: 5230–5239.
28. van Es JH, van Gijn ME, Riccio O, van den Born M, Vooijs M, et al. (2005) Notch/gamma-secretase inhibition turns proliferative cells in intestinal crypts and adenomas into goblet cells. Nature 435: 959–963.
29. Medyouf H, Alcalde H, Berthier C, Guillemin MC, dos Santos NR, et al. (2007) Targeting calcineurin activation as a therapeutic strategy for T-cell acute lymphoblastic leukemia. Nat Med 13: 736–741.
30. Weng AP, Nam Y, Wolfe MS, Pear WS, Griffin JD, et al. (2003) Growth suppression of pre-T acute lymphoblastic leukemia cells by inhibition of notch signaling. Mol Cell Biol 23: 655–664.
31. Hochstenbach F, Brenner MB (1989) T-cell receptor delta-chain can substitute for alpha to form a beta delta heterodimer. Nature 340: 562–565.
32. Cichocki F, Felices M, McCullar V, Presnell SR, Al-Attar A, et al. Cutting edge: microRNA-181 promotes human NK cell development by regulating Notch signaling. J Immunol 187: 6171–6175.
33. Lewis BP, Burge CB, Bartel DP (2005) Conserved seed pairing, often flanked by adenosines, indicates that thousands of human genes are microRNA targets. Cell 120: 15–20.
34. Kertesz M, Iovino N, Unnerstall U, Gaul U, Segal E (2007) The role of site accessibility in microRNA target recognition. Nat Genet 39: 1278–1284. 35. van Dongen S, Abreu-Goodger C, Enright AJ (2008) Detecting microRNA