Identification of Reference Genes for Relative
Quantification of Circulating MicroRNAs in
Bovine Serum
In-Seon Bae1, Ki Yong Chung2, Jongmin Yi1, Tae Il Kim2, Hwa-Sik Choi3, Young-Moo Cho2, Inho Choi4, Sang Hoon Kim1*
1Department of Biology, Kyung Hee University, Seoul, Republic of Korea,2National Institute of Animal Science, RDA, Pyeongchang, Gangwon, Republic of Korea,3Department of Biomedical Laboratory Science, Shinhan University, Uijeongbu, Gyeonggi, Republic of Korea,4Bovine Genome Resources Bank, School of Biotechnology, Yeungnam University, Gyeongsan, Gyeongbuk, Republic of Korea
Abstract
Circulating microRNAs in body fluids have been implicated as promising biomarkers for physiopathology disorders. Currently, the expression levels of circulating microRNAs are estimated by reverse transcription quantitative real-time polymerase chain reaction. Use of appropriate reference microRNAs for normalization is critical for accurate microRNA ex-pression analysis. However, no study has systematically investigated reference genes for evaluating circulating microRNA expression in cattle. In this study, we describe the identifi-cation and characterization of appropriate reference microRNAs for use in the normalization of circulating microRNA levels in bovine serum. We evaluated the expression stability of ten candidate reference genes in bovine serum by using reverse transcription quantitative real-time polymerase chain reaction. Data were analyzed using geNorm, NormFinder, and Best-Keeper statistical algorithms. The results consistently showed that a combination of miR-93 and miR-127 provided the most stably expressed reference. The suitability of these micro-RNAs was validated, and even when compared among different genders or breeds, the combination of miR-93 and miR-127 was ranked as the most stable microRNA reference. Therefore, we conclude that this combination is the optimal endogenous reference for re-verse transcription quantitative real-time polymerase chain reaction-based detection of microRNAs in bovine serum. The data presented in this study are crucial to successful bio-marker discovery and validation for the diagnosis of physiopathological conditions in cattle.
Introduction
MicroRNAs (miRNAs) are small non-coding RNAs, which are widely expressed in the genomes of plants, animals, and humans [1]. Recent studies have demonstrated that serum and plasma contain large amounts of miRNAs, which are stabilized and protected from RNAse degradation by inclusion in various protein complexes, microvesicles, or exosomes [2–4]. Circulating
a11111
OPEN ACCESS
Citation:Bae I-S, Chung KY, Yi J, Kim TI, Choi H-S, Cho Y-M, et al. (2015) Identification of Reference Genes for Relative Quantification of Circulating MicroRNAs in Bovine Serum. PLoS ONE 10(3): e0122554. doi:10.1371/journal.pone.0122554
Academic Editor:Marta Letizia Hribal, University of Catanzaro Magna Graecia, ITALY
Received:October 18, 2014
Accepted:February 22, 2015
Published:March 31, 2015
Copyright:© 2015 Bae et al. This is an open access article distributed under the terms of theCreative Commons Attribution License, which permits unrestricted use, distribution, and reproduction in any medium, provided the original author and source are credited.
Data Availability Statement:All relevant data are within the paper and its Supporting Information files.
Funding:This research was supported by a grant from the Next-Generation BioGreen 21 program (No. PJ008191), Rural Development Administration, Republic of Korea. The funders had no role in study design, data collection and analysis, decision to publish, or preparation of the manuscript.
miRNAs have the potential to serve as biomarkers for changes in physiological conditions such as pregnancy and in pathological conditions such as cancer, diabetes, and other diseases. There-fore, it is important to measure miRNA expression in the blood with high accuracy.
Quantitative real-time PCR (qRT-PCR) is currently the most frequently used approach for the evaluation of circulating miRNAs [5–7]. Due to its high sensitivity, specificity, good repro-ducibility, and cost-effectiveness, this is a powerful technique for measuring the expression profile of miRNAs. The accuracy of qRT-PCR-based miRNA expression analysis depends on an appropriate normalization by using reference genes. Thus, the optimal selection of genes to be used for normalization is critical for qRT-PCR data analysis.
In miRNA expression studies, the most commonly used reference genes are ribosomal RNAs such as 5S RNA and small nuclear RNAs like RNU6B. However, 5S RNA and RNU6B are de-graded in some serum samples [8–10]. Endogenous miRNAs in solid tissues have been used as reference miRNAs. For instance, miR-23a and miR-191 are used for normalization in profiling studies of human cervical tissues [9], and let-7a and miR-16 are selected as reference genes in human breast cancer tissues [11]. However, in livestock, few studies have been described so far, with the exception of studies using porcine tissues where miR-93, miR-25, miR-106a, miR-17-5p, and miR-26a have been reported as stable reference miRNAs [12–13]. In the case of circulat-ing miRNAs, endogenous normalizers have been well studied in humans and mice. For exam-ple, miR-146a, miR-16, miR-195, miR-30e, and miR-744 are stably expressed in mouse serum [4], and miR-16 is used as an internal normalizer in the serum of human B-cell lymphoma and colorectal cancer patients [14,15]. In addition, the combination of let-7d, let-7g, and let-7i was recently reported as a normalizer of human serum miRNAs [16]. To date, no study has reported endogenous normalizers for circulating miRNAs in cattle. However, quantification of miRNA levels in bovine blood is essential for gaining further insight into their biological function and investigating potential biomarkers for bovine disease and traits of economic importance.
In the present study, we determined optimal reference miRNAs to be used for normalization of qRT-PCR data in bovine serum samples. We first identified invariant miRNAs as candidate reference miRNAs whose expression levels were stable in bovine serum. Appropriate reference miRNAs were identified by using geNorm, NormFinder, and BestKeeper statistical algorithms. In this study, we show that the combination of miR-93 and miR-127 serves as a stable reference in bovine serum for the normalization of circulating miRNAs.
Materials and Methods
Serum sample preparation
Blood samples of Korean native cattle (n = 33) and Holstein dairy cows (n = 16) were collected at National Institute of Animal Sciences, Suwon, Korea. All experimental involving live animals were approved by the Animal Care and Use Committee in National Institute of Animal Sci-ences of Rural Development Administration, Korea. For breed miRNA study, bovine serum was collected from steer (n = 14), bull (n = 9), and heifer (n = 10) of Korean native cattle. Sam-ples were centrifuged at 5,000 rpm for 20 min at 4°C. The supernatant was removed and stored at−80°C until analysis. The degree of hemolysis in serum was analyzed by using spectropho-tometry at 414 nm wavelength. Samples were classified to be hemolyzed when exceeded 0.2 value at 414 nm measurement.
Extraction of miRNA, cDNA preparation, and qRT-PCR
Samples were thawed on ice, and miRNA was extracted using a serum miRNA purification kit (Genolution Inc., Seoul, Republic of Korea) by following the manufacturer’s instructions. The quantity and purity of extracted miRNA were estimated by monitoring both the absorbance at
260 nm and the 260/280 nm ratio. Next, 0.1μg of RNA per sample was reverse-transcribed to
cDNA with a miScript Reverse Transcription Kit (Qiagen, Hilden, Germany). This cDNA was then diluted 1:20 in water, after which 2μl was used for quantitative PCR by using the miScript
SYBR Green Kit (Qiagen, Hilden, Germany) with a Rotor-Gene Q PCR instrument (Qiagen, Hilden, Germany). Primers for mature reference miRNAs were obtained from Qiagen (Hilden, Germany). The reaction was performed at 94°C for 15 min, followed by 40 cycles of 94°C for 15 sec, 55°C for 30 sec, and 70°C for 20 sec. PCR efficiency (E) for each miRNA was deter-mined with the slope of a linear regression model by using Cq values and the following equa-tion: E = [10(1/-slope)−1] × 100%.
Data analysis for miRNA stability
To assess the stability of candidate reference miRNAs, statistical algorithms including geNorm, NormFinder, and BestKeeper were utilized. The geNorm program is based on the mean pair-wise variation for a given gene compared to the remaining tested genes, which are to calculate an M value as a gene expression stability factor [17–19]. The reference gene combination was calculated by geometric mean of their expression levels [17]. NormFinder is an ANOVA-based model to provide direct measure of intra- and inter-group variation in expression for each gene [20,21]. BestKeeper program is used to determine the geometric mean and standard devi-ation of the Cq values of the candidate genes by pairwise correldevi-ation analyses [22].
Statistical analysis
Statistical analyses were performed with SPSS 18 statistical software (SPSS Inc., Chicago, IL, USA). One-way ANOVA was used to determine differences in the relative expression levels of miRNAs among different groups.
Results
Expression levels of candidate reference miRNAs
For the evaluation of potential endogenous normalizers in bovine serum, ten candidate refer-ence miRNAs were selected from other species and our preliminary next-generation sequenc-ing. Nine miRNAs out of ten candidate reference miRNAs have been described in the literature as reference miRNAs in other species [4,5,8,9,11–13]. miR-127 was selected from our prelim-inary next-generation sequencing for the profiling of bovine skeletal muscle. The performance of each primer pair was tested by qRT-PCR. The amplification efficiencies for the ten primers ranged from 93.07% to 103.53%, according to the slopes of the standard curves (S1 Table). Melting curve analysis confirmed the presence of a single PCR product with a single peak from all samples, indicating that all the primers used are highly specific and efficient for
qRT-PCR amplification.
other genes. Calculating the Cq value is important to select the endogenous reference standard. However, simple comparison of the raw Cq data for candidate reference miRNAs does not pro-vide enough information. Therefore, we conducted additional analysis by using three different statistical algorithms for validation of reference miRNAs.
Expression stability of candidate reference miRNAs
Three distinct statistical algorithms, geNorm, NormFinder, and BestKeeper, were used to as-sess the stability of the candidate reference miRNAs. geNorm represents the average expression stability of candidate genes with M values. The larger the M value, the lower the stability.
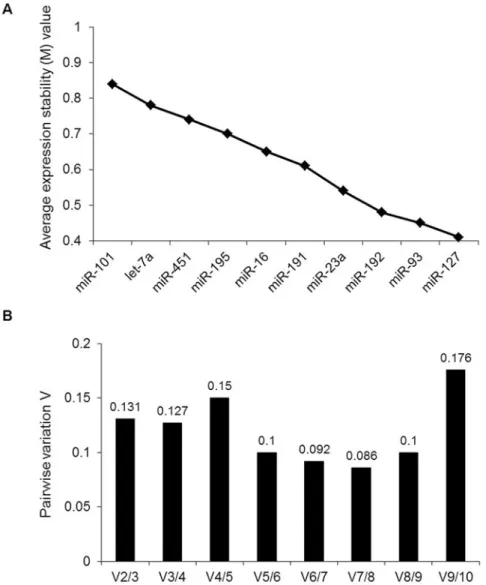
Fig 2Ashows the results of geNorm analysis of all ten candidates. As shown, miR-127 (M = 0.41) and 93 (M = 0.45) were the most stable miRNAs, followed by 192, miR-23a, miR-191, miR-16, miR-195, miR-451, let-7a, and miR-101. geNorm also presents the opti-mal number of reference genes required for accurate noropti-malization. For pairwise variation Vn/Vn+1, 0.15 is the proposed cut-off value. A Vn/Vn+1 value less than 0.15 implies that the top n reference genes are sufficient as internal controls. In our study, the V2/3 value was 0.131 (Fig 2B), suggesting that the top two reference miRNAs (miR-127 and miR-93) would be ade-quate for normalization, and the additional third miRNA is not necessary.
Subsequently, the expression data were analyzed with NormFinder. This program ranked the candidate miRNAs based on intra- and inter-group variations, with a lower stability value
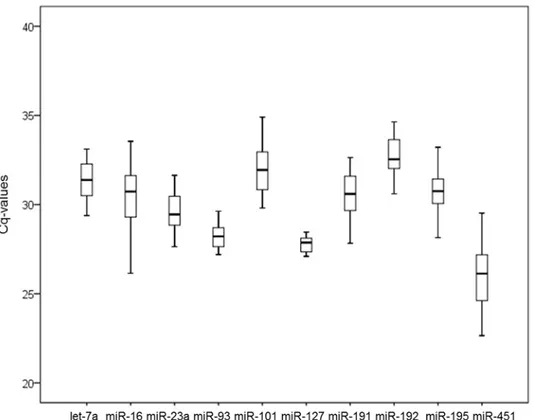
Fig 1. Expression levels of candidate reference miRNAs in bovine serum.The expression levels of ten candidate miRNAs were validated in bovine serum. Box plots of raw Cq values were produced. Boxes represent the lower and upper quartiles with median (n = 34). Values are given as real-time PCR cycle threshold numbers. Box and whisker plot displaying the range of Cq values for each putative reference miRNA. The median is marked by the middle line in the box. The boxes represent the 25th and 75th percentiles, and ranges are represented by the whiskers.
doi:10.1371/journal.pone.0122554.g001
indicating more stable expression. As shown inFig 3, NormFinder ranked the ten candidate miRNAs from lowest to highest stability value as follows: 127, 93, 192, miR-191, miR-23a, let-7a, miR-16, miR-195, miR-451, and miR-101. Like geNorm, NormFinder also identified miR-127 and miR-93 as the most stably expressed miRNAs in all samples, with miR-101 being the least stably expressed. Only small differences in the rankings calculated by the two programs were observed: miR-191 and let-7a were ranked fifth and ninth in geNorm, while they were ranked fourth and sixth in NormFinder, respectively.
BestKeeper analyzes gene expression variation for candidate genes by calculating standard deviation (SD) and a pairwise correlation. The lowest SD value indicates the most stable refer-ence miRNA expression. As shown inTable 1, miR-127 and miR-93 were the most stably ex-pressed genes with the lowest SDs (0.27 and 0.46, respectively). In this respect, the results obtained through the BestKeeper program were consistent with those obtained through the
Fig 2. geNorm analysis of qRT-PCR of candidate reference genes.(A) Ranking of candidate reference genes according to average expression stability (M value). The x-axis from left to right indicates the ranking of the genes according to their expression stability. (B) Determination of the optimal number of reference genes for normalization. The software calculates the normalization factor from at least two genes; the variable V defines the pairwise variation between two sequential normalization factors.
geNorm and NormFinder analyses. An overall ranking of candidate reference miRNAs was ob-tained and the recommended comprehensive rankings are given inTable 1. 127 and miR-93 represent the most adequate normalization candidate miRNAs tested in this study.
Expression levels of candidate miRNAs in hemolyzed bovine serum
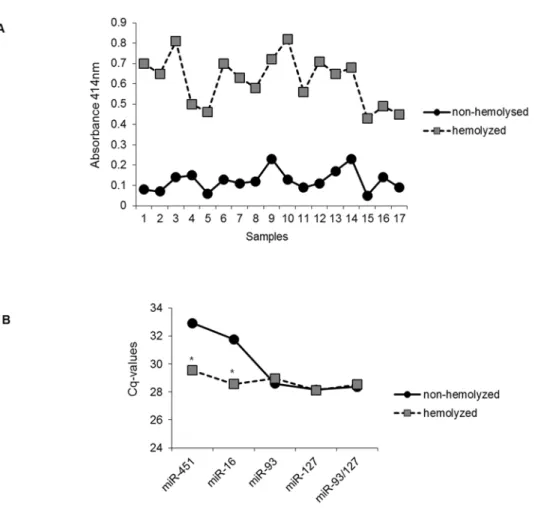
During the preparation of bovine serum from whole blood, some serum samples exhibited pink or red discoloration, apparently from hemolysis, which may have affected the level of miRNAs in the serum. In our study, we determined the expression levels of potential candidate reference miRNAs in hemolyzed serum compared to non-hemolyzed serum. Firstly, we ob-served whether bloods tested were hemolyzed by spectrophotometry. As shown inFig 4A, he-molyzed samples showed high absorbance values at 414 nm, indicating the presence of free hemoglobin [23–25]. Since miR-451 and miR-16 are highly expressed in human hemolyzed blood [25], we also determined their levels in bovine serum. As expected, their expressions were strongly detected in hemolyzed serum compared to non-hemolyzed serum. However, the
Fig 3. Stability values of each reference miRNA from the NormFinder algorithm.Ranking of candidate reference genes based on stability values calculated by NormFinder.
doi:10.1371/journal.pone.0122554.g003
Table 1. Ranking of candidate miRNAs according to their stability value by using geNorm, NormFinder, and BestKeeper statistical algorithms.
Name geNorm NormFinder BestKeeper Consensus
Stability value Rank Stability value Rank SD1 Rank
let-7a 0.78 9 0.045 6 1.37 9 9
miR-16 0.65 6 0.046 7 1.27 8 6
miR-23a 0.54 4 0.035 5 0.94 4 4
miR-93 0.45 2 0.020 2 0.46 2 2
miR-101 0.84 10 0.060 10 1.62 10 10
miR-127 0.41 1 0.015 1 0.27 1 1
miR-191 0.61 5 0.034 4 1.11 6 5
miR-192 0.48 3 0.028 3 0.85 3 3
miR-195 0.7 7 0.046 8 1.08 5 7
miR-451 0.74 8 0.052 9 1.141 7 8
1SD, standard deviation
doi:10.1371/journal.pone.0122554.t001
levels of miR-127, miR-93, and a combination of the two (miR-93/miR-127) were not different in hemolyzed serum samples compared to non-hemolyzed serum samples (Fig 4B). Therefore, we conclude that the combination of miR-93 and miR-127 serves as an adequate reference in bovine serum regardless of hemolysis.
Validation of candidate reference miRNAs
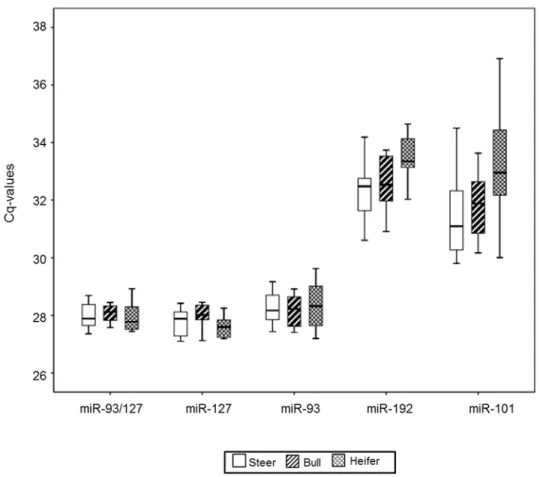
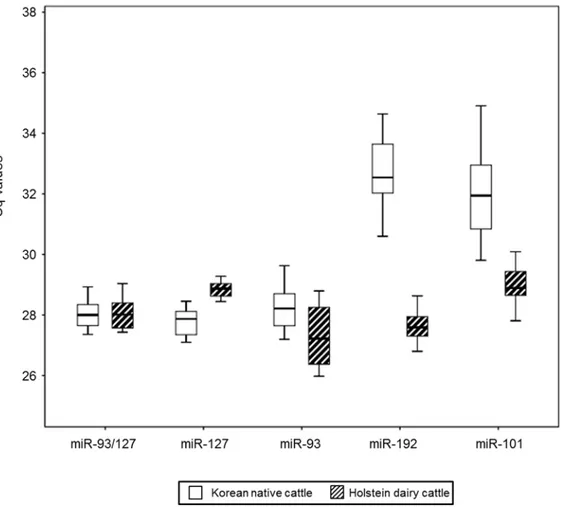
To validate further the stability of miR-93, miR-127, and the combination of these two as refer-ence miRNAs, we investigated their expression levels in bovine serum derived from different genders and breeds. First, the levels of candidate miRNAs were analyzed in steer, bull, and heif-er sheif-erum. miR-93, miR-127, and miR-93/miR-127 wheif-ere the most highly expressed in all gen-ders, when compared to miR-192 and miR-101 (Fig 5). The Cq value ranges of miR-127 and miR-93/miR-127 were 1.36 and 1.57, respectively. Standard deviation within different gender groups for miR-93, miR-127, and miR-93/miR-127 was less than 1 (S2 Table). Between differ-ent gender groups, miR-92/miR-127 showed the least variation, with a p-value of 0.859, the highest value among all the candidate miRNAs. In addition, within different breeds (Holstein dairy cows and Korean native cattle), miR-127 and miR-93/miR-127 had standard deviations of less than 1 (Fig 6andS3 Table). Only miR-93/miR-127 showed no statistical difference
Fig 4. Evaluation of potential reference miRNAs in hemolyzed bovine serum.(A) The absorbance values at 414nm of hemolyzed and non-hemolyzed serum were measured to determine levels of free hemoglobin. (B) Levels of miR-16, miR-451, miR-93, miR-127, and the combination miR-93/miR-127 were measured in a cohort of non-hemolyzed samples (circles, n = 17) and hemolyzed samples (squares, n = 17). Statistical analysis was performed using Student’st-test.*p<0.05.
between breeds (p = 0.85). The Cq value range of miR-93/miR-127 in bovine serum extracted from different breeds was the narrowest among the candidate miRNAs. Based on data from different genders and breeds, the combination miR-93/miR-127 is recommended as the opti-mal reference for miRNAs in bovine serum.
Discussion
qRT-PCR is a popular tool for accurate miRNA expression profiling [7,26–28]. Optimal nor-malization of qRT-PCR data is crucial under different biological conditions [6–7,29–30]. Cir-culating miRNAs in body fluid can remain stable not only in the RNase-rich environment of the blood but also in harsh conditions, including boiling temperatures, high or low pH, extend-ed periods of storage, and multiple freeze-thaw cycles [31,32]. Numerous RNA species, includ-ing rRNA, snRNA, and synthetic miRNAs as spike-in controls, have been used as normalizers [26]. However, there is disagreement regarding the abundance and stability of rRNAs and snRNAs in body fluids, and spike-in controls may not correct for the variation arising from dif-ferences in template quality and efficiency of the reverse transcription reaction. In addition, miR-191 and miR-103 have been used as endogenous reference miRNAs in human tissues [8]; however, in our study, 191 failed to meet the endogenous normalizer criteria, and miR-103 was expressed at a low level in bovine serum. Thus, endogenous miRNAs for solid tissues
Fig 5. Levels of candidate reference miRNAs among different genders.qRT-PCR experiments were performed on steer serum (steer; n = 14), bull serum (bull; n = 10), and heifer serum (heifer; n = 9). Boxes (blank for steer, diagonal lines for bull, and diamonds for heifer) represent lower and upper quartiles with median.
doi:10.1371/journal.pone.0122554.g005
may not be suitable for bovine serum. In our study, we presented the combination of miR-93/ miR-127 as the optimal reference in bovine serum. The expression of this combination was not affected by differences in breed or gender, whereas the individual expressions of miR-93 and miR-127 showed statistical differences within breed groups, indicating that the selection of a single reference miRNA may be not adequate. It is known that a combination of miRNAs is more stable and accurate for normalization than a single reference miRNA [17]. The combina-tion of miR-16 and miR-93 is an adequate reference in human gastric cancer samples [5], and a combination of let-7d, let-7g, and let-7i in human serum is superior to the other single refer-ence genes commonly used for normalization [16]. In mice, 146a, 16, 195, miR-30, and miR-744 have been reported as reference miRNAs in blood [4]. Although previously no study has been carried out for miR-127 and miR-93 in bovine serum, miR-127 is expressed differently between mature and premature oocytes [33], and the level of miR-93 expression de-pends on the thickness of backfat [34]. These data suggest that miR-93 and miR-127 might not be stably expressed in cattle tissues and are only adequate as reference genes for bovine serum.
Hemolysis can occur in most of the steps carried out during blood sampling and handling procedures. Recent studies have shown that hemolysis occurring during blood collection has a substantial impact on the miRNA content in blood [23–25]. miR-451 and miR-16 exist abun-dantly in human red blood cells [25]. Since these miRNAs could be affected by disease, tissue
Fig 6. Expression levels of candidate reference miRNAs among different breeds.qRT-PCR analysis was conducted on bovine serum derived from Korean native cattle (n = 34) and Holstein dairy cattle (n = 16). Values are given as real-time PCR cycle threshold numbers (Cq values). Boxes (blank for Korean native cattle and diagonal lines for Holstein dairy cows) represent lower and upper quartiles with median.
or organ damage, and natural variation, they are not suitable as serum reference miRNAs [35]. In our study, the expression levels of miR-451 and miR-16 were higher in hemolyzed serum than in non-hemolyzed serum, whereas the level of miR-93/miR-127 in bovine serum did not vary regardless of hemolysis, indicating that this combination may be optimal as a reference in bovine whole blood cells.
In summary, our results show that the combination miR-93/miR-127 is stably expressed in bovine serum and is an adequate endogenous miRNA reference for RT-qPCR-based detection. This finding could contribute to the evaluation of the levels of miRNAs associated with bovine disease and economic traits as blood metabolites.
Supporting Information
S1 Table. PCR efficiency of candidate reference miRNAs.
(DOCX)
S2 Table. Cq values of validated reference genes under different gender conditions.
(DOCX)
S3 Table. Cq values of validated reference genes when evaluated among different breeds.
(DOCX)
Author Contributions
Conceived and designed the experiments: ISB SHK. Performed the experiments: ISB JY. Ana-lyzed the data: ISB KYC HSC IC SHK. Contributed reagents/materials/analysis tools: KYC TIK HSC YMC IC. Wrote the paper: ISB SHK.
References
1. Bartel DP (2004) MicroRNAs: Genomics, biogenesis, mechanism, and function. Cell 116: 281–297. PMID:14744438
2. Arroyo JD, Chevillet JR, Kroh EM, Ruf IK, Pritchard CC, Gibson DF, et al. (2011) Argonaute2 com-plexes carry a population of circulating microRNAs independent of vesicles in human plasma. Proc Natl Acad Sci USA 108: 5003–5008. doi:10.1073/pnas.1019055108PMID:21383194
3. Wang K, Zhang S, Weber J, Baxter D, Galas DJ (2010) Export of microRNAs and microRNA-protective protein by mammalian cells. Nucleic Acids Res 38: 7248–7259. doi:10.1093/nar/gkq601PMID: 20615901
4. Mi QS, Weiland M, Qi RQ, Gao XH, Poisson LM, Zhou L (2012) Identification of mouse serum miRNA endogenous references by global gene expression profiles. PLoS One 7: e31278. doi:10.1371/ journal.pone.0031278PMID:22348064
5. Song J, Bai Z, Han W, Zhang J, Meng H, Bi J, et al. (2012) Identification of suitable reference genes for qPCR analysis of serum microRNA in gastric cancer patients. Dig Dis Sci 57: 897–904. doi:10.1007/ s10620-011-1981-7PMID:22198701
6. Jin XF, Wu N, Wang L, Li J (2013) Circulating microRNAs: A novel class of potential biomarkers for di-agnosing and prognosing central nervous system diseases. Cell Mol Neurobiol 33: 601–613. doi:10. 1007/s10571-013-9940-9PMID:23633081
7. Kang K, Peng X, Luo J, Gou D (2012) Identification of circulating miRNA biomarkers based on global quantitative real-time PCR profiling. J Anim Sci Biotechnol 3: 4-1891-3-4.
8. Peltier HJ, Latham GJ (2008) Normalization of microRNA expression levels in quantitative RT-PCR as-says: Identification of suitable reference RNA targets in normal and cancerous human solid tissues. RNA 14: 844–852. doi:10.1261/rna.939908PMID:18375788
9. Shen Y, Li Y, Ye F, Wang F, Wan X, Lu W, et al. (2011) Identification of miR-23a as a novel microRNA normalizer for relative quantification in human uterine cervical tissues. Exp Mol Med 43: 358–366. PMID:21519184
10. Mestdagh P, Van Vlierberghe P, De Weer A, Muth D, Westermann F, Speleman F, et al. (2009) A novel and universal method for microRNA RT-qPCR data normalization. Genome Biol 10: R64-2009-10-6-r64.
11. Rater N, Meyer HA, Jung M, Mollenkopf HJ, Wanger I, Miller K, et al. (2012) Reference miRNAs for miRNAome analysis of urothelial carcinomas. PLoS One 7:e39309. doi:10.1371/journal.pone. 0039309PMID:22745731
12. Gu Y, Li M, Zhang K, Chen L, Jiang AA, Wang J, et al. (2011) Identification of suitable endogenous con-trol microRNA genes in normal pig tissues. Anim Sci J 82: 722–728. doi:10.1111/j.1740-0929.2011. 00908.xPMID:22111626
13. Timoneda O, Balcells I, Cordoba S, Castello A, Sanchez A (2012) Determination of reference micro-RNAs for relative quantification in porcine tissues. PLoS One 7: e44413. doi:10.1371/journal.pone. 0044413PMID:22970213
14. Huang Z, Huang D, Ni S, Peng Z, Sheng W, Du X (2010) Plasma microRNAs are promising novel bio-markers for early detection of colorectal cancer. Int J Cancer 127: 118–126. doi:10.1002/ijc.25007 PMID:19876917
15. Lawrie CH, Gal S, Dunlop HM, Pushkaran B, Liggins AP, Pulford K, et al. (2008) Detection of elevated levels of tumour-associated microRNAs in serum of patients with diffuse large B-cell lymphoma. Br J Haematol 141: 672–675. doi:10.1111/j.1365-2141.2008.07077.xPMID:18318758
16. Chen X, Liang H, Guan D, Wang C, Hu X, Cui L, et al. (2013) A combination of let-7d, let-7g and let-7i serves as a stable reference for normalization of serum microRNAs. PLoS One 8: e79652. doi:10. 1371/journal.pone.0079652PMID:24223986
17. Vandesompele J, De Preter K, Pattyn F, Poppe B, Van Roy N, De Paepe A, et al. (2002) Accurate nor-malization of real-time quantitative RT-PCR data by geometric averaging of multiple internal control genes. Genome Biol 3: research0034.
18. Brym P, Rusc A, Kaminski S (2013) Evaluation of reference genes for qRT-PCR gene expression stud-ies in whole blood samples from healthy and leukemia-virus infected cattle. Vet Immunol Immunopathol 153: 302–307. doi:10.1016/j.vetimm.2013.03.004PMID:23548864
19. Feng H, Huang X, Zhang Q, Wei G, Wang X, Kang Z (2012) Selection of suitable inner reference genes for relative quantification expression of microRNA in wheat. Plant Physiol Biochem 51: 116–122. doi: 10.1016/j.plaphy.2011.10.010PMID:22153247
20. Andersen CL, Jensen JL, Orntoft TF (2004) Normalization of real-time quantitative reverse transcrip-tion-PCR data: A model-based variance estimation approach to identify genes suited for normalization, applied to bladder and colon cancer data sets. Cancer Res 64: 5245–5250. PMID:15289330
21. Anstaett OL, Brownlie J, Collins ME, Thomas CJ (2010) Validation of endogenous reference genes for RT-qPCR normalisation in bovine lymphoid cells (BL-3) infected with bovine viral diarrhoea virus (BVDV). Vet Immunol Immunopathol 137: 201–207 doi:10.1016/j.vetimm.2010.05.006PMID: 20580438
22. Pfaffl MW, Tichopad A, Prgomet C, Neuvians TP (2004) Determination of stable housekeeping genes, differentially regulated target genes and sample integrity: BestKeeper—excel-based tool using pair-wise correlations. Biotechnol Lett 26: 509–515. PMID:15127793
23. Blondal T, Jensby Nielsen S, Baker A, Andreasen D, Mouritzen P, Wrang TM, et al. (2013) Assessing sample and miRNA profile quality in serum and plasma or other biofluids. Methods 59: S1–6. doi:10. 1016/j.ymeth.2012.09.015PMID:23036329
24. Wong CH, Song C, Heng KS, Kee IH, Tien SL, Kumarasinghe P, et al. (2006) Plasma free hemoglobin: a novel diagnostic test for assessment of the depth of burn injury. Plast Reconstr Surg 117: 1206–1213. PMID:16582788
25. Kirschner MB, Kao SC, Edelman JJ, Armstrong NJ, Vallely MP, van Zandwijk N, et al. (2011) Haemoly-sis during sample preparation alters microRNA content of plasma. PLoS One 6: e24145. doi:10.1371/ journal.pone.0024145PMID:21909417
26. Kroh EM, Parkin RK, Mitchell PS, Tewari M (2010) Analysis of circulating microRNA biomarkers in plas-ma and serum using quantitative reverse transcription-PCR (qRT-PCR). Methods 50: 298–301. doi: 10.1016/j.ymeth.2010.01.032PMID:20146939
27. Nolan T, Hands RE, Bustin SA (2006) Quantification of mRNA using real-time RT-PCR. Nat Protoc 1: 1559–1582. PMID:17406449
29. Mitchell PS, Parkin RK, Kroh EM, Fritz BR, Wyman SK, Poqosova-Aqadjanyan EL, et al. (2008) Circu-lating microRNAs as stable blood-based markers for cancer detection. Proc Natl Acad Sci USA 105: 10513–10518. doi:10.1073/pnas.0804549105PMID:18663219
30. Reid G, Kirschner MB, van Zandwijk N (2011) Circulating microRNAs: Association with disease and po-tential use as biomarkers. Crit Rev Oncol Hematol 80: 193–208. doi:10.1016/j.critrevonc.2010.11.004 PMID:21145252
31. D'Alessandra Y, Devanna P, Limana F, Straino S, Di Carlo A, Brambilla PG, et al. (2010) Circulating microRNAs are new and sensitive biomarkers of myocardial infarction. Eur Heart J 31: 2765–2773. doi:10.1093/eurheartj/ehq167PMID:20534597
32. Chen X, Ba Y, Ma L, Cai X, Yin Y, Wang K, et al. (2008) Characterization of microRNAs in serum: A novel class of biomarkers for diagnosis of cancer and other diseases. Cell Res 18: 997–1006. doi:10. 1038/cr.2008.282PMID:18766170
33. Tesfaye D, Worku D, Rings F, Phatsara C, Tholen E, Schellander K, et al. (2009) Identification and ex-pression profiling of microRNAs during bovine oocyte maturation using heterologous approach. Mol Reprod Dev 76: 665.67748. doi:10.1002/mrd.21005PMID:19170227
34. Jin W, Dodson MV, Moore SS, Basarab JA, Guan LL (2010) Characterization of microRNA expression in bovine adipose tissues: a potential regulatory mechanism of subcutaneous adipose tissue develop-ment. BMC Mol Biol 11:29. doi:10.1186/1471-2199-11-29PMID:20423511
35. Rasmussen KD, Simmini S, Abreu-Goodger C, Bartonicek N, Di Giacomo M, Bilbao-Cortes D, et al. (2010) The miR-144/451 locus is required for erythroid homeostasis. J Exp Med 207: 1351–1358. doi: 10.1084/jem.20100458PMID:20513743