Genome-Wide Analysis of KAP1 Binding
Suggests Autoregulation of KRAB-ZNFs
Henriette O’Geen1,2, Sharon L. Squazzo1,2, Sushma Iyengar1,2, Kim Blahnik1,2, John L. Rinn3, Howard Y. Chang3, Roland Green4, Peggy J. Farnham1,2*
1Department of Pharmacology, University of California Davis, Davis, California, United States of America,2The Genome Center, University of California Davis, Davis, California, United States of America,3Program in Epithelial Biology, Stanford University School of Medicine, Stanford, California, United States of America,4NimbleGen Systems, Madison, Wisconsin, United States of America
We performed a genome-scale chromatin immunoprecipitation (ChIP)-chip comparison of two modifications (trimethylation of lysine 9 [H3me3K9] and trimethylation of lysine 27 [H3me3K27]) of histone H3 in Ntera2 testicular carcinoma cells and in three different anatomical sources of primary human fibroblasts. We found that in each of the cell types the two modifications were differentially enriched at the promoters of the two largest classes of transcription factors. Specifically, zinc finger (ZNF) genes were bound by H3me3K9 and homeobox genes were bound by H3me3K27. We have previously shown that the Polycomb repressive complex 2 is responsible for mediating trimethylation of lysine 27 of histone H3 in human cancer cells. In contrast, there is little overlap between H3me3K9 targets and components of the Polycomb repressive complex 2, suggesting that a different histone methyltransferase is responsible for the H3me3K9 modification. Previous studies have shown that SETDB1 can trimethylate H3 on lysine 9, using in vitro or artificial tethering assays. SETDB1 is thought to be recruited to chromatin by complexes containing the KAP1 corepressor. To determine if a KAP1-containing complex mediates trimethylation of the identified H3me3K9 targets, we performed ChIP-chip assays and identified KAP1 target genes using human 5-kb promoter arrays. We found that a large number of genes of ZNF transcription factors were bound by both KAP1 and H3me3K9 in normal and cancer cells. To expand our studies of KAP1, we next performed a complete genomic analysis of KAP1 binding using a 38-array tiling set, identifying;7,000 KAP1 binding sites. The identified KAP1 targets were highly enriched for C2H2 ZNFs, especially those containing Kru¨ppel-associated box (KRAB) domains. Interestingly, although most KAP1 binding sites were within core promoter regions, the binding sites near ZNF genes were greatly enriched within transcribed regions of the target genes. Because KAP1 is recruited to the DNA via interaction with KRAB-ZNF proteins, we suggest that expression of KRAB-ZNF genes may be controlled via an auto-regulatory mechanism involving KAP1.
Citation: O’Geen H, Squazzo SL, Iyengar S, Blahnik K, Rinn JL, et al. (2007) Genome-wide analysis of KAP1 binding suggests autoregulation of KRAB-ZNFs. PLoS Genet 3(6): e89. doi:10.1371/journal.pgen.0030089
Introduction
Certain modifications of the core histones have been associated with either active or inactive gene expression. For example, acetylation of histone H3 on lysines 9 and 14 is associated with regions of the chromatin that are undergoing transcription in that particular cell type [1–4]. Although histone H3 methylation can be associated with active chromatin (e.g., methylation of lysines 4, 36, and 79), methylation of lysines 9 or 27 (H3me3K9 or H3me3K27, respectively) is often found in regions of silenced chromatin [5–11]. Histone acetylation is a dynamic mark, being controlled by the counteracting effects of histone acetyl-transferases and deacetylases, providing a means of rapidly altering transcription of a particular gene in response to changes in environmental signals or position in the cell cycle [12]. In contrast, histone methylation is generally believed to be a more stable mark, suggesting that this modification may be more useful for conferring long-term gene repression, such as that needed for the permanent repression of tissue-specific genes in differentiated tissues. However, recent studies have indicated that members of the Jumonji protein family can demethylate lysine 9 [13–16]. These studies have, in general, examined the effect of Jumonji proteins on global levels of H3me3K9 (e.g., using western blots and/or by fluorescent microscopy) or on H3me3K9 at repetitive
elements [15], rather than the H3me3K9 bound to individual genes. Therefore, the role of the Jumonji proteins in gene regulation is still unclear. To date, no histone demethylases that target H3me3K27 have been reported.
The technique of chromatin immunoprecipitation (ChIP) has been used to demonstrate the presence of H3me3K9 or H3me3K27 at specific human loci [17–20]. Promoter regions bound by H3me3K27 have been identified in both normal and cancer cells [8,21,22]. In general, genes whose promoters are bound by H3me3K27 are expressed at very low levels. In contrast, few studies have shown localization of H3me3K9 to
Editor:Joseph R. Ecker, The Salk Institute for Biological Studies, United States of America
ReceivedFebruary 19, 2007;AcceptedApril 19, 2007;PublishedJune 1, 2007
A previous version of this article appeared as an Early Online Release on April 19, 2007 (doi:10.1371/journal.pgen.0030089.eor).
Copyright:Ó2007 O’Geen et al. This is an open-access article distributed under the terms of the Creative Commons Attribution License, which permits unrestricted use, distribution, and reproduction in any medium, provided the original author and source are credited.
Abbreviations:ChIP, chromatin immunoprecipitation; H3me3K9, trimethylation of lysine 9 of histone H3; H3me3K27, trimethylation of lysine 27 of histone H3; KRAB, Kru¨ppel-associated box; SET, Su(var), Enhancer of zeste, Trithorax; TSS, transcription start site; ZNF, zinc finger
promoter regions. Instead, H3me3K9 has been found at repetitive elements [6], leading to the hypothesis that it is involved in repression. However, one study did show that an unspecified form of histone H3 methylated K9 is associated with RB1-mediated repression of a mammalian promoter [23] and other studies have shown association of binding of H3me3K9 with transcriptional repression of a promoter region after artificially tethering of a factor that can recruit a histone methytransferase [24,25]. Perhaps the best exam-ples for association of transcriptional repression of an endogenous gene with the presence of H3me3K9 comes from an analysis of the POU5F1 promoter during differ-entiation [20] and of ASCL2 after knockdown of a Jumonji family member [13]. In contrast, others have found that H3me3K9 associates with promoters that are bound by the RNA polymerase II complex [8] or with actively transcribed genes [17,19,26]. For example, one study found high levels of H3me3K9 over the highly transcribed gamma globin locus [26] and a second study found that H3me3K9 was localized to the coding region of several active genes [17]. Clearly, a comprehensive comparison of H3me3K9 and H3me3K27 binding sites in human cells is needed to provide insight into the relative roles of these two modifications in gene expression.
We have now compared the binding patterns of H3me3K9 and H3me3K27 at ;26,000 human promoters in four different cell populations, identifying thousands of pro-moters bound by each type of modified histone. Our studies indicate that the two marks segregate differentially with the two most common types of transcriptional regulators. We have also shown that many of the promoters bound by H3me3K9 are also bound by the corepressor KAP1 (also known as TIF1B or TRIM28). Finally, we present a genome-wide screen and characterization of KAP1 target genes in Ntera2 cells. Our results suggest that Kru¨ppel-associated box (KRAB)-zinc finger (ZNF) transcription factors participate in an autoregulatory loop involving the KAP1 protein and trimethylation of histone H3 on lysine 9.
Results
H3me3K9 and H3me3K27 Modifications Are Used to Silence Different Sets of Transcription Factor Genes
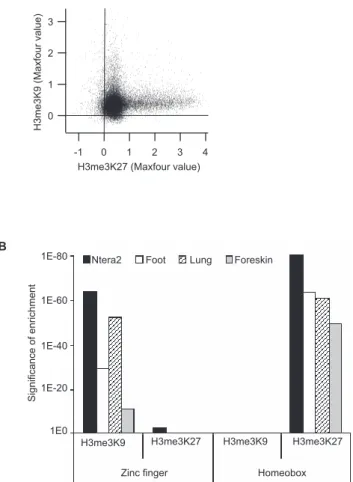
We used ChIP-chip assays with high-density oligonucleo-tide arrays to analyze the binding patterns of H3me3K9 and H3me3K27 through 5 kb of 26,000 human promoters (see Table S1 for a list of all arrays used in this study). We began by using an antibody that specifically recognizes histone H3 only when it is trimethylated on lysine 9 and an antibody that recognizes histone H3 only when it is trimethylated on lysine 27. We performed ChIP-chip assays using Ntera2 cells and obtained ranked lists using the Maxfour program, which ranks each promoter region based on the average of the intensities of the four consecutive probes (of the 50 that represent each promoter) that have the highest enrichment values (Bieda et al., manuscript in preparation). We found that the sets of target genes that are bound by H3me3K9 and H3me3K27 are essentially mutually exclusive (Figure 1A). To determine which specific types of target genes were selec-tively silenced by the different histone modifications, we compared the promoters that were in the list of top 2,000 H3me3K9 targets and the promoters that were in the list of top 2,000 H3me3K27 targets using the program DAVID (http://david.abcc.ncifcrf.gov). This program allows a func-tional classification of a set of genes based on Gene Ontology descriptions. In addition to classifying genes into different sets, the program provides a p-value that indicates the probability that the set of genes was identified by chance based on the number of genes in the genome that fall into that particular category. We found that although the sets of promoters bound by H3me3K9 and H3me3K27 were differ-ent, both histone modifications were specifically enriched at the promoters of genes involved in transcription (Table 1; see also Table S2 for a more detailed list of the significantly enriched gene categories). Interestingly, the two histone modifications targeted two distinctly different classes of transcription factor genes. Similar to previous studies [8,21,27], the set of developmentally related homeobox transcription factors were the most highly enriched class of transcription factor genes bound by H3me3K27 (Figure 1B). In contrast, homeobox genes were not bound by H3me3K9. Instead, H3me3K9 bound specifically to ZNF transcription factors. Examples of enrichment of H3me3K27 at a homeo-box gene cluster and of H3me3K9 at a ZNF gene cluster can be seen in Figure 2. To determine if the selective binding of H3me3K27 and H3me3K9 to the promoters of different families of transcription is commonly observed, we per-formed ChIP-chip experiments using antibodies to H3me3K9 and H3me3K27 with primary cultures of normal fetal lung fibroblasts, adult foot fibroblasts, and newborn foreskin fibroblasts. As shown in Figure 1, analysis of 26,000 promoters revealed that ZNF genes were enriched in the H3me3K9 targets while homeobox genes were enriched in the H3me3K27 targets in all four cell lines (see also Table S2 for a list of the significantly enriched gene categories for the fibroblast studies).
The KAP1 Corepressor Colocalizes with H3me3K9 We have previously reported that components of the Polycomb repressive complex 2 colocalize with H3me3K27 in F9 cells and mouse embryonic stem cells [8]. However, due to
Author Summary
the fact that H3me3K9 and H3me3K27 are bound to different sets of genes, it is likely that a different repression complex is responsible for the H3me3K9 modifications. Several different proteins can methylate histone H3 on lysine 9 [28,29]. A hallmark of such proteins is the presence of a 130-aa Su(var), Enhancer of zeste, Trithorax (SET) domain. There are numerous proteins encoded in the human genome that contain SET domains, several of which (e.g., G9a, SUV39H1/2, EHMT1, and SETDB1) have been recently characterized as functional histone methyltransferases. The different bio-logical roles played by the different histone methylases is not yet clear. However, SUV39H1/2 is thought to be responsible for methylation in pericentric heterochromatin, whereas G9a may be involved in methylation in euchromatin regions [28,30]. None of the histone methyltransferases contain DNA binding motifs and thus must be brought to the chromatin via interaction with other proteins. It has been proposed that complexes that mediate methylation of H3me3K9 may be recruited to promoters via E2F family members. For example, SUV39H1 may be recruited to promoters by RB1 [31] and EHMT1 may be recruited to promoters by E2F6 [32]. A recent study has suggested that EHMT2 can be recruited to the DNA via interaction with an orphan nuclear receptor called NR0B2 [33]. SETDB1, another protein that has a SET homology domain [34], may be responsible for the H3K9 methylation that is maintained in
Table 1.H3me3K9 and H3me3K27 Predominantly Target Tran-scription Factors in Four Different Cell Types
Cell Type p-Value for Transcription
H3me3K9 H3me3K27
Ntera 1E 70 7E 78
Foot 1E 44 1E 48
Lung 2E 54 1E 47
Foreskin 1E 22 9E 34
The top 2,000 gene promoters bound by either H3me3K9 or H3me3K27 were identified from 5-kb promoter arrays using the Maxfour peakcalling program (see Materials and Methods). Functional categories were determined using the program DAVID in Ntera2 cells and for foot, lung, and foreskin fibroblasts.p-Values for the significance of enrichment are shown for the predominantly represented category‘‘transcription.’’
doi:10.1371/journal.pgen.0030089.t001
Figure 2.H3me3K9 binds to ZNF Gene Clusters and H3me3K27 Binds to Homeobox Gene Clusters
Binding patterns of H3me3K9 and H3me3K27 (from 5-kb promoter array ChIP-chip data) in Ntera2 cells are compared at a ZNF gene cluster (1.6 Mb of Chromosome 19, top panel) and at the HoxC cluster (0.15 Mb of Chromosome 12, bottom panel).
doi:10.1371/journal.pgen.0030089.g002 Figure 1. H3me3K9 and H3me3K27 Target Different Classes of
Transcription Factors
(A) The Maxfour values from the 5-kb promoter array set (see Materials and Methods) are plotted for Ntera2 ChIP-chip data of H3me3K27 (x-axis) and H3me3K9 (y-axis).
(B) Functional categories for the top 2,000 genes bound by either H3me3K9 or H3me3K27 were determined using the program DAVID in Ntera2 cells (black bars), foot fibroblasts (white bars), lung fibroblasts (hatched bars), and foreskin fibroblasts (gray bars). The category ‘‘transcription’’ was significantly enriched for both H3me3K9 and H3me3K27 (see Table 1 and Table S2).p-Values for the significance of enrichment for zinc fingers and homeoboxes, two major classes of transcription factors, are shown.
doi:10.1371/journal.pgen.0030089.g001
the SUV39H1/2 double knockout mouse [35]. It is thought that SETDB1 is brought to the DNA in a complex with a corepressor called KAP1 [34,36]. For example, artificially tethering KAP1 to chromatin can result in gene silencing, methylation of lysine 9, and recruitment of SETDB1 [24]. This suggests that KAP1 may play a role in performing the methylation of lysine 9 of H3. However, most studies of KAP1 have used artificial genomic tethers (such as Gal4KAp1 fusion proteins) due to the fact that KAP1 target genes have not been identified. Therefore, to address the possibility that KAP1 might colocalize with H3me3K9 marks, we first needed to identify KAP1 target genes.
We began by choosing two different antibodies to KAP1,
one rabbit polyclonal and one mouse monoclonal antibody. We reasoned that if the same sites were identified using two different antibodies, then we would have confidence that the KAP1 ChIP experiments were identifying true binding sites. Because we did not know if KAP1 prefers to bind to promoter regions or to regions distant from core promoters, we first applied the amplicons made from the KAP1 ChIP samples to ENCODE arrays (which represent approximately 1% of the human genome, including ;400 genes; see http://www. genome.gov/10005107). We identified two sites at the highest stringency level of the Tamalpais Peaks program [37] that were bound by KAP1 using both the monoclonal and polyclonal KAP1 antibodies (Figure 3). Peak identification Figure 3.Identification of KAP1 Binding Sites Using ENCODE Tiling Arrays
(A) ChIP-chip analysis in Ntera2 cells using two antibodies (rabbit polyclonal, r-KAP1 and mouse monoclonal, m-KAP1) raised against different KAP1 epitopes. Two KAP1 binding sites (one in Enm005, top panel and one in Enr132, bottom panel) were identified using the Tamalpais peak-calling program [37].
(B) PCR analysis of the two identified KAP1 binding sites in ENCODE regions ENm005 and ENr132 was performed using a third biological replicate of amplicons using the rabbit KAP1 antibody. The enrichment of KAP1 and H3me3K9 is shown in comparison to total chromatin DNA. IgG amplicons were analyzed as a negative control.
required that at least six oligomer probes in a row (spanning 238 bp) have an enrichment value in the top 2% of all probes on the array (providing a p-value of p , 0.0001). The two identified KAP1 binding sites are located within the tran-scribed region of IFNAR2 in ENCODE region ENm005 and within the transcribed region of ATP11A in ENCODE region ENr132. To confirm the ChIP-chip results, we prepared a new set of KAP1 amplicons, as well as H3me3K9 amplicons, and performed PCR analysis using primers specific to the two KAP1 binding sites. As seen in Figure 3B, not only did we confirm binding of KAP1 to these sites, but we also demonstrated that the same sites were bound by H3me3K9.
With confidence that our KAP1 ChIP-chip assays could identify true KAP1 binding sites, we next performed duplicate ChIP experiments using two independent sets of Ntera2 cells and antibodies to KAP1, SUZ12, H3me3K9, and H3me3K27, prepared amplicons, and performed ChIP-chip experiments using a two-array set of ;26,000 human promoters. As described above, target promoters were identified with the Maxfour peak-calling program. A list of high confidence target genes was generated by selecting the top ranked 2,000 promoters that were bound in the two independent experiments for each antibody. We then determined how many of the SUZ12 or KAP1 targets were also co-occupied by H3me3K9 and H3me3K27. This led to a conservative, but high confidence set of co-occupied targets, since each target had to be identified in four out of four arrays. In support of the hypothesis that the modification of H3me3K9 must be accomplished by a complex other than Polycomb repressive complex 2, we saw no significant overlap between SUZ12 targets and H3me3K9 targets (Figure 4A). However, as expected, we found that many promoters were bound by both SUZ12 and H3me3K27.
We next compared the top 2,000 KAP1 targets to the top 2,000 H3me3K9 or top 2,000 H3me3K27 targets. We found that a fourth of KAP1 targets also carried the histone modification H3me3K9 but only 11% of KAP1 targets were bound by H3me3K27 (Figure 4B). To determine if the
promoters that were bound by both KAP1 and H3me3K9 represented a distinct class of genes, we again used the DAVID analysis program. Interestingly, the promoters bound by both KAP1 and H3me3K9 in Ntera2 cells were highly enriched for ZNF transcription factor genes (p-value 5E 27). Similarly, ChIP-chip experiments using antibodies to KAP1 and H3me3K9 in primary cultures of foot fibroblasts also revealed that the target genes occupied by both KAP1 and H3me3K9 were highly enriched for ZNF transcription factors (p-value 2E 32).
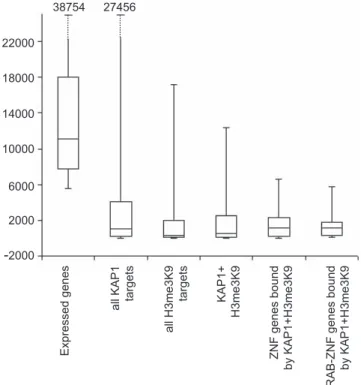
The significant overlap between KAP1 and H3me3K9 suggests that KAP1 may indeed be functioning as a corepressor in a complex that mediates methylation of lysine 9 of H3. To test this hypothesis, we examined the expression level of different classes of KAP1 and H3me3K9 target genes. To do so, we used NimbleGen expression arrays to analyze RNA levels of the KAP1 target genes in Ntera2 cells, using an average of data obtained from expression arrays probed with RNA isolated from two different cultures of Ntera2 cells. For comparison, we have also analyzed the expression levels of the top 20% of all RNAs on the NimbleGen array. Of the top 2,000 KAP1 and top 2,000 H3me3K9 target genes, 1,952 and 1,842, respectively, were represented on the NimbleGen expression array. As can been seen in Figure 5, the genes whose promoters are bound by KAP1 and/or H3me3K9 are, in general, expressed at low levels. The repression of targets bound by KAP1 and H3me3K9 is particularly evident in the subcategory of ZNF target genes or KRAB-ZNF target genes.
Identification of KAP1 Targets on a Genome-Wide Scale Previous studies of human transcription factors have indicated that although some transcription complexes are often bound near core promoter regions [37], many tran-scription complexes bind throughout the genome, with perhaps 20%–30% of the detected sites near core promoters [38,39]. In particular, we noted that the two KAP1 binding sites identified using ENCODE arrays were located within transcribed regions and not at core promoters. Thus, it is Figure 4.KAP1 and H3me3K9 Bind to a Common Set of Promoters in Ntera2 Cells
Chart showing the percentage of (A) SUZ12 target promoters and (B) KAP1 target promoters that are also bound by H3me3K9 or H3me3K27. For each factor, the top 2,000 target promoters (5-kb array set) from two biological replicate ChIP-chip assays were used. This results in high confidence sets of genes co-occupied by H3me3K9 or H3me3K27 since the target genes had to be present in all four arrays analyzed.
doi:10.1371/journal.pgen.0030089.g004
likely that promoter arrays would not identify a complete list of genes regulated by KAP1. Therefore, we performed a genome-wide ChIP-chip experiment using KAP1 ChIP sam-ples from Ntera2 cells and a set of 38 arrays, which were composed of 50mers spaced about 100 nt apart that represented the entire nonrepetitive portion of the human genome (see Table S3 for the genomic coordinates on each array). We used the Tamalpais peak-calling program ([37]; see also http://chipanalysis.genomecenter.ucdavis.edu/cgi-bin/ tamalpais.cgi) and identified sites that represented regions spanning at least four probes in a row that were in the top 2% of all probes on the array. Using these criteria, we identified ;7,000 KAP1 binding sites in the human genome (see Table S4). A comparison of the number of binding sites identified on each chromosome using promoter arrays and the genome tiling arrays is shown in Table 2.
Inspection of the chromosomal location of the KAP1 binding sites indicated that, in general, the larger chromo-somes contained more KAP1 targets than did the smaller chromosomes. However, there were several cases in which large clusters of KAP1 targets resulted in a higher-than-expected number of targets on a particular chromosome. For example, Chromosomes 7 and 19 were highly enriched for KAP1 targets using the whole-genome arrays (Table 2). Interestingly, Chromosome 19 contains clusters of ZNF transcription factor genes, with 266 of the approximately 800 total human ZNF genes located mainly within 11 large
familial clusters [40]. The clustered binding pattern of KAP1 targets on Chromosome 19 can be seen in Figure 6A. To determine if the KAP1 targets that were identified using the whole-genome array were similar to those identified using the promoter arrays, we analyzed the set of;7,000 KAP1 binding sites using the DAVID program. As expected from the large number of KAP1 binding sites on Chromosomes 19 and 7, the Gene Ontology analysis indicated that a large number of the genome-wide KAP1 targets are ZNF transcription factors (Figure 7). Thus, both the promoter arrays and the whole-genome arrays identified ZNF genes as KAP1 targets. The high number of targets on Chromosomes 19 and 7 is not due to large-scale spreading throughout a region, as we have previously shown for SUZ12 and H3me3K27 [8]. Although there are many binding sites on each of these chromosomes, the average KAP1 binding site spans only 820 bp (Table S4). PCR analysis using a new biological replicate of KAP1 amplicons confirmed binding of KAP1 and H3me3K9 to ZNF genes (Figure 6B). Four of the binding sites analyzed are located within the transcribed region of ZNF genes on Chromosome 19 (ZNF554, ZNF426, ZNF333, and ZNF433) and two binding sites are located in distal regions on Chromosome 7 (.100kb from the transcription start sites (TSSs) of ZNF genes ZNF479 and ZNF679).
Having identified a large set of KAP1 targets in a completely unbiased manner, we could now determine the preferred binding location for KAP1. The distance of KAP1 binding sites to the nearest transcription start site was determined using knownGenes from the University of California Santa Cruz genome browser (http://genome.ucsc. Figure 5.KRAB-ZNF Genes Bound by KAP1 Are Expressed at Low Levels
Box plot showing 25th, 50th, and 75th quartile expression levels for the most highly expressed RNAs (the top 20% of all RNAs on the array) and for different target gene categories: all KAP1 target genes, all H3me3K9 target genes, genes occupied by KAP1 and H3me3K9, ZNF genes co-occupied by KAP1 and H3me3K9, and KRAB-ZNF genes co-co-occupied by KAP1 and H3me3K9. Whiskers show the 2.5th and 97.5th percentiles. For these analyses, average RNA expression values from two independent experiments were used.
doi:10.1371/journal.pgen.0030089.g005
Table 2.KAP1 Targets Listed by Chromosome in Ntera2 Cells
Chromosome 5-kb Promoter Array Whole-Genome Array
1 274 619
2 118 555
3 128 431
4 68 162
5 75 206
6 78 313
7 95 756
8 57 375
9 93 149
10 75 410
11 98 352
12 99 497
13 36 262
14 81 306
15 63 239
16 68 127
17 107 89
18 26 16
19 142 380
20 49 100
21 26 94
22 44 77
X 91 306
Y 11 119
The number of the top 2,000 KAP1 target promoters from 5-kb promoter arrays of two biological replicates and the number of the;7,000 KAP1 targets from whole-genome tiling arrays are listed according to their chromosomal location (see Materials and Methods for peak calling).
edu). Although we did note that 24% of the KAP1 binding sites were located more than 50 kb upstream or downstream of transcription start sites of known genes, these were not considered in our location analysis; it is possible that many of
these KAP1 target sites that appear to be extremely far from transcription start sites are, in fact, near to start sites of as-yet undiscovered genes or transcripts. As shown in Figure 8A, we performed the location analysis within 50 kb upstream or downstream of a known gene for two categories of KAP1 target genes, ZNF target genes and non-ZNF target genes. We found that for the majority of non-ZNF target genes the KAP1 binding site is located in the core promoter region (defined as 5 kb upstream or downstream of the start site of transcription). The remaining binding sites are distributed fairly evenly in the regions between 5 kb and 50 kb upstream or downstream of the start sites. In contrast, the location analysis was distinctly different for the subset of ZNF genes that are KAP1 target genes. It was very striking that many of the KAP1 binding sites associated with ZNF genes are downstream of the start site (Figure 8A). A more detailed analysis of the KAP1 sites that are located downstream of the start sites of ZNF genes revealed that 74% were located within the transcribed regions. Interestingly, the majority of these KAP1 binding sites were found towards the 39 end of the ZNF gene (Figure 8B).
Discussion
We have shown that the genes for the two largest classes of site-specific DNA binding transcription factors are bound by distinct histone modifications; trimethylation of histone H3 on lysine 27 is highly enriched at genes encoding homeobox transcription factors (the second largest family of Figure 6.Identification of KAP1 Targets in Ntera2 cells Using Whole-Genome Tiling Arrays
(A). The KAP1 binding patterns along Chromosome 19 (and a 200-kb subregion) containing clusters of ZNF genes are shown. Chromosome positions (Mb) are indicated on the x-axis. The black bar indicates transcribed region of ZNF433 and grey bars represent other transcribed regions (ZNF-like transcripts).
(B) PCR analysis of six KAP1 binding sites was performed using a separate biological replicate of KAP1 amplicons. Four KAP1 binding sites are located within the transcribed region of ZNF genes on Chromosome 19 (ZNF554, ZNF426, ZNF333, and ZNF433) and two KAP1 binding sites are located .100kb from TSS of ZNF genes on Chromosome 7 (ZNF479 and ZNF679). An intergenic region of Chromosome 8 was used as a control for absence of KAP1 binding. The enrichment of KAP1 and H3me3K9 is shown in comparison to total chromatin DNA; IgG amplicons were analyzed as a negative control.
doi:10.1371/journal.pgen.0030089.g006
Figure 7.Functional Annotation of Genome-Wide KAP1 Targets Functional categories for KAP1 target genes were determined using the program DAVID after elimination of genes that had no annotation and genes encoding hypothetical proteins. The top ten categories based on theirp-value are shown. Ontology terms are shown on the y-axis; p-values for the significance of enrichment are graphed along the x-axis. doi:10.1371/journal.pgen.0030089.g007
human transcription factors) and trimethyation of histone H3 on lysine 9 is highly enriched at genes encoding ZNF transcription factors (the largest family of human tran-scription factors). The Kru¨ppel-type ZNF domain is the most common DNA binding domain in the human genome [41] and at least one third of the ZNF genes include the KRAB domain, which is thought to recruit histone modify-ing proteins via interaction with the corepressor KAP1 [36,42,43]. The ability of the KRAB-ZNF proteins to interact with KAP1 has led to previous models of KAP1-mediated repression being targeted to the genome by ZNF proteins. In vitro biochemical and cellular artificial tethering experi-ments have suggested that the corepressor KAP1 might recruit a histone methylase to promoters, resulting in lysine
9 methylation. However, testing this model has not been possible due to the fact that no known targets of KAP1 had been identified. We have now identified thousands of KAP1 binding sites, using both promoter and genomic tiling arrays, and have shown that many of the KAP1 binding sites are also enriched for H3me3K9.
Autoregulation of KRAB-ZNF Gene Family Expression Unexpectedly, we have shown that the major targets of KAP1-mediated repression are ZNF genes themselves. For example, in Ntera2 cells KAP1 binds to 60% (212 of 355) of all KRAB-ZNF genes in the genome. This suggests that KAP1 represses transcription of many KRAB-ZNF genes due to its recruitment to their transcribed regions by interaction with Figure 8.Location Analysis of Genome-Wide KAP1 Targets
(A) Distribution of the distance between KAP1 binding sites and closest transcription start sites from University of California Santa Cruz KnownGenes (HG17) is shown. Distances are calculated from the center of the KAP1 binding site to the transcription start site and binned in 5-kb intervals between 50 kb upstream and 50 kb downstream of TSS. KAP1 binding sites within each interval are given as a percentage for ZNF target genes (grey) and for KAP1 target genes excluding ZNF genes (black).
(B) Analysis of 277 KAP1 binding sites located within the transcribed regions of ZNF genes. Position of KAP1 binding is plotted relative to the length of the ZNF target gene (59end at 0%; 39end at 100%).
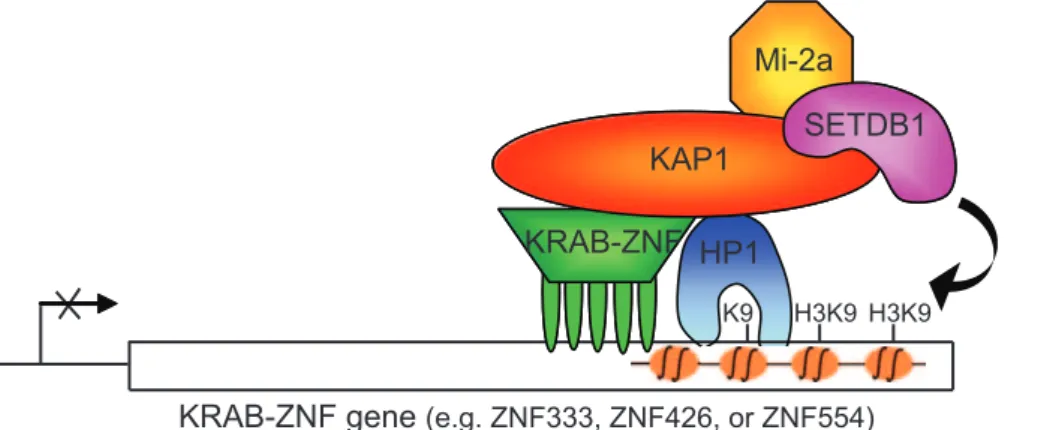
the few KRAB-ZNF proteins that are expressed in a cell (Figure 9). An analysis of the expression level of the different KRAB-ZNF proteins in Ntera2 cells confirmed that the majority of KRAB-ZNF genes—such as the KAP1 target genes ZNF426, ZNF333, and ZNF554—are not expressed. However, a few KRAB-ZNF genes are not bound by KAP1 in Ntera2 cells and are highly transcribed, suggesting that they may play a role in the recruitment of KAP1 to the other KRAB-ZNF target genes. Thus, our studies support an autoregulatory model in which KAP1 represses the expression of hundreds of ZNF genes due to its recruitment to chromatin by a small set of ZNF proteins that are expressed in a particular cell.
KAP1 Binds to Core Promoters of Most Genes but to 39
Ends of ZNF Genes
As indicated above, we have shown that the most highly enriched class of target genes for KAP1 is ZNF genes, many of which encode KRAB-ZNF proteins. Interestingly, we find a difference in the location of KAP1 binding sites in the ZNF genes versus other targets. In accordance with our identi-fication of a large set of KAP1 targets using promoter arrays, we find that thousands of the KAP1 targets identified on the whole-genome tiling arrays show localization at the pro-moter region (defined as 5 kb upstream or downstream of the start site). In contrast, the KAP1 binding sites associated with ZNF genes are predominantly localized within tran-scribed gene regions, near the 39 end of the gene. This suggests that the recruitment of KAP1 to the ZNF genes and/ or the function of KAP1 in regulating expression of ZNF genes might be different than for other KAP1 targets. The other ;200 DNA binding transcription factors that are KAP1 targets but are not ZNFs show a promoter-localized KAP1 binding pattern (unpublished data). Thus, the 39 end-localized KAP1 binding pattern is unique to ZNF tran-scription factors.
A recent study using DamID, rather than ChIP, found that 37% of CBX1 (HP1-BETA) targets and 48% of the SUV39H1 targets correspond to KRAB-ZNF genes on Chromosome 19 [44]. CBX1 is thought to be able to recognize methylated lysine 9. In addition, it has been shown that KAP1 interacts with CBX1 [45] and that this interaction is required for the KAP1 corepressor activity [24]. Thus, our finding that
KAP1 plus H3me3K9 binds to KRAB-ZNF genes fits well with the previous study showing that CBX1 plus SUV39H1 bind to this same class of genes. However, Vogel et al. [44] found that CBX1 coats large domains of Chromosome 19, ranging up to 4 MB, whereas we saw very limited spreading of KAP1. It is possible that KAP1 binding within the transcribed region of KRAB-ZNF genes remains localized but recruit-ment of the methyltransferase results in spreading of the H3me3K9 mark. It is also possible that differences in chromatin binding patterns could be due to differences in the cell types used in the two experiments. Our genomic tiling arrays were performed using Ntera2 testicular car-incoma cells whereas the CBX1 study used MCF7 breast cancer cells.
Future Studies
We have proposed that the general repression of KRAB-ZNF genes is accomplished by recruitment of the KAP1 corepressor to their transcribed regions via interaction with one or more of the KRAB-ZNF proteins that is highly expressed in that particular cell type. It is likely that either simultaneously with or subsequent to KAP1 recruitment a histone methyltransferase such as SUV39H1 or SETDB1 associates with KAP1, resulting in trimethylation of histone H3 at lysine 9. In support of this hypothesis, we have preliminary evidence that reduction of the levels of KAP1 in human 293 cells by stable expression of small interfering RNAs results in a reduction of the levels of H3me3K9 at KAP1 binding sites (Figure S1). Due to the fact that we can identify KAP1 bound promoters that are not bound by H3meK9, we suggest that the recruitment of the histone methyltransferase is a step subsequent to KAP1 binding to the chromatin. This hypothesis is also supported by the finding that forced expression of KAP1 leads to the subsequent trimethylation of lysine 9 of histone H3 of a chromatinized reporter gene [24]. It is also possible that a histone demethylase is associated with the promoters that are bound by KAP1 but not H3me3K9 [13,14]; future studies will be focused on this aspect of the model. In addition, studies are in progress to identify the specific KRAB-ZNFs responsible for 39 end localized autor-egulatory repression of the KRAB-ZNF family in different types of human cells.
Figure 9.Autoregulation Model for KRAB-ZNFs
Shown is a model illustrating autoregulation of the family of KRAB-ZNFs by KRAB-ZNF-mediated recruitment of KAP1 to the coding regions of other KRAB-ZNF genes. ZNF426, ZNF333, and ZNF533 are KAP1 targets and are not expressed in Ntera2 cells.
doi:10.1371/journal.pgen.0030089.g009
Materials and Methods
Cell culture.Ntera2 and HEK293 cells were grown in Dulbecco’s Modified Eagle Medium supplemented with 10% FBS, 2mM gluta-mine, and 1% penicillin/streptomycin. The stable KAP1 knockdown cell line K928-cl10 was grown as above, with the addition of 10ug/ml puromycin [24]. Human fibroblast cultures were propagated in Dulbecco’s Modified Eagle Medium supplemented with 10% fetal bovine serum and 1% penicillin/streptomycin until 80% confluent. Fibroblasts were then synchronized in G0by the addition of media
containing only 0.1% fetal bovine serum for 48 h [46]. All cells were incubated at 378C in a humidified 5% CO2incubator.
ChIP assays and amplicon preparation.ChIP assays (13107cells/ assay) were performed following the protocol provided at http:// genomics.ucdavis.edu/farnham and http://genomecenter.ucdavis.edu/ expression_analysis. The primary antibodies used in this study were as follows: rabbit polyclonal KAP1 IgG (ab10483; Abcam, http://www. abcam.com), mouse monoclonal KAP1 IgG (ab22553; Abcam), two different rabbit polyclonal H3me3K9 IgGs (ab1186 and ab1186; Abcam), rabbit polyclonal H3me3K27 IgG (07–449; Upstate/Millipore, http://www.upstate.com), and rabbit polyclonal SUZ12 IgG (ab12201; Abcam). The secondary rabbit anti-mouse IgG was purchased from MP Biomedicals (55436; http://www.mpbio.com). The nonspecific rabbit IgG used as a negative control in the ChIP assays was purchased from Alpha Diagnostic International (20009–5; http://www. 4adi.com). For PCR analysis of the ChIP samples prior to amplicon generation, QIAquick-purified (Qiagen, http://www1.qiagen.com) im-munoprecipitates were dissolved in 50ll of water. Standard PCR
reactions using 2 ll of the immunoprecipitated DNA were
performed. PCR products were separated by electrophoresis through 1.5% agarose gels and visualized using ethidium bromide. Amplicons were prepared by adapting the standard protocol for whole-genome amplification using the Sigma GenomePlex WGA kit (http://www. sigmaaldrich.com) as described in O’Geen et al. [47]. Briefly, the initial random fragmentation step was eliminated and DNA from an entire ChIP sample or from 10 ng of total chromatin was amplified. This usually provides enough sample for one array hybridization. However, amplicons for the whole-genome tiling array set (38 arrays) were prepared from ten pooled ChIP samples. A detailed protocol for the WGA method is provided at http://genomics.ucdavis.edu/farnham and http://genomecenter.ucdavis.edu/expression_analysis.
ChIP-chip assays. Amplicons were applied either to ENCODE arrays, 5-kb promoter arrays or to the human genome tiling array set consisting of 38 arrays (see http://www.nimblegen.com for details). The labeling and hybridization of DNA samples for ChIP-chip analysis was performed by NimbleGen Systems, except that ENCODE arrays were hybridized at University of California Davis. Briefly, each DNA sample (1lg) was denatured in the presence of 59-Cy3- or 59-Cy5-labeled
random nonamers (TriLink Biotechnologies, http://www. trilinkbiotech.com) and incubated with 100 units (exo-) Klenow fragment (NEB, http://www.neb.com) and dNTP mix [6 mM each in TE buffer (10 mM Tris/1 mM EDTA, pH 7.4; Invitrogen, http://www. invitrogen.com)] for 2 h at 37 8C. Reactions were terminated by addition of 0.5 M EDTA (pH 8.0), precipitated with isopropanol, and resuspended in water. Then, 13lg of the Cy5-labeled ChIP sample and
13lg of the Cy3-labeled total sample were mixed, dried down, and
resuspended in 40ll of NimbleGen Hybridization Buffer (NimbleGen
Systems) plus 1.5 lg of human COT1 DNA. After denaturation,
hybridization was carried out in a MAUI Hybridization System (BioMicro Systems, http://www.biomicro.com) for 18 h at 428C. The arrays were washed using NimbleGen Wash Buffer System (Nimble-Gen Systems), dried by centrifugation, and scanned at 5-lm resolution
using the GenePix 4000B scanner (Axon Instruments, http://www. axon.com). Fluorescence intensity raw data were obtained from scanned images of the oligonucleotide tiling arrays using NIMBLES-CAN 2.0 extraction software (NimbleGen Systems). For each spot on the array, log2-ratios of the Cy5-labeled test sample versus the Cy3-labeled reference sample were calculated. Then, the biweight mean of this log2 ratio was subtracted from each point; this procedure is approximately equivalent to mean normalization of each channel.
Data analysis.Sites bound by KAP1 on the ENCODE arrays were identified using the highest stringency level (six consecutive probes above the 98th percentile threshold,p,0.0001) of the Tamalpais peak-calling algorithm previously described [37]; see also http:// genomics.ucdavis.edu/farnham. However, the peak-calling algorithm was adapted slightly to identify KAP1 sites on the whole-genome tiling arrays (we used four consecutive probes above the 98th percentile threshold,p, 0.05). This adjustment was made due to the difference in probe spacing between ENCODE arrays (38 bp) and the whole-genome arrays (100 bp). A complete list of KAP1 binding
sites identified on the whole-genome tiling array is provided as Table S4. The 5-kb promoter array set consists of two individual arrays (promoter 1 and promoter 2). Two different designs, HG17 and HG18, were used in this study; the exact design used for each experiment is indicated in Table S1. The HG17 promoter array set covers 4.2 kb upstream and 800 bp downstream of the TSS, whereas the HG18 promoter array set covers 3.5kb upstream and 750 bp downstream of the TSS. Regions on the 5-kb promoter arrays bound by the individual factors were determined using the Maxfour peak-calling method (Bieda et al., in preparation). Briefly, a value was assigned based on the highest mean of four consecutive probes in each promoter. Promoters were then ranked by their Maxfour values for promoter 1 and promoter 2 separately. The list of the top 2,000 targets for a 5-kb promoter array set was then created by combining the 1,000 highest ranked promoters from promoter array 1 and the 1,000 highest ranked promoters from promoter array 2. The location analysis of KAP1 binding sites was performed using the knownGene database available at http://genome.ucsc.edu (HG17; assembly May 2004). Functional annotations were performed using the program Database for Annotation, Visualization, and Integrated Discovery (DAVID) 2.1 (http://david.abcc.ncifcrf.gov), as previously described [8].
RNA expression arrays. Total RNA was prepared from 53106 Ntera cells using RNAeasy Kit (Qiagen) following the manufacturer’s instructions. RNA quality was ensured using the Agilent Systems Bioanalyzer (http://www.agilent.com). The RNA was hybridized to human whole-genome expression microarrays from NimbleGen, which contain probes for every human gene based on genome build HG18 from the University of California Santa Cruz database (more details at http://www.nimblegen.com). Total RNA (10lg) was used to
synthesize cDNA using the SuperScript Double-Stranded cDNA synthesis kit (Invitrogen). The labeling of RNA samples, array hybridization and preliminary RNA expression analysis (data normal-ization) was performed by NimbleGen Systems.
Supporting Information
Figure S1.ChIP Analysis in KAP1 Knockdown Cells
Found at doi:10.1371/journal.pgen.0030089.sg001 (1.2 MB PDF).
Table S1.List of ENCODE and Promoter Arrays
Found at doi:10.1371/journal.pgen.0030089.st001 (30 KB XLS).
Table S2. Gene Ontology Analyses of H3me3K9 and H3me3K27 Targets
Found at doi:10.1371/journal.pgen.0030089.st002 (12 KB XLS).
Table S3.List of Whole-Genome Tiling Arrays
Found at doi:10.1371/journal.pgen.0030089.st003 (22 KB XLS).
Table S4.List of;7,000 KAP1 Binding Sites
Found at doi:10.1371/journal.pgen.0030089.st004 (916 KB XLS).
Accession numbers
The National Center for Biotechnology Information (NCBI) Entrez (http://www.ncbi.nlm.nih.gov/gquery/gquery.fcgi) accession numbers for the genes discurssed in this paper are KAP1 (also known as TRIM28, TIF1B, TF1B, and RNF96), NM_005762 and SUZ12 (also known as JJAZ1, KIAA0160, and CHET9), NM_015355.
Acknowledgments
We thank the members of the Farnham lab for helpful discussion and data analysis and David Schultz for the 293 KAP1 knockdown cells.
Author contributions.HOG, SLS, and PJF conceived and designed the experiments. HOG, SLS, SI, and JLR performed the experiments. HOG, SLS, SI, KB, and PJF analyzed the data. JLR, HYC, and RG contributed reagents/materials/analysis tools. HOG and PJF wrote the paper.
Funding.This work was supported in part by Public Health Service grants CA45250, HG003129, and DK067889. Funding was also provided by the University of California Davis Stem Cell Internal Advisory Committee.
References
1. Bannister AJ, Schneider R, Myers FA, Thorne AW, Crane-Robinson C, et al. (2005) Spatial distribution of di- and tri-methyl lysine 36 of histone H3 at active genes. J Biol Chem 280: 17732–17736.
2. Bernstein BE, Kamal M, Lindblad-Toh K, Bekiranov S, Bailey DK, et al. (2005) Genomic maps and comparative analysis of histone modifications in human and mouse. Cell 120: 169–181.
3. Okada Y, Feng Q, Lin Y, Jiang Q, Li Y, et al. (2005) hDOT1L links histone methylation to leukemogenesis. Cell 121: 167–178.
4. Jenuwein T, Allis CD (2001) Translating the histone code. Science 293: 1074–1080.
5. Cao R, Wang L, Xia L, Erdjument-Bromage H, Tempst P, et al. (2002) Role of histone H3 lysine 27 methylation in Polycomb-group silencing. Science 298: 1039–1043.
6. Rice JC, Briggs SD, Ueberheide B, Barber CM, Shabanowitz J, et al. (2003) Histone methyltransferases direct different degrees of methylation to define distinct chromatin domains. Mol Cell 12: 1591–1598.
7. Schubeler D, MacAlpine DM, Scalzo D, Wirbelauer C, Kooperberg C, et al. (2004) The histone modification pattern of active genes revealed through genome-wide chromatin analysis of a higher eukaryote. Genes Dev 18: 1263–1271.
8. Squazzo SL, Komashko VM, O’Geen H, Krig S, Jin VX, et al. (2006) Suz12 silences large regions of the genome in a cell type-specific manner. Genome Res 16: 890–900.
9. Peters AH, Kubicek S, Mechtler K, O’Sullivan RJ, Derijck AA, et al. (2003) Partitioning and plasticity of repressive histone methylation states in mammalian chromatin. Mol Cell 12: 1577–1589.
10. Martens JH, O’Sullivan RJ, Braunschweig U, Opravil S, Radolf M, et al. (2005) The profile of repeat-associated histone lysine methylation states in the mouse epigenome. EMBO J 24: 800–812.
11. Heintzman ND, Stuart RK, Hon G, Fu Y, Ching CW, et al. (2007) Distinct predictive chromatin signatures of transcriptional promoters and en-hancers in the human genome. Nat Genet 39: 311–318.
12. Clayton AL, Hazzalin CA, Mahadevan LC (2006) Enhanced histone acetylation and transcription: A dynamic perspective. Mol Cell 23: 289–296. 13. Klose RJ, Yamane K, Bae Y, Zhang D, Erdjument-Bromage H, et al. (2006) The transcriptional repressor JHDM3A demethylates trimethyl histone H3 lysine 9 and lysine 36. Nature 442: 312–316.
14. Cloos PA, Christensen J, Agger K, Maiolica A, Rappsilber J, et al. (2006) The putative oncogene GASC1 demethylates tri- and dimethylated lysine 9 on histone H3. Nature 442: 307–311.
15. Fodor BD, Kubicek S, Yonezawa M, O’Sullivan RJ, Sengupta R, et al. (2006) Jmjd2b antagonizes H3K9 trimethylation at pericentric heterochromatin in mammalian cells. Genes Dev 20: 1557–1562.
16. Whetstine JR, Nottke A, Lan F, Huarte M, Smolikov S, et al. (2006) Reversal of histone lysine trimethylation by the JMJD2 family of histone demethy-lases. Cell 125: 467–481.
17. Brinkman AB, Roelofsen T, Pennings SW, Martens JH, Jenuwein T, et al. (2006) Histone modification patterns associated with the human X chromosome. EMBO Rep 7: 628–634.
18. Bernstein BE, Mikkelsen TS, Xie X, Kamal M, Huebert DJ, et al. (2006) A bivalent chromatin structure marks key developmental genes in embryonic stem cells. Cell 125: 315–326.
19. Vakoc CR, Sachdeva MM, Wang H, Blobel GA (2006) Profile of histone lysine methylation across transcribed mammalian chromatin. Mol Cell Biol 26: 9185–9195.
20. Feldman N, Gerson A, Fang J, Li E, Zhang Y, et al. (2006) G9a-mediated irreversible epigenetic inactivation of Oct-3/4 during early embryogenesis. Nat Cell Biol 8: 188–194.
21. Lee TI, Jenner RG, Boyer LA, Guenther MG, Levine SS, et al. (2006) Control of developmental regulators by Polycomb in human embryonic stem cells. Cell 125: 301–313.
22. Roh TY, Cuddapah S, Cui K, Zhao K (2006) The genomic landscape of histone modifications in human T cells. Proc Natl Acad Sci U S A 103: 15782–15787.
23. Nielsen SJ, Schneider R, Bauer UM, Bannister AJ, Mrrison A, et al. (2001) Rb targets histone H3 methylation and HP1 to promoters. Nature 412: 561– 565.
24. Sripathy SP, Stevens J, Schultz DC (2006) The KAP1 corepressor functions to coordinate the assembly of de novo HP1-demarcated microenviron-ments of heterochromatin required for KRAB zinc finger protein-mediated transcriptional repression. Mol Cell Biol 26: 8623–8638.
25. Ayyanathan K, Lechner MS, Bell P, Maul GG, Schultz DC, et al. (2003)
Regulated recruitment of HP1 to a euchromatic gene induces mitotically heritable, epigenetic gene silencing: A mammalian cell culture model of gene variegation. Genes Dev 17: 1855–1869.
26. Kim A, Kiefer CM, Dean A (2006) Distinctive signatures of histone methylation in transcribed coding and noncoding human beta-globin sequences. Mol Cell Biol 27: 1271–1279.
27. Bracken AP, Dietrich N, Pasini D, Hansen KH, Helin K (2006) Genome-wide mapping of Polycomb target genes unravels their roles in cell fate transitions. Genes Dev 20: 1123–1136.
28. Lachner M, Jenuwein T (2002) The many faces of histone lysine methylation. Curr Opin Cell Biol 14: 286–298.
29. Sims IIIRJ,, Nishioka K, Reinberg D (2003) Histone lysine methylation: A signature for chromatin function. Trends Genet 19: 629–639.
30. Tachibana M, Sugimoto K, Nozaki M, Ueda J, Ohta T, et al. (2002) G9a histone methyltransferase plays a domiant role in euchromatic histone H3 lysine methylation and is essential for early embryogenesis. Genes Dev 16: 1779–1791.
31. Vandel L, Nicolas E, Vaute O, Ferreira R, Ait-si-ali S, et al. (2001) Transcriptional repression by the retinoblastoma protein through the recruitment of a histone methyltransferase. Mol Cell Biol 21: 6484–6494. 32. Ogawa H, Ishiguro K, Gaubatz S, Livingston DM, Nakatani Y (2002) A
complex with chromatin modifiers that occupies E2F- and Myc-responsive genes in G0 cells. Science 296: 1132–1136.
33. Fang S, Miao J, Xiang L, Ponugoti B, Treuter E, et al. (2007) Coordinated recruitment of histone methyltransferase G9a and other chromatin-modifying enzymes in SHP-mediated regulation of hepatic bile acid metabolism. Mol Cell Biol 27: 1407–1424.
34. Schultz DC, Ayyanathan K, Negorev D, Maul GG, Rauscher FJ 3rd (2002) SETDB1: A novel KAP-1-associated histone H3, lysine 9-specific methyl-transferase that contributes to HP1-mediated silencing of euchromatic genes by KRAB zinc-finger proteins. Genes Dev 16: 919–932.
35. Peters AH, O’Carroll D, Scherthan H, Mechtler K, Sauer S, et al. (2001) Loss of the Suv39h histone methyltransferases impairs mammalian heterochro-matin and genome stability. Cell 107: 323–337.
36. Urrutia R (2003) KRAB-containing zinc-finger repressor proteins. Genome Biol 4: 231.
37. Bieda M, Xu X, Singer M, Green R, Farnham PJ (2006) Unbiased location analysis of E2F1 binding sites suggests a widespread role for E2F1 in the human genome. Genome Research 16: 595–605.
38. Cawley S, Bekiranov S, Ng HH, Kapranov P, Sekinger EA, et al. (2004) Unbiased mapping of transcription factor binding sites along human Chromosomes 21 and 22 points to widespread regulation of noncoding RNAs. Cell 116: 499–509.
39. Carroll JS, Liu XS, Brodsky AS, Li W, Meyer CA, et al. (2005) Chromosome-wide mapping of estrogen receptor binding reveals long-range regulation requiring the forkhead protein FoxA1. Cell 122: 33–43.
40. Grimwood J, Gordon LA, Olsen A, Terry A, Schmutz J, et al. (2004) The DNA sequence and biology of human Chromosome 19. Nature 428: 529– 535.
41. Tupler R, Perini G, Green MR (2001) Expressing the human genome. Nature 409: 832–833.
42. Abrink M, Ortiz JA, Mark C, Sanchez C, Looman C, et al. (2001) Conserved interaction between distinct Kruppel-associated box domains and the transcriptional intermediary factor 1 beta. Proc Natl Acad Sci U S A 98: 1422–1426.
43. Friedman JR, Fredericks WJ, Jensen DE, Speicher DW, Huang X-P, et al. (1996) KAP-1, a novel corepressor for the highly conserved KRAB repression domain. Genes Dev 10: 2067–2078.
44. Vogel MJ, Guelen L, de Wit E, Peric-Hupkes D, Loden M, et al. (2006) Human heterochromatin proteins form large domains containing KRAB-ZNF genes. Genome Res 16: 1493–1504.
45. Ryan RF, Schultz DC, Ayyanathan K, Singh PB, Friedman JR, et al. (1999) KAP-1 corepressor protein interacts and colocalizes with heterochromatic and euchromatic HP1 proteins: A potential role for Kruppel-associated box-zinc finger proteins in heterochromatin-mediated gene silencing. Mol Cell Biol 19: 4366–4378.
46. Rinn JL, Bondre C, Gladstone HB, Brown PO, Chang HY (2006) Anatomic demarcation by positional variation in fibroblast gene expression programs. PLoS Genet 2: e119. doi:10.1371/journal.pgen.0020119 47. O’Geen H, Nicolet CM, Blahnik K, Green R, Farnham PJ (2006) Comparison
of sample preparation methods for ChIP-chip assays. Biotechniques 41: 577–580.