Pigmentation Identifies Novel Genes and Pathways That
Impact Melanogenesis in Human Cells
Anand K. Ganesan1,2.*, Hsiang Ho2., Brian Bodemann3
, Sean Petersen4, Jayavani Aruri1, Shiney Koshy1, Zachary Richardson1, Lu Q. Le5, Tatiana Krasieva6, Michael G. Roth4, Pat Farmer7, Michael A. White3*
1Department of Dermatology, University of California Irvine, Irvine, California, United States of America,2Department of Biological Chemistry, University of California Irvine, Irvine, California, United States of America,3Department of Cell Biology, University of Texas Southwestern Medical Center, Dallas, Texas, United States of America,
4Department of Biochemistry, University of Texas Southwestern Medical Center, Dallas, Texas, United States of America,5Department of Dermatology, University of Texas Southwestern Medical Center, Dallas, Texas, United States of America,6Beckman Laser Institute, University of California Irvine, Irvine, California, United States of America,7Department of Chemistry, University of California Irvine, Irvine, California, United States of America
Abstract
Melanin protects the skin and eyes from the harmful effects of UV irradiation, protects neural cells from toxic insults, and is required for sound conduction in the inner ear. Aberrant regulation of melanogenesis underlies skin disorders (melasma and vitiligo), neurologic disorders (Parkinson’s disease), auditory disorders (Waardenburg’s syndrome), and opthalmologic disorders (age related macular degeneration). Much of the core synthetic machinery driving melanin production has been identified; however, the spectrum of gene products participating in melanogenesis in different physiological niches is poorly understood. Functional genomics based on RNA-mediated interference (RNAi) provides the opportunity to derive unbiased comprehensive collections of pharmaceutically tractable single gene targets supporting melanin production. In this study, we have combined a high-throughput, cell-based, one-well/one-gene screening platform with a genome-wide arrayed synthetic library of chemically synthesized, small interfering RNAs to identify novel biological pathways that govern melanin biogenesis in human melanocytes. Ninety-two novel genes that support pigment production were identified with a low false discovery rate. Secondary validation and preliminary mechanistic studies identified a large panel of targets that converge on tyrosinase expression and stability. Small molecule inhibition of a family of gene products in this class was sufficient to impair chronic tyrosinase expression in pigmented melanoma cells and UV-induced tyrosinase expression in primary melanocytes. Isolation of molecular machinery known to support autophagosome biosynthesis from this screen, together with in vitro and in vivo validation, exposed a close functional relationship between melanogenesis and autophagy. In summary, these studies illustrate the power of RNAi-based functional genomics to identify novel genes, pathways, and pharmacologic agents that impact a biological phenotype and operate outside of preconceived mechanistic relationships.
Citation:Ganesan AK, Ho H, Bodemann B, Petersen S, Aruri J, et al. (2008) Genome-Wide siRNA-Based Functional Genomics of Pigmentation Identifies Novel Genes and Pathways That Impact Melanogenesis in Human Cells. PLoS Genet 4(12): e1000298. doi:10.1371/journal.pgen.1000298
Editor:Gregory S. Barsh, Stanford University School of Medicine, United States of America
ReceivedAugust 1, 2008;AcceptedNovember 5, 2008;PublishedDecember 5, 2008
Copyright:ß2008 Ganesan et al. This is an open-access article distributed under the terms of the Creative Commons Attribution License, which permits unrestricted use, distribution, and reproduction in any medium, provided the original author and source are credited.
Funding:This work was supported by the National Institutes of Health (CA71443), the Robert Welch Foundation (I-1414), the Mary K. Ash Cheritable Foundation (076-06), the National Cancer Institute (P30CA62203), and a pilot and feasibility grant from Galderma Laboratories. This research was performed with support from the Laser Microbeam Program (LAMMP), A NIH Biomedical Technology Resource, grant#P41-RR01192 at the University of California, Irvine. BB is supported by DoD (W81XWH060749).
Competing Interests:The authors have declared that no competing interests exist. * E-mail: [email protected] (AKG); [email protected] (MAW) .These authors contributed equally to this work.
Introduction
Significant effort has been focused on identifying the molecular etiology for pigment variation in skin [1]. 127 mouse coat color genes have been identified [2], 68 of these genes have human homologues, and 29 of these homologues impact pigmentation in humans. Genetic mapping studies have identified a limited set of genes responsible for skin and eye color variability [3]. Pigment production involves the concerted actions of transcriptional, translational, and intracellular trafficking machinery [4]. MITF, the master regulator of melanogenesis in the mouse hair follicle [5], activates the transcription of tyrosinase, the rate limiting step in melanogenesis [5]. Tyrosinase is translated in the endoplasmic
play a role in the etiology of age related macular degeneration [13] and Parkinson’s disease [14]. Additionally, melanin is aberrantly regulated in human skin disorders such as vitiligo and melasma. Harnessing the molecular mechanisms that regulate melanogen-esis to selectively modulate melanin production in the skin, eye, or brain could lead to novel treatments for multiple human pathologies. Pharmacologic modulation of melanin production has primarily focused on identifying inhibitors of tyrosinase, the rate limiting step in pigment production [15]. Currently utilized tyrosinase inhibitors are clinically effective, but are carcinogenic in animal studies [16]. Pharmacologic agonists that stimulate pigmentation in human tissues remain to be identified. A better understanding of the molecular network governing pigment production in the human epidermis is indicated to aid design of agents that inhibit or stimulate pigmentation in human skin.
Results/Discussion
Studies to determine the key molecular regulators of melanogen-esis in human melanocytes have been hampered by the innate fragility of these cells and the fact that they produce scant amounts of pigment in culture [17,18]. To identify novel regulators of melanogenesis in human cells, we utilized MNT-1 melanoma cells to screen a genome-wide synthetic siRNA library for single-gene loci that support melanocyte pigmentation. MNT-1 cells produce substantial amounts of melanin in culture, have a gene expression profile that is most similar to normal melanocytes [19], and have been used by others to identify pigment regulatory mechanisms that govern normal melanogenesis [20–23]. We employed a previously described [24] Dharmacon siRNA library of 84,508 siRNAs corresponding to four unique siRNA duplexes, targeting each of the 21,127 unique human genes arrayed in a one-gene/one-well format on 96 well microtiter plates. A spectrophotometric melanin quantitation assay was coupled with an ATP-dependent
lumines-cence cell viability assay (CellTiter-Glo) to eliminate siRNAs that decrease melanin production as a consequence of impacts on either cell proliferation or cell survival. Using tyrosinase depletion as a positive control, we determined that a 5-day post-transfection incubation period was optimal for quantitative detection of impaired melanin production (Figure S1). Other studies demonstrated that the cell titer glo assay did not interfere with the spectrophotometric quantitation of melanin (data not shown). In order to identify genes that impact both pheomelanin and eumelanin production, we measured melanin content at 405 nm [25], a wavelength at which both pheomelanin and eumelanin absorb light.
Raw A405nm absorbance values were normalized to internal
reference samples on each plate to permit plate-to-plate compar-isons. This analysis was followed by normalization to the experimental mean for each well location calculated from the full data set in order to control for variations in pigment due to plate position effects. Similarly adjusted luminescence values from the multiplexed viability assay were used to generate ‘‘normalized absorbance ratios’’ for each well (Table S1). The distribution of the means of these values from duplicate analyses is shown in Figure S1B. Previous studies have identified 68 genes that regulate pigment production in human cells. Initial examination of our dataset determined that siRNAs directed towards 13 of these 68 genes impaired melanin accumulation without impacting melano-cyte survival or proliferation when depleted in these assays, with tyrosinase itself scoring with one of the lowest ratios (2.5 standard deviations below the mean; Table S2). Our current siRNA screening protocol relies on siRNA design algorithms to identify effective siRNA sequences and utilizes a single endpoint assay to identify siRNAs that impact pigment production. Genes whose function is not inhibited by selected siRNAs either secondary to the long half-life of the corresponding protein or secondary to poor siRNA sequence selection would not be identified in our screening approach. Identification of several known regulators of melano-genesis by our screening protocol does give confidence that our approach is sufficiently robust to identify novel regulators of pigment production.
To facilitate the identification of novel genes that significantly impact melanogenesis, a cutoff of 2 standard deviations below the mean was used to select a candidate hit list. 98 genes were identified as regulators of melanogenesis by our screening approach. Of these 98 genes identified in the primary screen, only 6/98 genes (marked in red, Table 1) exhibited aberrant expression in MNT-1 cells as compared to normal melanocytes [19], indicating that the screen identified a large number of genes that likely impacted melanogenesis in both primary melanocytes and MNT-1 cells. Two of the genes identified in our screening approach were more recently eliminated from the Refseq database, and were not subject to detailed further evaluation.
Individually synthesized, pooled siRNAs directed against 35 of the 96 remaining genes selected from the primary screen, as described above, were retested to determine the false-positive rate (Table S4). These genes were randomly selected from the putative target list. To more precisely control for the efficacy of siRNA transfection and to correct for the background absorbance of MNT-1 cells, the ability of each target siRNA to inhibit pigment production was compared to the ability of tyrosinase siRNA to inhibit pigment production using a normalized percent inhibition calculation [26], and relative pigmentation was assessed visually prior to cell lysis (Figure 1A,B). A Keratin 7 siRNA pool that did not impact pigment production was utilized as a negative control. Four siRNA pools failed to significantly impact pigment production upon retesting and were eliminated from further analysis (Figure 1A, Table S4), giving an estimated false discovery Author Summary
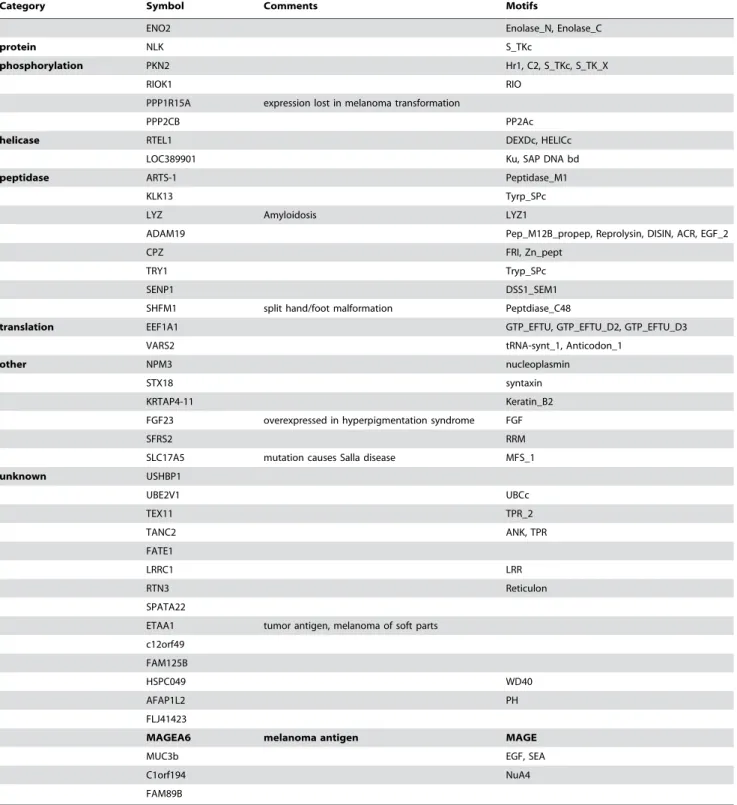
Table 1.Candidate Pigmentation Genes.
Category Symbol Comments Motifs
autophagy MAP1LC3C MAP1_LC3
WIPI1 expressed in melanoma cell autophagosomes WD40
GPSM1 GoLoco
GPCR GNG2 GGL
GPR113 GPS, 7tm_2
EDNRA linked to migraine resistance 7tm_1
OR4F15 7tm_1
EDG7 7tm_1
GPR92 7tm_1
AGTR2 linked to mental retardation 7tm_1
GRM7 ANF_receptor, NCD3G, 7tm_3
GPR84 7tm_1
P2RY1 7tm_1
transcription PLAGL1 mutation causes Beckwith-Wiedeman syndrome Znf_C2H2
EZH1 SANT, SET
TEF maps to pigment mutations in mice BRLZ GATAD2A
ILF2 DZF
SMARCC2 CHROMO, SWIRM, SANT
pigment TYR Albinism Tyrosinase
BMP1 ZnMc, CUB, EGF_CA
phospholipid PNPLA4 Patatin
signaling ZFYVE1 FYVE
ITPK1 maps near SNPs linked to pigmentation Ins134_P3_kin
PLCXD1 PLCc
NRGN IQ
PLEKHA1 linked to age related macular degeneration PH
Ras family RAB4A RAB
GTPase HRASLS NC
ARL4A ARF, small_GTPase
ZDHHC9 linked to mental retardation zf-DHHC
C5ORF5 RhoGAP
ARHGEF11 PDZ, RGS, PH, RhoGEF
KLC4 Rab5-bind, TPR
protease SERPINB2 SERPIN
inhibitor WFDC8 WAP, KU
SERPINE1 SERPIN
SERPINB1 SERPIN
metabolism NT5E Metallophos, 5_nucleotid_C
G6PC3 AcidPPc
UROD mutation causes porphyria cutanea tarda URO-D HPD mutation causes tyrosinemia type III glyoxalase
ALDH9A1 Aldedh
PLTP BPI1, BPI2
MSRA downregulated in vitiligo (hypopigmentation) PMSR
SMOX Amino_oxidase, DAO
UEVLD UBCc, Ldh_1_N, Ldh_1_C
GMPPB NTP_transferase, Hexapep
ALDH1A1 expression lost in Parkinson’s disease Aldedh
Category Symbol Comments Motifs
ENO2 Enolase_N, Enolase_C
protein NLK S_TKc
phosphorylation PKN2 Hr1, C2, S_TKc, S_TK_X
RIOK1 RIO
PPP1R15A expression lost in melanoma transformation
PPP2CB PP2Ac
helicase RTEL1 DEXDc, HELICc
LOC389901 Ku, SAP DNA bd
peptidase ARTS-1 Peptidase_M1
KLK13 Tyrp_SPc
LYZ Amyloidosis LYZ1
ADAM19 Pep_M12B_propep, Reprolysin, DISIN, ACR, EGF_2
CPZ FRI, Zn_pept
TRY1 Tryp_SPc
SENP1 DSS1_SEM1
SHFM1 split hand/foot malformation Peptdiase_C48
translation EEF1A1 GTP_EFTU, GTP_EFTU_D2, GTP_EFTU_D3
VARS2 tRNA-synt_1, Anticodon_1
other NPM3 nucleoplasmin
STX18 syntaxin
KRTAP4-11 Keratin_B2
FGF23 overexpressed in hyperpigmentation syndrome FGF
SFRS2 RRM
SLC17A5 mutation causes Salla disease MFS_1
unknown USHBP1
UBE2V1 UBCc
TEX11 TPR_2
TANC2 ANK, TPR
FATE1
LRRC1 LRR
RTN3 Reticulon
SPATA22
ETAA1 tumor antigen, melanoma of soft parts c12orf49
FAM125B
HSPC049 WD40
AFAP1L2 PH
FLJ41423
MAGEA6 melanoma antigen MAGE
MUC3b EGF, SEA
C1orf194 NuA4
FAM89B
Our siRNA-based screening approach identified 98 siRNAs that significantly inhibited pigment production. 4 of these 98 genes did not retest, while two of the 98 genes were removed from the Refseq database. Gene Ontology databases were used to segregate the 92 remaining genes into function classes and identify conserved domains within the corresponding proteins. Gene ontology databases, OMIM, and Pubmed searching was utilized to identify associations between our genes and human diseases. Genes in our candidate list that are aberrantly expressed in MNT-1 cells as compared to normal melanocytes are shown in bold.
doi:10.1371/journal.pgen.1000298.t001
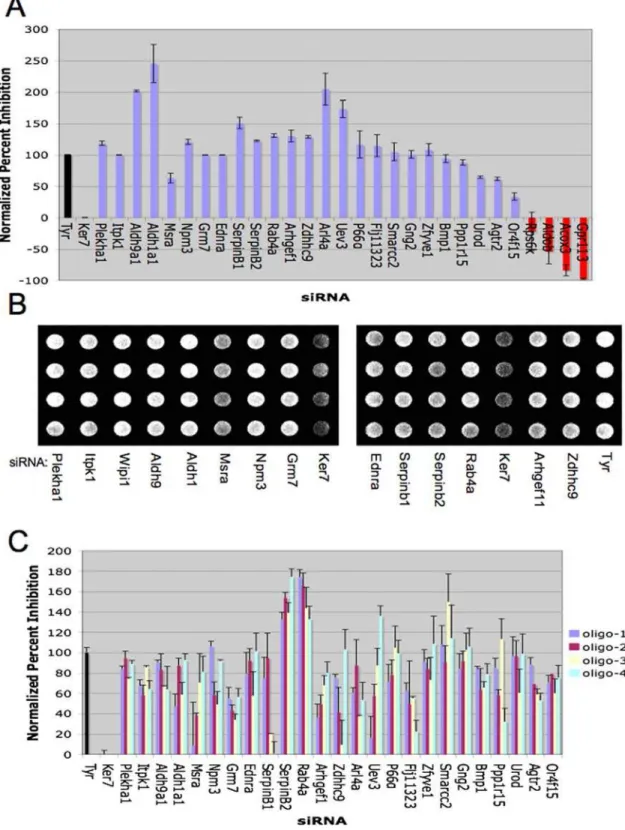
Figure 1. Validation of novel gene products supporting melanogensis.A) MNT-1 cells were transfected with the indicated siRNA pools (50 nM final concentration) targeting 35 of the 94 positive regulators of melanogenesis identified in the primary screen. siRNAs targeting Ker7, a gene that does not impact pigment production, were used as a negative control (black bar). A normalized percent inhibition calculation [26] was employed to compare the consequences of each siRNA pool on pigmentation with that observed upon depletion of tyrosinase. Bars represent mean and s.e.m. for n = 3. Red bars indicate failure to significantly suppress pigmentation. The results of the analysis of these 35 genes are shown in this panel (those genes that were not putative autophagy regulators) and in Figure 3 (putative autophagy regulators). A summary of the results for all 35 genes is shown in Table S4. B) A light micrograph of a representative opaque-walled, clear-bottomed 96-well microtiter plate containing MNT-1 cell monolayers 7 days post transfection with the indicated siRNAs is shown. C) Four independent siRNAs targeting the indicated genes (see Table S3 for siRNA sequence information) were separately tested for the capacity to suppress pigmentation as in (A). Associated p-values (student’s t-test) are reported in Table S4.
rate of 12.1%. To validate that our candidate siRNAs inhibit the expression of the gene of interest, we utilized quantitative RT PCR to examine if a random selection of candidate siRNA pools inhibited the expression of the appropriate target gene (Figure S2). These results validate that the siRNAs selectively impact the expression of the cognate target gene, although this may not conceivably hold true for all of the siRNAs used in our screen. To eliminate siRNA pools with off-target effects on melanogenesis [24], the four siRNAs comprising each siRNA pool were retested individually. We found that at least two independent siRNAs against each target gene significantly inhibited pigment production (Figure 1C, Table S4), suggesting that pigmentation phenotypes are not a common consequence of siRNA off-target phenomena. Together, these studies demonstrate that the genome wide siRNA screening platform accurately identified gene targets that specif-ically impact pigment production.
Initial examination of existing GO annotation data for our pigment regulators exposed a wide variety of cellular processes represented by the validated and candidate hits (Table 1). Therefore, we employed a focused unbiased approach to identify regulators of tyrosinase, the rate limiting enzyme specifying melanogenesis [15] among novel validated genes supporting MNT-1 pigmentation. Relative accumulation of tyrosinase, the melanogenesis transcription factor MITF, and the melanosomal marker protein Melan-A were examined 96 hours post siRNA transfection. Remarkably, over half of the validated pigment genes appear to be required for tyrosinase protein accumulation (Figure 2A, Figure S3). This defect did not appear to be a gross inhibition of cell fate specification, as Melan-A expression was mostly unaffected. In addition, the sub cellular morphology of PMEL17, a melanosome structural protein [27], was normal at the level of immunofluorescence detection (Figure S4). Of those pigment genes impacting tyrosinase accumulation, approximately half appear to act at the level of tyrosinase mRNA accumulation (Table 2), and most of these also impaired MITF mRNA accumulation. Given that tyrosinase is an MITF target gene, the pigmentation genes in this later class may represent action at the level of MITF mRNA. A caveat to this interpretation is our observation that siRNA-mediated turnover of tyrosinase mRNA can also lead to inhibition of MITF gene expression (Figure 2A) through a relationship that remains to be defined. Preliminary studies indicated that this phenotype was not a consequence of siRNA off-target phenomenon (Figure S3).
While pigmentation in humans is a complex multigenic trait, the degree of genetic variation that contributes to melanocyte autonomous pigment production is unknown. To examine the phenotypic penetrance of novel pigmentation genes, identified in MNT-1 cells, in diverse genetic backgrounds, we employed primary human melanocyte cultures isolated from two different individuals. Remarkably, the majority of targets that regulated tyrosinase expression in MNT-1 cells also impacted tyrosinase expression when depleted from darkly pigmented primary melanocytes (Figure 2C, Figure S5A). Approximately half of these targets also inhibited tyrosinase expression when depleted from moderately pigmented melanocytes (Figure 2C, Figure S5B). These results indicate that the primary screen identified a number of genes that impact pigment production in several different genetic backgrounds. Selective activity of some of these targets in different genetic backgrounds suggests that some of these novel regulators of melanogenesis may play a role in human phenotypic variation. Future large scale studies are required to determine if these genes are differentially expressed in different pigment backgrounds.
For further analyses, we focused on those novel pigmentation genes that impacted tyrosinase expression in all three genetic
backgrounds. Among these were two isoforms of aldehyde dehydrogenase, ALDH1A1 and ALDH9A1, well characterized enzymes that regulate ethanol detoxification [28]. A number of chemical inhibitors of these enzymes have been identified [29], and several of these agents are clinically utilized to induce alcohol intolerance during detoxification interventions; presenting an opportunity for pharmacological validation of the contribution of Aldh activity to melanocyte pigmentation. Disulfiram is an Aldh inhibitor that is toxic to melanoma cells via a mechanism that is independent of Aldh inhibition [30]. However, two non-toxic Aldh inhibitors, cyanamide and Angeli’s salt [29], inhibited pigmenta-tion and tyrosinase protein accumulapigmenta-tion in MNT-1 cells at doses that are equivalent to those required for inhibition of Aldh activity in culture (Figure 2D). For quantifying the impact of compound treatment on pigment accumulation, we used our spectrophoto-metric-based melanin quantitation assay that couples a CellTiter-Glo assay with a melanin quantitation assay to effectively eliminate compounds that impact cell survival or proliferation. Cyanamide did not appear to impact the viability of MNT-1 cells or primary melanocytes in culture. In addition, these compounds impaired UV-induced tyrosinase expression when tested in primary melanocytes (Figure 2D,E).
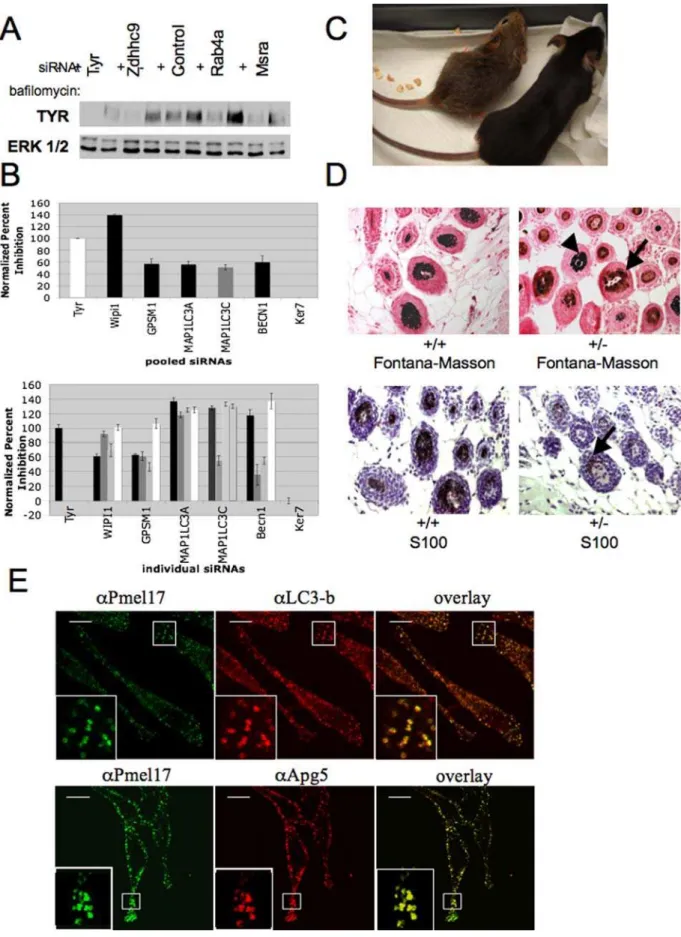
Melanosomes are distinct lysosome-related organelles depen-dent upon appropriate post-golgi sorting events for delivery of functionalizing ‘cargo’ including tyrosinase [31]. Therefore, impaired accumulation of tyrosinase can be a consequence of misrouting to lysosomes and subsequent hydrolysis in that organelle. To define target genes that may participate in this sorting event, lysosome acidification was inhibited by bafilomycin A1 exposure subsequent to target gene depletion [32]. As shown in Figure 3A, a 24 hour inhibition of lysosome acidification rescued tyrosinase accumulation upon depletion of the small G-protein RAB4A, and the small G-protein palmitoyltransferase ZDHHC9. By contrast, bafilomycin did not restore tyrosinase accumulation upon depletion of MSRA, a protein that can protect against oxidative damage through reduction of methionine sulfoxide. These studies offered preliminary evidence that our screening approach did identify novel genes that impact melanosome trafficking/sorting of melanosome protein cargo.
Gene annotation data was utilized to identify other genes that may regulate melanosome intracellular trafficking/sorting of melanosome protein cargo. Among the panel of validated pigment regulatory genes with phenotypic penetrance in multiple genetic backgrounds was WIPI1 (Figure 2). Wipi1 has been implicated as a human homolog of the yeast autophagy protein ATG18, and is localized to starvation-induced autophagosomes in human cell culture [33]. Two additional autophagy-related proteins, LC3-C and GPSM1/AGS3 were isolated in the primary screen (Table 1). Autophagy, or cellular self-degradation, is a highly conserved cellular pathway that has been associated with cancer formation, neurodegeneration, and aging [34–36]. This pathway functions to transport vesicle cargo (autophagosomes) to the lysosome for degradation [35]. Scant evidence currently exists linking autoph-agy to melanogenesis. Previous studies have documented an abundance of autophagosomes in cells obtained from patients with a disorder of pigmentation (HPS-1) but have hypothesized that their presence is a consequence of the degradation of immature melanosomes within these cells [37]. Other studies have determined that autophagosome components are present in the stage II melanosome, suggesting that parts of the melanosome originate from the autophagosome [38].
relationship between autophagosome and melanosome biogenesis (Figure 3B). Furthermore, we found that depletion of two additional components required to trigger autophagosome forma-tion, BECN1 or LC3-A, severely impaired pigment accumulation
(Figure 3B). Failure to recover these genes in the primary screen is indicative of the false negative rate inevitably associated with high throughput investigations and illustrates the point that our approach is unlikely to identify all known regulators of Figure 2. Novel, pharmaceutically-tractable melanogenesis gene networks converge on tyrosinase expression. A) 4 days post transfection with the indicated siRNAs, MNT-1 whole cell lysates were prepared and analyzed by immunoblot for the indicated proteins. A non-targeting siRNA was used as a transfection control (Control). ERK1/2 is shown as a loading control. B) Those siRNAs that inhibited tyrosinase accumulation were examined for consequences on tyrosinase and MITF gene expression by quantitative RT-PCR. 72 hours post transfection with the indicated siRNAs, equal numbers of MNT-1 cells were lysed and cDNA was prepared using a Cells to Ct kit (Ambion). Taqman qRT PCR assays (Applied Biosystems) for tyrosinase and MITF was utilized to identify siRNAs that impacted tyrosinase and MITF expression. C) The indicated siRNAs, targeting novel pigmentation genes identified in the MNT-1 screen, were tested for consequences on tyrosinase accumulation in darkly pigmented and moderately pigmented primary human melanocyte cultures 6 days post-transfection. The results presented here is a venn diagram of the data presented in Figure S5 demonstrating that we have identified pigment regulators that differentially impact pigment production in different genetic backgrounds. D) Pharmacological inhibition of Aldh activity impacts tyrosinase protein accumulation. MNT-1 cells (left panel) and primary melanocyte cultures (right panels) were exposed to 5mM Aldh inhibitors (cyanamide or Angeli’s salt) or the tyrosinase inhibitor hydroquinone [15] for 72 hours as indicated. 24 hours post-treatment, cultures were exposed to UV-B at the doses indicated. Tyrosinase and ERK1/2 levels were assessed by immunoblot. MNT-1: Angeli’s salt (5mM), cyanamide (5mM), or hydroquinone (5mM); primary melanocytes: Angeli’s salt (50mM), cyanamide (100mM), hydroquinone (1mM). E) Aldh inhibitors impair melanogenesis in primary human melanocytes. Darkly pigmented melanocytes were cultured for seven days in the presence of the indicated dosed of cyanamide (cya), vehicle, or PTU. PTU is the most potent currently knownin vitro pigment inhibitor in primary melanocytes [43]. Subsequently, cells were lysed in CellTiter-Glo and the luminescence and absorbance values were used to calculate inhibition of pigmentation as in Figure 1A.
melanogenesis. Nonetheless, the validation that both Beclin1 and Lc3 impact pigment accumulation is supporting evidence that autophagy impacts melanogenesis. Consistent with this relation-ship, heterozygous deletion of the autophagy protein Beclin 1 [39] results in a dramatic coat color defect in mice (Figure 3C, Figure S6). Homozygous null mutations are embryonic lethal, however haploinsufficient animals show an interesting chimeric phenotype with normal and hypopigmented hair follicles. The hypopigment-ed follicles in these mice contain less pigment in the hair follicle bulb as observed on horizontal sections of the hair follicle. Previous studies have determined that only melanoblasts within the hair follicle unit express S100b protein [40]. To determine if the phenotype observed in beclin1 haploinsuffiicient mice is secondary to an impact of beclin1 depletion on melanoblast survival, we attempted to identify S100+melanoblasts within the hair follicle in horizontally sectioned skin specimens of wild type and Beclin1 haploinsufficient mice. Consistent with published
studies, it was difficult to identify S100 positive cells within the hair follicle of wild type mice secondary to interfering melanin [40]. However, in Beclin1 haploinsufficient mice, we determined that S100+cells were present in the hair follicle (Figure 3D). Data from our siRNA screen indicated that beclin1 depletion does not impact melanocyte survival. Taken together, our siRNA data and histologic analysis suggests that the phenotype observed in the Beclin1 haploinsuficient mice is not a consequence of impacts of Beclin1 on melanocyte survival but is more likely secondary to the impact of beclin1 on melanosome number or melanin content within the hair follicle. As melanosomes are thought to be lysosome related organelles, autophagic machinery may be required for the functional sorting of melanin synthetic machinery. At the cell autonomous level, we found co-localization of the autophagy proteins LC3 and APG5 and the melanosome markers PMEL17 in mature melanosomes (Figure 3E). Thus molecular components required for autophagosome formation are directly implicated in the biogenesis of melanin, either at the level of melanosome formation or melanosome maturation. When cou-pled with previous data demonstrating that autophagosomes accumulate in cells defective in melanosome maturation, these results indicate that the autophagy pathway is intimately involved in the process of melanosome maturation [37].
We have utilized an unbiased, high-throughput functional genomics screening platform to identify critical single gene loci that regulate the notoriously complex, highly regulated process of melanogenesis in human cells. Using this approach, we have identified 92 novel genes that impact pigment production in human cells. The convergence of several of these loci directly on the critical rate-limiting enzyme in melanogenesis, tyrosinase, underscores the power of this approach to identify unrecognized genes that are components of even well characterized enzymatic pathways. The complexity of the network controlling tyrosinase expression uniquely parallels the variation in skin color seen in human skin, underscored by the fact that these mechanisms are differentially active in moderately and darkly pigmented melanocytes. The direct identi-fication of novel pigment modulatory agents highlights the utility of genome wide siRNA screening as a translational approach for deriving novel molecular based treatment strategies.
Methods
Cell Culture and Reagents
MNT-1 cells were a gift of M. Marks (University of Pennylvania). These cells were cultured in DMEM (Invitrogen) with 15% fetal bovine serum (Hyclone), 10% AIM-V medium (Invitrogen), 1xMEM (Invitrogen) and 16antibiotic/antimycotic (Invitrogen). Darkly pigmented and moderately pigmented melanocytes were purchased from Cascade Biologics. These cells were cultured in Medium 254 with the melanocyte specific HMGS supplement (Cascade Biologics). Beclin 1 heterozygous mice were obtained from Beth Levine. Angeli’s salt was a gift from Pat Farmer. Cyanamide was purchased from Sigma. Bafilomycin A1 was purchased from Tocris Biosciences. The genome wide siRNA library used in these studies was previously described [24]. RPMI 1640 (Invitrogen) was media used for creating lipid oligonucleotide mixtures. All transfections utilized Dharmafect-2 transfection reagent (Dharmacon). For western blotting we utilized the following antibodies: tyrosinase (Santa Cruz Biotechnology, cat
# sc-7833), MITF (Santa Cruz Biotechnology, sc-56725), Erk1 (Santa Cruz Biotechnology, sc-94), and Melan-A (Santa Cruz Biotechnology, sc28871). Primary antibody dilutions used in these studies ranged form 1:200 to 1:1000 and anti mouse or anti rabbit HRP antibodies (Santa Cruz Biotechnology) were used in the Table 2.Genome-Wide siRNA Screening Identifies Targets
That Differentially Impact Tyrosinase and MITF Expression.
Phenotype Symbol MITF Tyrosinase Melan A .TYR and MITF TYR .RNA .RNA NO CHANGE mRNA WIPI1 .RNA .RNA .PROTEIN
ALDH1A1 .RNA .RNA NO CHANGE ALDH9A1 .RNA .RNA NO CHANGE PLEKHA1 .RNA .RNA .PROTEIN RAB4A .RNA .RNA mPROTEIN SERPINB2 .RNA .RNA mPROTEIN MSRA .RNA .RNA NO CHANGE NPM3 .RNA .RNA mPROTEIN
.MITF mRNA ARHGEF11 .RNA .PROTEIN NO CHANGE
.TYR protein ZDHHC9 .RNA .PROTEIN NO CHANGE ITPK1 .RNA .PROTEIN .PROTEIN
.MITF mRNA AGTR2 .RNA NO CHANGE NO CHANGE
.TYR protein PPP1R15A .PROTEIN .PROTEIN NO CHANGE ZFYVE1 NO CHANGE .PROTEIN NO CHANGE
.MITF protein GNG2 .PROTEIN NO CHANGE NO CHANGE no change in EDNRA NO CHANGE NO CHANGE mPROTEIN MITF or TYR SMARCC2 NO CHANGE NO CHANGE NO CHANGE
FLJ1123 NO CHANGE NO CHANGE NO CHANGE UROD NO CHANGE NO CHANGE NO CHANGE UEV3 NO CHANGE NO CHANGE NO CHANGE ARL4A NO CHANGE NO CHANGE NO CHANGE P66A NO CHANGE NO CHANGE NO CHANGE OR4F15 NO CHANGE NO CHANGE NO CHANGE
immunoblot analysis. Antibodies used for immunofluorescence are described below. S100B antibody was purchased from DakoCy-tomation.
High Throughput Transfection Protocol
High throughput transfection was performed essentially as described [24] with slight modifications. 0.28 pmoles of each siRNA pool in a volume of 30 ul of RPMI was delivered to each of 6 assay plates/master plate using a Biomek FX robotic liquid handler (Beckman Coulter). 0.1 ul of Dharmafect 2 (Dharmacon) in 9.9 ul of RPMI was then delivered to each well using a TiterTek Multidrop. Following a 20–30 minute incubation, 16104MNT-1 cells from a trypsin-mediated single-cell suspension were delivered to the siRNA/liposome complexes in a total volume of 200 ul. Plates were incubated for 120 hours at 37uC/5% CO2 after which a Hydra 96 (Robbins-Scientific) was used to removed 100 ul of the medium. 15 ul of CellTiter-Glo Reagent (CTG) (Promega) was delivered to each well and incubated according to manufacturer protocol. Luminescence and absorbance values for each well was recorded using an Envision Plate Reader (Perkin Elmer). Each transfection was performed in duplicate.
Data Normalization
Raw luminescence values collected from the high throughput screen were normalized to internal reference control samples (cells with no siRNA in wells A1–A8) on each plate to allow for plate-to-plate comparisons. These values were used to normalize absorbance values for each well in the plate, effectively controlling for the impact of each siRNA on cell viability. To normalize for positional variation in the plates secondary to prolonged culture times in the humidified incubator, each well in the plate was normalized to the mean value from all wells in the same location. Mean and standard deviation for each data point and the mean and standard deviation of the entire distribution was calculated. siRNAs that produced absorbance/CellTiter-Glo ratios two standard deviations below the mean were subjected to further analysis.
Quantitative RT-PCR
46103MNT-1 cells were transfected in 96 well plates with 50 nM
candidate siRNA using 0.2 ul dharmafect 2 reagent. 48 hours after transfection, cDNA was prepared from transfected cells utilizing a Cells to Ct kit (Ambion) per the manufacterer’s protocol. Primers targeting each candidate gene, tyrosinase, actin and MITF were purchased from Applied Biosystems. An aliquot of each cDNA reaction was then added to each Taqman master mix reaction along with the appropriate primer per the manufacturer’s protocol (Applied Biosystems). A 7900HT Fast Real-Time PCR System (Applied Biosystems) was utilized to determine Ct values. Values were normalized using actin and analyzed using the relative quantification mathematical model (Pfaffl).
Drug Treatment
16104MNT-1 cells were plated in a 96 well microtiter plate.
24 hours after plating, cells were incubated with vehicle, hydroquinone Angeli’s salt, or cyanamide. 48 hours after drug treatment, cell lysates were prepared and subjected to immuno-blotting with a tyrosinase and ERK antibody. Similar protocols were utilized in primary melanocytes. Melanocytes were plated in 96 well microtiter plates in the presence of drug or vehicle. 24 hours after drug treatment, melanocytes were treated with UV. Cell lysates were prepared 24 hours after UV treatment and subjected to immunoblotting. In order to measure an impact of cyanamide on pigment production in melanocytes, primary melanocytes were incubated in the presence of vehicle, phenyl-thiourea, or increasing concentrations of cyanamide. Cells were incubated for an additional 7 days, with one media change on day 4, prior to collection of absorbance and viability values. For bafilomycin experiments, MNT-1 cells were transfected with 75 nM siRNA in 12 well plates. 80 hours after transfection, 25nM bafilomycin was added. 96 hours after transfection cell lysates were prepared and subjected to immunoblotting.
Immunofluorescence
For immunoflourescence detection of melanosome and autoph-agy markers, cells were fixed in 2% paraformaldehyde for 1 hour. Coverslips were washed in PBS, cells were permeabilized with 0.1% Triton-X-100 (MNT-1 cells) or 0.4% saponin (primary melanocytes), and blocked in 1% BSA with 0.1% Tween 20. Cells were incubated with the following primary antibodies: Pmel17 (HMB50, Lab Vision Corporation, 1:100 dilution), Apg5 (Santa Cruz Biotechnology, sc-33210, 1:50 dilution), and LC3b (Santa Cruz Biotechnology, sc-28266, 1:50 dilution), for 1 hour. The secondary antibodies used in this study were Alexa Fluor 514 and 594 purchased from Invitrogen. Coverslips were incubated in a 1:1000 dilution of the corresponding secondary antibody for 1 hour. Confocal images were acquired using a LSM-510 meta confocal multiphoton microscope.
Mice
Beclin1 haploinsufficient mice were generated as described. [39] All studies involving beclin1+/+and beclin1+/2mice utilized animals that had been backcrossed with C57BL/6J for a minimum of six generations. Representative pictures and figures contained in the manuscript were generated from littermates.
Immunohistochemistry
Mouse skin sections from four wild type and four beclin 1 haploinsufficient mice were fixed in formalin and paraffin embedded. Haematoxylin and eosin staining were performed following standard protocols. Melanin was stained using the Masson-Fontana technique with a neutral red counterstain [41]. S100 staining was performed as described using an eosin counterstain [42].
screen as described in Figure 1. WIPI1, LC3-C, and GPSM1 were genes identified in the original dataset, while BECN1 and MAP1LC3C are known regulators of autophagy not identified in our initial screening approach. Bars represent mean and s.e.m. for n = 3. Associated p-values (student’s t-test) are reported in Table S4. C) Coat color defects in autophagy impaired mice. The coat pigmentation of C57B6 wild type (+/+) (mouse on the right) and heterozygous Beclin 1 mutant littermates (+/2) (mouse on the left) is shown. D) Reduced melanin accumulation in the hair follicles of Beclin1 haploinsufficient mice.. Skin samples from Beclin 1 haploinsufficient mice and wild type littermates were fixed and horizontally sectioned. Upper panels: Fontana-Masson silver staining was used to assess melanin content in the hair follicle (arrow). Detection of staining in wild-type follicles is obscured by accumulation of opaque pigment granules (left panel, and occasional normal follicles in the Beclin+/2background (arrow head)). Sections were counter-stained with aqueous neutral red. Lower panels: the melanoblast marker S100b was used to identify melanocytes in the hair follicle bulb (arrow). Again, staining is obscured in normal follicles due to accumulation of opaque pigment granules. E) MNT-1 cells were fixed and stained with the primary antibodies indicated. Two-photon confocal microscopy was utilized to visualize the colocalization of autophagy and melanosome markers. Representative 0.2mM confocal slices are shown.
Supporting Information
Figure S1 Genome-wide RNAi screening for novel molecular components of melanogenesis. A) A MNT-1 model for loss-of-function detection of pigmentation genes. MNT-1 cells were transfected with siRNAs targeting tyrosinase using a microtiter-plate based high throughput reverse transfection protocol [24] optimized for this cell line. Inhibition of pigmentation and tyrosinase expression relative to control non-targeting siRNAs is shown. B) MNT-1 pigmented melanoma cells were transfected with 84,920 siRNA duplexes targeting 21,230 genes in a one-well, one-gene reverse transfection format as we have previously described [24]. 120 hrs post transfection, Raw A405nmabsorbance values were collected for
each well and normalized to internal reference samples on each plate, followed by normalization to the experimental mean for each well calculated from the full data set to control for variations in pigment due to plate and position effects. Similarly adjusted luminescence values from a multiplexed viability assay (CellTiter-Glo) were used to control for cell number, generating ‘‘normalized absorbance ratios’’ for each well (absorbance/cell number; Table S1). The log2 transformation of the average normalized absorbance ratios among replicates is shown for each gene from lowest (hypopigmentation) to highest (hyperpigmentation). Values below 2 standard deviations from the mean are shown in red.
Found at: doi:10.1371/journal.pgen.1000298.s001 (2.28 MB TIF)
Figure S2 Quantitative RT-PCR was employed to measure the impact of select pooled siRNAs on target mRNA levels. Actin primers were employed to control for mRNA concentrations. Results are representative of three experiments performed in triplicate. A student’s t-test was utilized to validate that siRNAs significantly inhibited the expression of the corresponding gene. All of the siRNAs tested in this analysis significantly inhibited the expression of the corresponding gene (p value,.05).
Found at: doi:10.1371/journal.pgen.1000298.s002 (2.28 MB TIF)
Figure S3 The impact of multiple independent siRNAs, targeting the indicated genes, on tyrosinase protein accumulation was assessed by immunoblot. The impact of a given siRNA on gene expression was quantitated by densitometry (numbers below the corresponding blots). Two or more siRNAs impaired tyrosinase protein expression in all cases examined. Similarly, the impact of multiple independent siRNAs targeting tyrosinase on MITF protein accumulation was assessed by immunoblot. All three siRNAs tested had an impact on MITF expression. Found at: doi:10.1371/journal.pgen.1000298.s003 (2.28 MB TIF)
Figure S4 MNT-1 cells transfected with the indicated siRNAs were immunostained with anti-Pmel antibodies to detect melano-somes 4 days post transfection. Representative micrographs are shown.
Found at: doi:10.1371/journal.pgen.1000298.s004 (2.28 MB TIF)
Figure S5 Identified pigment regulators differentially regulate tyrosinase expression in different genetic backgrounds. A) The indicated siRNAs targeting novel pigmentation genes identified in the MNT-1 screen were tested for consequences on tyrosinase protein accumulation in darkly pigmented primary human melanocyte cultures 6 days post transfection. A non-targeting siRNA was used as a transfection control (Control). ERK1/2 is shown as a loading control. B) The indicated siRNAs, targeting novel pigmentation genes identified in the MNT-1 screen, were tested for consequences on tyrosinase protein accumulation in moderately pigmented primary human melanocyte cultures 6 days post transfection as in (A). A venn diagram in Figure 2 identifies sets of genes that differentially impact tyrosinase accumulation in different genetic backgrounds.
Found at: doi:10.1371/journal.pgen.1000298.s005 (2.28 MB TIF)
Figure S6 Autophagy deficient mice have coat color defects. Photograph depicts the coat color of 4 wild type and 4 beclin 1 haploinsufficient littermates. Note that no pigmentary defects are noted on the nose which argues against defects in melanoblast migration. Mice are of similar size. Additionally, no pigment defects were noted on the belly.
Found at: doi:10.1371/journal.pgen.1000298.s006 (2.28 MB TIF)
Table S1 Genome-wide siRNA dataset. MNT-1 pigmented melanoma cells were transfected with 84,920 siRNA duplexes targeting 21,230 genes in a one-well, one-gene reverse transfection format as we have previously described [24]. 120 hrs post transfection, Raw A405nm absorbance values were collected for
each well and normalized to internal reference samples on each plate, followed by normalization to the experimental mean for each well calculated from the full data set to control for variations in pigment due to plate and position effects. Similarly adjusted luminescence values from a multiplexed viability assay (CellTiter-Glo) were used to control for cell number, generating ‘‘normalized absorbance ratios’’ for each well (absorbance/cell number). Data for each individual absorbance ratio, the mean, and standard deviation is shown for all of the genes examined. Additionally gene ontology information for each gene, accession number, and chromosome position is indicated.
Found at: doi:10.1371/journal.pgen.1000298.s007 (10.32 MB XLS)
Table S2 Genome wide siRNA screen identifies known regulators of melanogenesis. 127 mouse coat color genes have been identified to date and 68 of these genes have human homologues. To validate that our screening approach could identify known regulators of melanogenesis, we identified genes in the coat color database whose corresponding siRNAs significantly inhibited pigment production in our assay. SiRNAs corresponding to 13 of the 68 genes in this database significantly impacted pigment production. Normalized pigment inhibition scores and standard deviations are listed for each of these genes.
Found at: doi:10.1371/journal.pgen.1000298.s008 (0.02 MB XLS)
Table S3 siRNA sequences that significantly inhibited pigment production in our siRNA Screen. The corresponding sequences for each of the four siRNA duplexes that collectively inhibited pigment production in our siRNA library is shown.
Found at: doi:10.1371/journal.pgen.1000298.s009 (0.06 MB XLS)
Table S4 Individual and pooled siRNAs Directed at novel pigment regulators significantly impact pigment production. Individual and pooled siRNAs directed towards 35 of the novel regulators of pigment production identified in our genome wide screen were retested to examine their impact on pigment production (retest data for 32 genes is shown in figure 1, while retest data for 3 remaining genes is shown in Figure 3). A student’s t-test was used to determine if these siRNAs were able to significantly inhibit pigment production when compared to a control siRNA (Ker7). 4 of the siRNA pools retested did not significantly inhibit pigment production. Two of the four oligos retested for all of the other genes examined. Underlined numbers correspond to p-values less than .05, while bold numbers correspond to p-values less than .01. The results are representative of a minimum of three experiments done in triplicate.
Acknowledgments
The authors wish to thank Dr. B. Levine for generously providing Beclin1 mutant mice.
Author Contributions
Conceived and designed the experiments: AKG MAW. Performed the experiments: AKG HH BB SP JA SK ZR LQL. Analyzed the data: AKG TK MAW. Contributed reagents/materials/analysis tools: AKG MGR PF MAW. Wrote the paper: AKG MAW.
References
1. Costin GE, Hearing VJ (2007) Human skin pigmentation: melanocytes modulate skin color in response to stress. Faseb J 21: 976–994.
2. Bennett DC, Lamoreux ML (2003) The color loci of mice–a genetic century. Pigment Cell Res 16: 333–344.
3. Sulem P, Gudbjartsson DF, Stacey SN, Helgason A, Rafnar T, et al. (2007) Genetic determinants of hair, eye and skin pigmentation in Europeans. Nat Genet 39: 1443–1452.
4. Slominski A, Tobin DJ, Shibahara S, Wortsman J (2004) Melanin pigmentation in mammalian skin and its hormonal regulation. Physiol Rev 84: 1155–1228. 5. Levy C, Khaled M, Fisher DE (2006) MITF: master regulator of melanocyte
development and melanoma oncogene. Trends Mol Med 12: 406–414. 6. Ando H, Kondoh H, Ichihashi M, Hearing VJ (2007) Approaches to identify
inhibitors of melanin biosynthesis via the quality control of tyrosinase. J Invest Dermatol 127: 751–761.
7. Dell’Angelica EC (2003) Melanosome biogenesis: shedding light on the origin of an obscure organelle. Trends Cell Biol 13: 503–506.
8. Raposo G, Marks MS (2007) Melanosomes–dark organelles enlighten endosomal membrane transport. Nat Rev Mol Cell Biol 8: 786–797. 9. Barsh GS (2003) What controls variation in human skin color? PLoS Biol 1: E27. 10. Lamason RL, Mohideen MA, Mest JR, Wong AC, Norton HL, et al. (2005) SLC24A5, a putative cation exchanger, affects pigmentation in zebrafish and humans. Science 310: 1782–1786.
11. Fedorow H, Tribl F, Halliday G, Gerlach M, Riederer P, et al. (2005) Neuromelanin in human dopamine neurons: comparison with peripheral melanins and relevance to Parkinson’s disease. Prog Neurobiol 75: 109–124. 12. Tachibana M (1999) Sound needs sound melanocytes to be heard. Pigment Cell
Res 12: 344–354.
13. Sarangarajan R, Apte SP (2005) Melanization and phagocytosis: implications for age related macular degeneration. Mol Vis 11: 482–490.
14. Zecca L, Zucca FA, Albertini A, Rizzio E, Fariello RG (2006) A proposed dual role of neuromelanin in the pathogenesis of Parkinson’s disease. Neurology 67: S8–11.
15. Kim YJ, Uyama H (2005) Tyrosinase inhibitors from natural and synthetic sources: structure, inhibition mechanism and perspective for the future. Cell Mol Life Sci 62: 1707–1723.
16. Levitt J (2007) The safety of hydroquinone: a dermatologist’s response to the 2006 Federal Register. J Am Acad Dermatol 57: 854–872.
17. Smit NP, Kolb RM, Lentjes EG, Noz KC, van der Meulen H, et al. (1998) Variations in melanin formation by cultured melanocytes from different skin types. Arch Dermatol Res 290: 342–349.
18. Smit NP, Van der Meulen H, Koerten HK, Kolb RM, Mommaas AM, et al. (1997) Melanogenesis in cultured melanocytes can be substantially influenced by L-tyrosine and L-cysteine. J Invest Dermatol 109: 796–800.
19. Hoek K, Rimm DL, Williams KR, Zhao H, Ariyan S, et al. (2004) Expression profiling reveals novel pathways in the transformation of melanocytes to melanomas. Cancer Res 64: 5270–5282.
20. Theos AC, Truschel ST, Tenza D, Hurbain I, Harper DC, et al. (2006) A lumenal domain-dependent pathway for sorting to intralumenal vesicles of multivesicular endosomes involved in organelle morphogenesis. Dev Cell 10: 343–354.
21. Theos AC, Tenza D, Martina JA, Hurbain I, Peden AA, et al. (2005) Functions of adaptor protein (AP)-3 and AP-1 in tyrosinase sorting from endosomes to melanosomes. Mol Biol Cell 16: 5356–5372.
22. Di Pietro SM, Falcon-Perez JM, Tenza D, Setty SR, Marks MS, et al. (2006) BLOC-1 interacts with BLOC-2 and the AP-3 complex to facilitate protein trafficking on endosomes. Mol Biol Cell 17: 4027–4038.
23. Kushimoto T, Basrur V, Valencia J, Matsunaga J, Vieira WD, et al. (2001) A model for melanosome biogenesis based on the purification and analysis of early melanosomes. Proc Natl Acad Sci U S A 98: 10698–10703.
24. Whitehurst AW, Bodemann BO, Cardenas J, Ferguson D, Girard L, et al. (2007) Synthetic lethal screen identification of chemosensitizer loci in cancer cells. Nature 446: 815–819.
25. Ozeki H, Ito S, Wakamatsu K, Thody AJ (1996) Spectrophotometric characterization of eumelanin and pheomelanin in hair. Pigment Cell Res 9: 265–270.
26. Malo N, Hanley JA, Cerquozzi S, Pelletier J, Nadon R (2006) Statistical practice in high-throughput screening data analysis. Nat Biotechnol 24: 167–175. 27. Kobayashi T, Urabe K, Orlow SJ, Higashi K, Imokawa G, et al. (1994) The
Pmel 17/silver locus protein. Characterization and investigation of its melanogenic function. J Biol Chem 269: 29198–29205.
28. Edenberg HJ (2007) The genetics of alcohol metabolism: role of alcohol dehydrogenase and aldehyde dehydrogenase variants. Alcohol Res Health 30: 5–13.
29. DeMaster EG, Redfern B, Nagasawa HT (1998) Mechanisms of inhibition of aldehyde dehydrogenase by nitroxyl, the active metabolite of the alcohol deterrent agent cyanamide. Biochem Pharmacol 55: 2007–2015.
30. Cen D, Gonzalez RI, Buckmeier JA, Kahlon RS, Tohidian NB, et al. (2002) Disulfiram induces apoptosis in human melanoma cells: a redox-related process. Mol Cancer Ther 1: 197–204.
31. Raposo G, Marks MS, Cutler DF (2007) Lysosome-related organelles: driving post-Golgi compartments into specialisation. Curr Opin Cell Biol 19: 394–401. 32. Watabe H, Valencia JC, Yasumoto K, Kushimoto T, Ando H, et al. (2004) Regulation of tyrosinase processing and trafficking by organellar pH and by proteasome activity. J Biol Chem 279: 7971–7981.
33. Proikas-Cezanne T, Waddell S, Gaugel A, Frickey T, Lupas A, et al. (2004) WIPI-1alpha (WIPI49), a member of the novel 7-bladed WIPI protein family, is aberrantly expressed in human cancer and is linked to starvation-induced autophagy. Oncogene 23: 9314–9325.
34. Levine B, Kroemer G (2008) Autophagy in the pathogenesis of disease. Cell 132: 27–42.
35. Mizushima N, Levine B, Cuervo AM, Klionsky DJ (2008) Autophagy fights disease through cellular self-digestion. Nature 451: 1069–1075.
36. Huang J, Klionsky DJ (2007) Autophagy and human disease. Cell Cycle 6: 1837–1849.
37. Smith JW, Koshoffer A, Morris RE, Boissy RE (2005) Membranous complexes characteristic of melanocytes derived from patients with Hermansky-Pudlak syndrome type 1 are macroautophagosomal entities of the lysosomal compartment. Pigment Cell Res 18: 417–426.
38. Basrur V, Yang F, Kushimoto T, Higashimoto Y, Yasumoto K, et al. (2003) Proteomic analysis of early melanosomes: identification of novel melanosomal proteins. J Proteome Res 2: 69–79.
39. Qu X, Yu J, Bhagat G, Furuya N, Hibshoosh H, et al. (2003) Promotion of tumorigenesis by heterozygous disruption of the beclin 1 autophagy gene. J Clin Invest 112: 1809–1820.
40. Peters EM, Tobin DJ, Botchkareva N, Maurer M, Paus R (2002) Migration of melanoblasts into the developing murine hair follicle is accompanied by transient c-Kit expression. J Histochem Cytochem 50: 751–766.
41. Stevens A, Chalk BT (1996) Pigments and Minerals. In: Bancroft JD, Stevens A, eds (1996) Theory and Practical Histological Techniques. pp 243–267. 42. Zhu Y, Ghosh P, Charnay P, Burns DK, Parada LF (2002) Neurofibromas in
NF1: Schwann cell origin and role of tumor environment. Science 296: 920–922.