Osteoarthritis Associated Genes by Integrative
Genome-Wide Gene Expression Profiling Analysis
Zhan-Chun Li1, Jie Xiao2, Jin-Liang Peng3, Jian-Wei Chen1, Tao Ma1, Guang-Qi Cheng1, Yu-Qi Dong1, Wei-li Wang1, Zu-De Liu1*
1Department of Orthopaedic Surgery, Ren Ji Hospital, School of Medicine, Shanghai Jiao Tong University, Shanghai, P. R. China,2Department of Anesthesiology, Ren Ji Hospital, School of Medicine, Shanghai Jiao Tong University, Shanghai, P. R. China,3School of Biomedical Engineering/MED-X Research Institute, Shanghai Jiao Tong University, Shanghai, P. R. China
Abstract
Background:Rheumatoid arthritis (RA) and osteoarthritis (OA) are two major types of joint diseases that share multiple common symptoms. However, their pathological mechanism remains largely unknown. The aim of our study is to identify RA and OA related-genes and gain an insight into the underlying genetic basis of these diseases.
Methods:We collected 11 whole genome-wide expression profiling datasets from RA and OA cohorts and performed a meta-analysis to comprehensively investigate their expression signatures. This method can avoid some pitfalls of single dataset analyses.
Results and Conclusion:We found that several biological pathways (i.e.,the immunity, inflammation and apoptosis related pathways) are commonly involved in the development of both RA and OA. Whereas several other pathways (i.e., vasopressin-related pathway, regulation of autophagy, endocytosis, calcium transport and endoplasmic reticulum stress related pathways) present significant difference between RA and OA. This study provides novel insights into the molecular mechanisms underlying this disease, thereby aiding the diagnosis and treatment of the disease.
Citation:Li Z-C, Xiao J, Peng J-L, Chen J-W, Ma T, et al. (2014) Functional Annotation of Rheumatoid Arthritis and Osteoarthritis Associated Genes by Integrative Genome-Wide Gene Expression Profiling Analysis. PLoS ONE 9(2): e85784. doi:10.1371/journal.pone.0085784
Editor:Ted S. Acott, Casey Eye Institute, United States of America
ReceivedAugust 17, 2013;AcceptedDecember 2, 2013;PublishedFebruary 14, 2014
Copyright:ß2014 Li et al. This is an open-access article distributed under the terms of the Creative Commons Attribution License, which permits unrestricted use, distribution, and reproduction in any medium, provided the original author and source are credited.
Funding:This study was supported by Shanghai Natural Science Foundation, China (No. 13ZR1424900) and Medical-Engineering Joint Fund of Shanghai Jiao Tong University (No. YG2011MS41). The funders had no role in study design, data collection and analysis, decision to publish, or preparation of the manuscript.
Competing Interests:The authors have declared that no competing interests exist.
* E-mail: [email protected]
Introduction
Rheumatoid arthritis (RA) is a common chronic systemic autoimmune disease that mainly affects the flexible joints. It is characterized by the inflammation of articular synovial. The lasting recurrent inflammation of synovial can lead to the deformation and destruction of cartilage and bones, which could result in disability of the patients [1,2]. RA mainly occurs in the 30,70 years old people and is more frequent in females than males. More than 1% of the world’s population may be affected by RA [3,4]. This disease brings great physiological and psychological burden to patients. However, the biological causes for RA remain largely unknown. Although infectious agents including viruses, bacteria and fungi have long been suspected, none has been comprehensively proved [5,6]. Previous researches have also investigated the potential associations between RA and environ-mental factors, such as smoking, vitamin D deficiency, etc [7,8]. It is now generally believed that the pathogenesis of RA is closely related to genetic factors. Certain genes such as the human leukocyte antigen (HLA). HLA-DR4 and DW4 antigen, were identified in more than 90% of the patients. These pathological factors are referred to as the RA-shared epitope [3,9].
Osteoarthritis (OA) is another main type of chronic disease that affects the joints. The major pathological feature of OA is the degradation of articular cartilage and subchondral bone, and this may lead to the rigidity deformity and dysfunction of the joints [10]. The incidence of this disease in more than 50 years old people is as high as 80%. Etiological factors of OA include the mechanical injury, overweight, impairment of peripheral nerves, etc [11]. Osteoarthritis is different from rheumatoid arthritis in that there are extra-articular manifestations for rheumatoid arthritis. In addition, these diseases have different pathological manifestations for the synovial. RA is characterized by synovial cell hypertrophy and hyperplasia, infiltration of lymphocytes and inflammatory cells, whereas OA has fewer leukocytic infiltrates [12,13].
from RA and OA. Then we used a meta-analysis method to identify the aberrantly expressed genes. The subsequent functional annotation of these genes was performed based on gene ontology (GO) and Kyoto Encyclopedia of Genes and Genomes (KEGG) analysis [16,17]. We demonstrated that several biological path-ways are highly enriched in both RA and OA associated genes, such as chemokine signaling pathway, regulation of autophagy, focal adhesion, etc. Whereas other pathways, including regulation of autophagy, endocytosis, calcium transport and endoplasmic reticulum stress related pathways, are differentially influenced in the RA and OA respectively. This analysis provides a novel insight into the pathophysiological processes involved in these diseases. In addition, it would help to prioritize putative targets for further experimental studies and develop novel therapeutic strategies in preventing the RA and OA.
Materials and Methods
Sample Collection
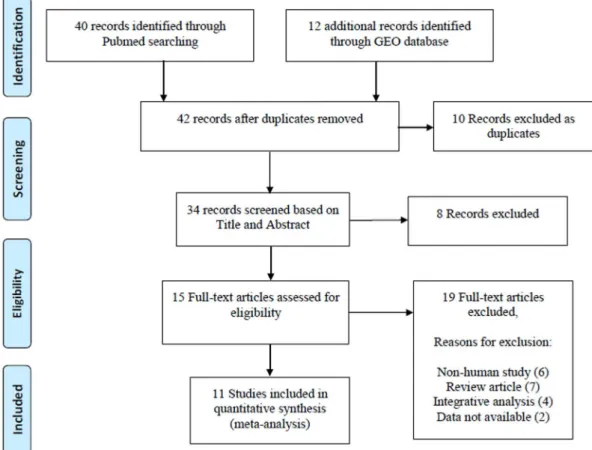
We first queried the PubMed and related literatures to collect the expression profiling datasets from RA, OA and the corresponding normal control (NT) tissues. The following key words and their combinations were used: ‘‘rheumatoid arthritis, osteoarthritis, gene expression, microarray’’. We only retained the original experimental works that analyzed the gene expression profiling between RA, OA and NT samples, respectively. Non-human studies, review articles and integrated analysis of expres-sion profiles were excluded (Figure 1). At last, a total of 15 expression profiling datasets from 11 studies were collected
(Table 1).
Data Preprocessing
In this study, a global normalization method to minimize the data inconsistency and heterogeneity was used. We used theZ-score transformation approach to calculate the expression intensities for each probe of the gene expression profiles [18]. Z-scores were calculated according to the following formula:
Z{score~xi{xx
d :
where xirepresents raw intensity data for each gene;xxrepresents
average gene intensity within a single experiment anddrepresents standard deviation (SD) of all of the measured intensities.
Statistical Analysis
To give an overview of the global shifts of gene expression between pathological and normal tissues, we first calculated the pairwise Euclidean distances for samples from RA, OA and NTs according to the following the formula:
D~
ffiffiffiffiffiffiffiffiffiffiffiffiffiffiffiffiffiffiffiffiffiffiffiffiffiffiffiffi P
n
i~1
xi1{xi2 ð Þ2 s
:
The significance analysis of microarray (SAM) algorithm was then used to identify the differentially expressed genes between pathological and control samples. The SAM procedure first calculate the ‘‘relative difference’’ score for each gene based on a modifiedt-testmethod, then a subsequent permutation analysis was
Figure 1. Flowchart of the selected process of microarray datasets for the meta-analysis.
used to compute false discovery rate (FDR) [19]. To get the best balance between the number of significant calls and the lowest FDR for the dataset tested, we used FDR ,0.05 and |log fold change|.1 as the criteria for significant difference.
Functional Annotation
In order to examine the biological significance of the differentially expressed genes, we performed GO and KEGG enrichment analysis to investigate their functional and pathway implications. The online based software GeneCoDis3 was used to perform this analysis [20]. The differentially expressed genes and all the expressed genes were submitted as the gene list and background list, respectively. The 5% cut-off of the FDR was used.
Results
Short Overview of the Studies Included
In recent years, many studies have used microarray technology to analyzed the whole genome expression proofing in samples of RA and OA. In this study, a total of 11 expression profiling datasets were collected, which include 383 samples. The charac-teristics of all these datasets included in this analysis were listed as
Table 1. Among the 11 datasets, nine studies focused on synovial
tissues and two studies focused on peripheral blood and bone
marrow-derived mononuclear cells, respectively. More than half (six) of these studies focused on the differentially expressed genes between RA and OA samples, whereas four studies focused on the expression profiling of RA or OA and the corresponding NT samples, and one study only provided the expression profiling from RA samples.
Global Changes in Gene Expression in RA and OA Samples
Normalization is an important issue for comparison of microarray datasets. The heterogeneity of different datasets may lead to difficulties for comparing the results directly. The improperly normalized data used in microarray comparisons may run a high risk of skewing comparison results and reduces the credibility of individual gene change measurements. Towards this end, a global transformation ofz-scorewas used to normalize all the expression profiling data retrieved for RA and OA. After filtering the normalized data, a total of 14,047 genes were detected in more than 60% of the samples. By using the assembled expression compendium, we investigated the global shifts of gene expression between RA, OA and NTs samples respectively. The average Euclidean distance was calculated to measure expression diver-gence between individual samples. As indicated inFigure 2, the expression divergence between OA and corresponding NT Table 1.Characteristics of analyzed datasets.
GEO Acc PMID Publish date tissue type Platforms Number of samples
GSE1919 20858714 4-Nov-04 synovial Affymetrix HGU95A 5 OA
5 NC
5 RA
GSE2053 20858714 10-Dec-04 synovial HUMAN UNIGENE SetI Part 1 4 NC
4 RA
GSE3698 16508983 6-Jun-06 synovial Human Unigene3.1 cDNA Array 37.5K v1.0 18 RA
19 OA
GSE7669 21474483 30-Aug-07 synovial Affymetrix HGU95 2.0 6 RA
6 OA
GSE9027 17665400 13-Sep-07 synovial 28 RA
GSE12021 18721452 2-Sep-08 synovial Affymetrix HGU133A HGU133B Array 20 OA
22 RA
13 NC
GSE17755 21496236 21-Aug-10 peripheral blood
Hitachisoft AceGene Human Oligo Chip 30K 1 Chip Version
112 RA
8 NC
45 NC
GSE27390 21679443 31-May-11 bone marrow Affymetrix HGU133 Plus 2.0 9 RA
11 OA
GSE29746 22021863 25-Oct-11 synovial Whole Human Genome Microarray 4x44K G4112F
9 RA
11 OA
GSE36700 17469140 27-Mar-12 synovial Affymetrix HGU133 Plus 2.0 6 OA
7 RA
GSE39340 22-Oct-12 synovial Illumina HumanHT-12 V4.0 expression beadchip
10 RA
7 OA
A total of 11 expression profiles comparing RA, OA and NTs samples were collected in this study. Their GEO accession number, PubMed ID, publish date, tissue type, expression platform and number of samples were listed.
samples is significantly larger than that between RA and NT samples (Mann-Whitney U test, P-value ,1e-6). We found that expression divergence between pathological samples and NTs is significantly larger than the distance between pathological samples of RA and OA samples (Mann-Whitney U test,P-value: 2.37e-57 and 1.12e-83 respectively,). This indicates that the similarities of expression signatures between RA and OA and several pathogen-esis in common may contribute to the development of these diseases.
Identification of Differentially Expressed Genes from RA vs.NT Samples
To obtain the genetic markers involved in the development and progression of RA and OA, the SAM method was used to identify the differentially expressed genes between pathological and control samples. At last, a total of 201 genes were found to be differentially expressed between RA and NT samples with the threshold ofFDR ,0.05 and minimal two-fold changes of expression. Among those differentially expressed genes, 35 genes were up-regulated and 166 genes were down-regulated in RA samples compared with the NT samples, respectively. The full list of these genes was provided in
Table S1. The top 10 up-regulated and down-regulated genes for
RA vs. NT were listed inTable 2, which include the DCTN1, GABRR3, SOX18, ALPK2, UCP2, GGTL3, GNGT2, ABHD11, ETV3, NPCDR1, etc. The gene with the most significant expression difference between RA and OA is Dynactin subunit 1 (DCTN1), which presents a,1437.67 fold higher expression in RA samples. DCTN1, encoding the largest subunit of dynactin, is involved in a diverse array of cellular functions, including the centripetal movement of lysosomes and endosomes, spindle formation, chromosome movement, nuclear positioning, and axonogenesis. Conversely, the gene with the most significant expression divergence and higher expression in RA samples (151.59 fold) isNPCDR1.Some of the deregulated genes have been previously reported to be closely related to the development of RA.
For example, the single nucleotide polymorphism within theUCP2 gene was identified to associate with many chronic inflammatory diseases including RA and systemic lupus erythematosus (SLE) [21]. Activated PIAS1 gene was identified to repress the transcription of inflammatory genes [22], repression of PIAS1 related pathways have some effects for the treatment of inflammatory disorders such as RA and atherosclerosis [23].
Identification of Differentially Expressed Genes from OA vs.NT Samples
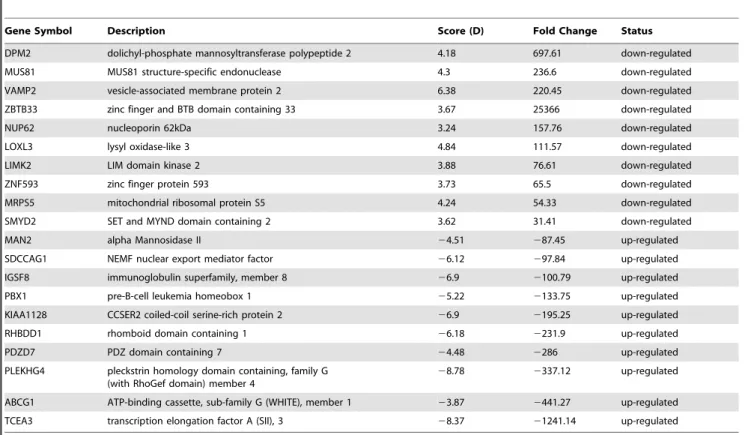
With the same analytic procedure described above, we identified 244 genes to be differentially expressed in OA samples comparing with NT samples, which include 45 up-regulated and 199 down-regulated genes. The full gene list and the top de-regulated gene list for OAvs.NT samples were listed inTable S2
andTable 3, respectively. Specifically, the top deregulated genes
for OA vs. NT samples include the DPM2, MUS81, VAMP2, ZBTB33, NUP62, RHBDD1, PDZD7, PLEKHG4, ABCG1, TCEA3, etc. Several of these genes have been identified to be involved in the development RA or OA samples, includingCOL2[24],Gal-9 [25,26],MUS81[27] andABCG1[28].
Functional Annotation of Differentially Expressed Genes
To gain insights into the biological roles of these differentially expressed genes from RA and OAvs.NT samples, we performed a GO categories enrichment analysis. GO category provides a descriptive framework of functional annotation and classification for gene sets analysis. GO categories are organized into three groups: biological process, molecular function and cellular component. In our work, only biological process and molecular function categories were considered. The functional enrichment work was performed by a web-based software, GeneCoDis3. With the FDR ,0.05, we found GO terms for molecular functions significantly enriched in protein binding (GO:0005515), metal ion binding and DNA binding (GO:0003677), while for biological processes, the enriched GO terms were regulation of transcription (GO:0006355), embryonic limb morphogenesis (GO:0030326) and otic vesicle development (GO:0071599) (Figure 3).
To further evaluate the biological significance for the differen-tially expressed genes, we also performed the KEGG pathway enrichment analysis. The top enriched biological pathways associated with RA and OA include chemokine signaling pathway, glycosaminoglycan biosynthesis-chondroitin sulfate, SNARE in-teractions in vesicular transport, endocytosis, autophagy, etc.
(Table 4). The chemokine pathway, for example, has long been
suspected to involve in the development of RA. The chemokines are a family of small cytokines or signaling proteins secreted by cells, which function is to control cells of the immune system during processes of immune surveillance. Many chemokines could participates in the inflammatory response and attracts immune cells to the site of inflammation [29]. The genes involved in chemokines signaling pathway was identified to be altered in both RAvs.NT and OAvs.NT. TheCXCL2, for example, also known asGRO2, is implicated in the recruitment of neutrophils from the circulation system to the sites of inflammation [30], it is constitutively expressed in resting OA cells, which supports the idea that some circumstances OA can be considered inflammatory disease [31].
As for apoptosis, genes involved in the regulation of cell survival and anti-apoptosis and autophagy related pathways are signifi-cantly affected, such as the mitogen-activated protein kinases (MAPK) pathways. MAPK comprises a family of serine/threonine protein kinases that implicated in the regulation of key cellular processes including cell survival, proliferation, differentiation and
Figure 2. Average expression distances between RA, OA and NT samples. The average distances and the standard errors were labeled in the figure. The distance between pathological samples (RA or OA) and NTs is significantly larger than the distance between RA and OA samples.
Table 2.Summary of differentially expressed genes between RAvs.NT samples.
Gene Symbol Description Score (D) Fold Change Status
DCTN1 dynactin 1 3.46 1437.67 down-regulated
GABRR3 gamma-aminobutyric acid (GABA) A receptor, rho 3 3.23 130.1 down-regulated
SOX18 SRY (sex determining region Y)-box 18 4.32 70.33 down-regulated
ALPK2 alpha-kinase 2 3.96 64.95 down-regulated
UCP2 uncoupling protein 2 3.85 52.75 down-regulated
MITD1 microtubule interacting and transport, domain containing 1 3.15 46.12 down-regulated
SMEK1 SMEK homolog 1, suppressor of mek1 3.64 35.59 down-regulated
BANF1 barrier to autointegration factor 1 3.46 33.62 down-regulated
PIAS1 protein inhibitor of activated STAT, 1 3.25 33.18 down-regulated
GFOD2 glucose-fructose oxidoreductase domain containing 2 3.38 30.77 down-regulated
TSPAN1 tetraspanin 1 23.13 248.9 up-regulated
HSPB2 heat shock 27kDa protein 2 24.52 250.67 up-regulated
NEK6 NIMA-related kinase 6 210.5 256.03 up-regulated
COL2 collagen, type II, alpha 1 23.62 262.02 up-regulated
LGALS9 lectin, galactoside-binding, soluble, 9 24.85 264.47 up-regulated
GGTL3 gamma-glutamyltransferase 7 23.23 279.05 up-regulated
GNGT2 guanine nucleotide binding protein (G protein), gamma transducing activity polypeptide 2
29.81 289.35 up-regulated
ABHD11 abhydrolase domain containing 11 24.03 295.86 up-regulated
ETV3 ets variant 3 23.66 2106.96 up-regulated
NPCDR1 nasopharyngeal carcinoma, down-regulated 1 24.79 2151.59 up-regulated
The symbol name, description, D score and the expression fold change were provided. doi:10.1371/journal.pone.0085784.t002
Table 3.Summary of differentially expressed genes between OAvs.NT samples.
Gene Symbol Description Score (D) Fold Change Status
DPM2 dolichyl-phosphate mannosyltransferase polypeptide 2 4.18 697.61 down-regulated
MUS81 MUS81 structure-specific endonuclease 4.3 236.6 down-regulated
VAMP2 vesicle-associated membrane protein 2 6.38 220.45 down-regulated
ZBTB33 zinc finger and BTB domain containing 33 3.67 25366 down-regulated
NUP62 nucleoporin 62kDa 3.24 157.76 down-regulated
LOXL3 lysyl oxidase-like 3 4.84 111.57 down-regulated
LIMK2 LIM domain kinase 2 3.88 76.61 down-regulated
ZNF593 zinc finger protein 593 3.73 65.5 down-regulated
MRPS5 mitochondrial ribosomal protein S5 4.24 54.33 down-regulated
SMYD2 SET and MYND domain containing 2 3.62 31.41 down-regulated
MAN2 alpha Mannosidase II 24.51 287.45 up-regulated
SDCCAG1 NEMF nuclear export mediator factor 26.12 297.84 up-regulated
IGSF8 immunoglobulin superfamily, member 8 26.9 2100.79 up-regulated
PBX1 pre-B-cell leukemia homeobox 1 25.22 2133.75 up-regulated
KIAA1128 CCSER2 coiled-coil serine-rich protein 2 26.9 2195.25 up-regulated
RHBDD1 rhomboid domain containing 1 26.18 2231.9 up-regulated
PDZD7 PDZ domain containing 7 24.48 2286 up-regulated
PLEKHG4 pleckstrin homology domain containing, family G (with RhoGef domain) member 4
28.78 2337.12 up-regulated
ABCG1 ATP-binding cassette, sub-family G (WHITE), member 1 23.87 2441.27 up-regulated
TCEA3 transcription elongation factor A (SII), 3 28.37 21241.14 up-regulated
apoptosis as well as cellular stress and inflammatory responses. The respective genes in MAPK pathway showed altered expression levels in RA and OA patients of this study. Involvement of MAPK in the regulation of the synthesis of inflammation mediators and the development of RA have been widely identified [32]. Inhibitors targeting MAPK related pathways have been developed and the preclinical data indicated that they exhibit anti-inflammatory activities. This makes them the potential targets of anti-inflammatory therapy for these diseases [33].
Focal adhesion kinase (FAK) is another pathway that known to play a key role in cell proliferation and migration. Members of this family, which include FAK and PYK2 and their associated signaling intermediates, have been implicated in cell adhesion, migration and osteoclast differentiation [34]. GRB2 is one of the interaction factors of FAK that facilitate intracellular signaling [35]. This gene was found to be up-regulated in both of the diseases, and this may be responsible for the activation of the FAK family signaling and results in the adhesion and migration of the pathological cells.
Discussion
Rheumatoid arthritis and osteoarthritis are the most commonly observed types of arthritis. However, the underlying causes of RA and OA remain largely unknown. Understanding the pathogenesis could have important implications for drug development and treatment for these diseases. Genetic researches on RA and OA have pursued throughout the last years. For example, the whole genome expression profiling studies by using microarrays. Gene expression profiling studies are capable of identifying differences in transcription of thousands of genes on a genome-wide scale. This technique may investigate the pathophysiology of complex genetic
tracts and the altered molecular pathways. The first genome wide comparisons of gene expression of RA and OA was performed by Ungethuem et al. in 2006. To date, a total of 11 microarray mRNA profiling studies comparing RA and OA with control tissue have been published. Combination and comparison of these studies may have the potential to substantiate and filter the results of each single study and may provide further insights into the pathogenesis of these diseases. However, the heterogeneity of the datasets may run a risk of skewing comparison results and reduces the credibility of gene expression change measurements. To this end, we collected those published expression profiling datasets and used a global normalization method to calculate the expression level for each gene. This algorithm used in this study could reduce heterogeneity of different datasets and make them comparable. Then we performed a systemic meta-analysis based on re-analysis of primary data sets to retrieve RA and OA associated genes. Followed functional implication analysis was performed to investigate their physiological impact in development of these diseases. To our knowledge, no other systematic meta-analysis of gene profiling has been performed to investigate the differences and similarities between RA and OA. The present study suggests several promising genes and may provide a clue to the role of these genes played in the development of these diseases.
Based on our results, it is evident that inflammation as well as apoptotic processes are key elements in the development and progression of RA since several inflammation- and apoptosis-associated genes were identified. For example, theGal-9.Gal-9is a kind of immunity associated gene that plays a role in inflammatory responses. This gene has previously been proved to be a ligand of T cell Ig and mucin domain (Tim-3). It was reported thatTim-3 expression is higher in patients with inflammatory disorders such as RA compared to controls [36]. In this case, up-regulation of
Gal-9may enhance theTim-3-Tim-3Linteractions in synovial and improve the symptoms of inflammation.
In addition, we found that the NF-kB signaling pathway may play significant role in these diseases. NF-kB is a key transcription factor that regulates a variety of genes involved in immune response, cell differentiation and proliferation. Incorrect activation of NF-kB was suggested to associate with cancer, inflammatory and autoimmune diseases, septic shock and viral infection [37]. It has previously indicated that Interleukin-1 beta (IL-1b) gene was induced in the RA patient-derived synovial fibroblast cell line MH7A by cigarette smoke condensate [38]. NF-kB binding sites were found in the promoter region ofIL-1bgene. Therefore, this indicated that aberrant expression of the genes relevant of NF-kB signaling pathway may play a pathological role in the development of RA and OA.
Abnormalities in the mitochondria have been a topic of interests into the study of arthritis. It has been reported that mutation frequency of mtDNA is significantly higher in the inflamed synovial compared with normal synovial. This high mutation frequency is caused by the inflammatory mediators of TNFaand interferon c (IFNc) and eventually results in the changes of microenvironment and function of mitochondria [39]. Here, we
reported that expressions of certain genes related to the function of mitochondria were altered in RA patients. Notably, the relevant genes, which include theATP6, SCO2,CYTB, DN1, COX1, ANT1, are mainly function in oxidative phosphorylation, whereas dysfunction in oxidative phosphorylation related genes is closely related to the systemic juvenile idiopathic arthritis and endemic osteoarthritis [40,41]. This largely indicates that both RA and OA can be classified as mitochondrial disorder.
Although RA and OA samples share many similarities of their respective gene expression profiles and a number of pathways show comparable variance in both of these diseases, thus reflecting basic common pathomechanism of these joint diseases. However, RA and OA samples can be clearly differentiated regarding gene expression variances in other pathways. In OA, the pathways affected by expression variances include calcium ion transport, PPAR signaling pathway, protein processing in endoplasmic reticulum (ER), phagosome and endocytosis related pathways, etc. Calcium is the essential structural component of the skeletal system. Adequate calcium intake is the basis of osteoblast growth. Observation of the dysregulated expression of calcium related gene may partially explain why calcium pyrophosphate dihydrates accumulate in synovial of OA patients [42,43]. Endocytosis and Table 4.KEGG pathway enrichment of genes differentially expressed RA and OAvs.NT samples.
Sample type KEGG pathway Number of genes Entrez gene ID P-value
OA vs. NT Chemokine signaling pathway 5 2920 2869 409 9844 2309 0.0168
OA vs. NT Endocrine and other factor-regulated calcium reabsorption
5 56302 6546 490 793 8766 0.0179
OA vs. NT Glycosaminoglycan biosynthesis - chondroitin sulfate 3 55501 64132 10090 0.0286
OA vs. NT SNARE interactions in vesicular transport 3 6844 53407 113189 0.0462
OA vs. NT NF-KAPPA B signaling 5 27040 29760 8915 10015 2637 0.0439
OA vs. NT PPAR signaling pathway 3 1376 364 10999 0.0726
OA vs. NT Protein processing in endoplasmic reticulum 4 50613 9695 3300 4217 0.0726
OA vs. NT Phagosome 3 53407 23673 30835 0.0726
OA vs. NT Pathogenic Escherichia coli infection 3 9181 999 10092 0.0726
OA vs. NT MAPK signaling pathway 3 999 9844 6197 0.0726
OA vs. NT Focal adhesion 3 6844 3783 3912 0.0974
OA vs. NT Oxidative phosphorylation 4 9997 4519 28487 4512 0.0981
OA vs. NT Endocytosis 3 2869 23096 409 0.0996
RA vs. NT Vasopressin-regulated water reabsorption 3 6844 51164 1639 0.0175
RA vs. NT Glyoxylate and dicarboxylate metabolism 3 4190 48 847 0.0275
RA vs. NT Chemokine signaling pathway 3 2885 2793 2829 0.0493
RA vs. NT Regulation of autophagy 3 25989 5562 9474 0.0339
RA vs. NT NF-KAPPA B signaling 4 29760 8915 8091 9020 0.0339
RA vs. NT SNARE interactions in vesicular transport 3 6844 9527 9482 0.0339
RA vs. NT Oxidative phosphorylation 5 4508 9997 4519 28487 4512 0.0421
RA vs. NT Citrate cycle (TCA cycle) 3 4190 48 945406 0.0421
RA vs. NT mTOR signaling pathway 3 25989 5562 1978 0.0421
RA vs. NT Adherens junction 3 81 6615 7414 0.0781
RA vs. NT Wnt signaling pathway 4 56998 6093 9475 51176 0.0781
RA vs. NT MAPK signaling pathway 4 9448 4773 7151 4217 0.0793
RA vs. NT Pathogenic Escherichia coli infection 3 9181 999 4690 0.0793
RA vs. NT Focal adhesion 3 81 2885 3912 0.0841
RA vs. NT Bacterial invasion of epithelial cells 3 10163 999 9844 0.0841
autophagy are the major pathways for materials to be transported into the lysosomes in cells. The former is responsible for uptake of extracellular constituents and the latter for degradation of cytoplasmic constituents. Several common factors and pathways that regulate the endocytosis and autophagy has been identified [44]. Since there is a high correlation between autophagy activation and the severity of experimental osteoarthritis [45], we may speculate the causal relationship between the deregulation of endocytosis related genes and the development of OA.
ER stress refers to as the enhanced expression of normal or folding-defective proteins and the accumulation of unfolded protein in ER by stimuli. This process has been shown to participate in many disease, including diabetes, inflammation, and neurodegenerative disorders [46]. It was also indicated that ER stress may contribute to chondrocyte apoptosis along with OA progression, which was closely associated with an enhanced apoptotic response and a reduced protective response by cells [47]. Therefore, molecules that regulate the ER stress response would be candidate targets for treatment of this disease.
In contrast to OA, RA-specific pathways are involved in vasopressin-regulated water reabsorption, adherens junction, etc. As a proinflammatory hormone, vasopressin can stimulate the cell proliferation in chondrocytes that derived from patients with RA [48]. Adherens junctions are protein complexes that occur at cell-cell junctions in epithelial tissues to create ephemeral connections with counterparts from adjacent cells. The inflamed synovial tissue undergoes remodeling during the course of RA, the synovial lining becomes hyperplastic and forms a condensed tissue [49]. Genes related to the adherens junctions pathway is speculated to involve in this process and their abnormal expression may enhance the development of RA. Identification of interferon signaling and bacterial invasion related pathways suggests that some of the cases are indeed caused by microbial infection. In addition, other canonical pathways that involved in the RA development, such as
the Wnt signaling and mTOR signaling pathways, were also identified in this analysis [50,51]. These affected pathways and the respective genes reported here may provide the basis for further analyses of the pathogenesis and the differences between RA and OA on a cellular and molecular level.
In conclusion, by collecting the whole genome expression data sets from different platforms, multiple biological markers were identified for RA and OA. This work is important to characterize the specific roles of those genes involved in the pathogenesis of RA and OA. Functional analysis of these genes may provide additional insights into the complex process of these diseases. In addition, this analysis may help to improve the diagnosis and treatment of these diseases.
Supporting Information
Table S1 Full lists of the differentially expressed genes
between RAvs.NT samples.The symbol name, D score and
the expression fold change were provided. (XLSX)
Table S2 Full lists of the differentially expressed genes
between OAvs.NT samples.The symbol name, D score and
the expression fold change were provided. (XLSX)
Acknowledgments
We thank the two anonymous reviewers for their valuable suggestions.
Author Contributions
Conceived and designed the experiments: ZCL ZDL. Performed the experiments: ZCL JX JP JC TM GC YD WW. Analyzed the data: ZCL JX. Contributed reagents/materials/analysis tools: JX JP. Wrote the paper: ZDL.
References
1. Huber LC, Distler O, Tarner I, Gay RE, Gay S, et al. (2006) Synovial fibroblasts: key players in rheumatoid arthritis. Rheumatology (Oxford) 45: 669– 675.
2. Bartok B, Firestein GS (2010) Fibroblast-like synoviocytes: key effector cells in rheumatoid arthritis. Immunol Rev 233: 233–255.
3. Scott DL, Wolfe F, Huizinga TW (2010) Rheumatoid arthritis. Lancet 376: 1094–1108.
4. Firestein GS (2003) Evolving concepts of rheumatoid arthritis. Nature 423: 356– 361.
5. Alvarez-Lafuente R, Fernandez-Gutierrez B, de Miguel S, Jover JA, Rollin R, et al. (2005) Potential relationship between herpes viruses and rheumatoid arthritis: analysis with quantitative real time polymerase chain reaction. Ann Rheum Dis 64: 1357–1359.
6. Balandraud N, Roudier J, Roudier C (2004) Epstein-Barr virus and rheumatoid arthritis. Autoimmun Rev 3: 362–367.
7. Albano SA, Santana-Sahagun E, Weisman MH (2001) Cigarette smoking and rheumatoid arthritis. Semin Arthritis Rheum 31: 146–159.
8. Wen H, Baker JF (2011) Vitamin D, immunoregulation, and rheumatoid arthritis. J Clin Rheumatol 17: 102–107.
9. Plenge RM, Seielstad M, Padyukov L, Lee AT, Remmers EF, et al. (2007) TRAF1-C5 as a risk locus for rheumatoid arthritis–a genomewide study. N Engl J Med 357: 1199–1209.
10. Kingsbury SR, Conaghan PG (2012) Current osteoarthritis treatment, prescribing influences and barriers to implementation in primary care. Prim Health Care Res Dev 13: 373–381.
11. Brandt KD, Dieppe P, Radin E (2009) Etiopathogenesis of osteoarthritis. Med Clin North Am 93: 1–24, xv.
12. Baecklund E, Iliadou A, Askling J, Ekbom A, Backlin C, et al. (2006) Association of chronic inflammation, not its treatment, with increased lymphoma risk in rheumatoid arthritis. Arthritis Rheum 54: 692–701.
13. Franklin J, Lunt M, Bunn D, Symmons D, Silman A (2006) Incidence of lymphoma in a large primary care derived cohort of cases of inflammatory polyarthritis. Ann Rheum Dis 65: 617–622.
14. Heruth DP, Gibson M, Grigoryev DN, Zhang LQ, Ye SQ (2012) RNA-seq analysis of synovial fibroblasts brings new insights into rheumatoid arthritis. Cell Biosci 2: 43.
15. Zhang R, Fang H, Chen Y, Shen J, Lu H, et al. (2012) Gene expression analyses of subchondral bone in early experimental osteoarthritis by microarray. PLoS One 7: e32356.
16. Ashburner M, Ball CA, Blake JA, Botstein D, Butler H, et al. (2000) Gene ontology: tool for the unification of biology. The Gene Ontology Consortium. Nature Genetics 25: 25–29.
17. Kanehisa M, Araki M, Goto S, Hattori M, Hirakawa M, et al. (2008) KEGG for linking genomes to life and the environment. Nucleic Acids Res 36: D480–484. 18. Cheadle C, Vawter MP, Freed WJ, Becker KG (2003) Analysis of microarray
data using Z score transformation. J Mol Diagn 5: 73–81.
19. Tusher VG, Tibshirani R, Chu G (2001) Significance analysis of microarrays applied to the ionizing radiation response. Proc Natl Acad Sci U S A 98: 5116– 5121.
20. Tabas-Madrid D, Nogales-Cadenas R, Pascual-Montano A (2012) GeneCodis3: a non-redundant and modular enrichment analysis tool for functional genomics. Nucleic Acids Res 40: W478–483.
21. Yu X, Wieczorek S, Franke A, Yin H, Pierer M, et al. (2009) Association of UCP2–866 G/A polymorphism with chronic inflammatory diseases. Genes Immun 10: 601–605.
22. Liu B, Shuai K (2008) Targeting the PIAS1 SUMO ligase pathway to control inflammation. Trends Pharmacol Sci 29: 505–509.
23. Sikora KA, Fall N, Thornton S, Grom AA (2012) The limited role of interferon-gamma in systemic juvenile idiopathic arthritis cannot be explained by cellular hyporesponsiveness. Arthritis Rheum 64: 3799–3808.
24. Fraser A, Fearon U, Billinghurst RC, Ionescu M, Reece R, et al. (2003) Turnover of type II collagen and aggrecan in cartilage matrix at the onset of inflammatory arthritis in humans: relationship to mediators of systemic and local inflammation. Arthritis Rheum 48: 3085–3095.
25. Seki M, Sakata KM, Oomizu S, Arikawa T, Sakata A, et al. (2007) Beneficial effect of galectin 9 on rheumatoid arthritis by induction of apoptosis of synovial fibroblasts. Arthritis Rheum 56: 3968–3976.
27. Daouti S, Latario B, Nagulapalli S, Buxton F, Uziel-Fusi S, et al. (2005) Development of comprehensive functional genomic screens to identify novel mediators of osteoarthritis. Osteoarthritis Cartilage 13: 508–518.
28. Collins-Racie LA, Yang Z, Arai M, Li N, Majumdar MK, et al. (2009) Global analysis of nuclear receptor expression and dysregulation in human osteoar-thritic articular cartilage: reduced LXR signaling contributes to catabolic metabolism typical of osteoarthritis. Osteoarthritis Cartilage 17: 832–842. 29. Reedquist KA, Tak PP (2012) Signal transduction pathways in chronic
inflammatory autoimmune disease: small GTPases. Open Rheumatol J 6: 259–272.
30. De Filippo K, Dudeck A, Hasenberg M, Nye E, van Rooijen N, et al. (2013) Mast cell and macrophage chemokines CXCL1/CXCL2 control the early stage of neutrophil recruitment during tissue inflammation. Blood.
31. Scaife S, Brown R, Kellie S, Filer A, Martin S, et al. (2004) Detection of differentially expressed genes in synovial fibroblasts by restriction fragment differential display. Rheumatology (Oxford) 43: 1346–1352.
32. Thalhamer T, McGrath MA, Harnett MM (2008) MAPKs and their relevance to arthritis and inflammation. Rheumatology (Oxford) 47: 409–414. 33. Kaminska B (2005) MAPK signalling pathways as molecular targets for
anti-inflammatory therapy–from molecular mechanisms to therapeutic benefits. Biochim Biophys Acta 1754: 253–262.
34. Shahrara S, Castro-Rueda HP, Haines GK, Koch AE (2007) Differential expression of the FAK family kinases in rheumatoid arthritis and osteoarthritis synovial tissues. Arthritis Res Ther 9: R112.
35. Schlaepfer DD, Broome MA, Hunter T (1997) Fibronectin-stimulated signaling from a focal adhesion kinase-c-Src complex: involvement of the Grb2, p130cas, and Nck adaptor proteins. Mol Cell Biol 17: 1702–1713.
36. Lee J, Oh JM, Hwang JW, Ahn JK, Bae EK, et al. (2011) Expression of human TIM-3 and its correlation with disease activity in rheumatoid arthritis. Scand J Rheumatol 40: 334–340.
37. Gilmore TD (1999) The Rel/NF-kappaB signal transduction pathway: introduction. Oncogene 18: 6842–6844.
38. Adachi M, Okamoto S, Chujyo S, Arakawa T, Yokoyama M, et al. (2013) Cigarette Smoke Condensate Extracts Induce IL-1-Beta Production from Rheumatoid Arthritis Patient-Derived Synoviocytes, but Not Osteoarthritis Patient-Derived Synoviocytes, Through Aryl Hydrocarbon Receptor-Depen-dent NF-Kappa-B Activation and Novel NF-Kappa-B Sites. J Interferon Cytokine Res 33: 297–307.
39. Harty LC, Biniecka M, O’Sullivan J, Fox E, Mulhall K, et al. (2012) Mitochondrial mutagenesis correlates with the local inflammatory environment in arthritis. Ann Rheum Dis 71: 582–588.
40. Ishikawa S, Mima T, Aoki C, Yoshio-Hoshino N, Adachi Y, et al. (2009) Abnormal expression of the genes involved in cytokine networks and mitochondrial function in systemic juvenile idiopathic arthritis identified by DNA microarray analysis. Ann Rheum Dis 68: 264–272.
41. Li C, Wang W, Guo X, Zhang F, Ma W, et al. (2012) Pathways related to mitochondrial dysfunction in cartilage of endemic osteoarthritis patients in China. Sci China Life Sci 55: 1057–1063.
42. Kumarasinghe DD, Sullivan T, Kuliwaba JS, Fazzalari NL, Atkins GJ (2012) Evidence for the dysregulated expression of TWIST1, TGFbeta1 and SMAD3 in differentiating osteoblasts from primary hip osteoarthritis patients. Osteoar-thritis Cartilage 20: 1357–1366.
43. Robier C, Neubauer M, Fritz K, Lippitz P, Stettin M, et al. (2013) The detection of calcium pyrophosphate crystals in sequential synovial fluid examinations of patients with osteoarthritis: once positive, always positive. Clin Rheumatol 32: 671–672.
44. Lamb CA, Dooley HC, Tooze SA (2013) Endocytosis and autophagy: Shared machinery for degradation. Bioessays 35: 34–45.
45. Carames B, Hasegawa A, Taniguchi N, Miyaki S, Blanco FJ, et al. (2012) Autophagy activation by rapamycin reduces severity of experimental osteoar-thritis. Ann Rheum Dis 71: 575–581.
46. Yoshida H (2007) ER stress and diseases. FEBS J 274: 630–658.
47. Takada K, Hirose J, Senba K, Yamabe S, Oike Y, et al. (2011) Enhanced apoptotic and reduced protective response in chondrocytes following endoplas-mic reticulum stress in osteoarthritic cartilage. Int J Exp Pathol 92: 232–242. 48. Petersson M, Bucht E, Granberg B, Stark A (2006) Effects of
arginine-vasopressin and parathyroid hormone-related protein (1–34) on cell proliferation and production of YKL-40 in cultured chondrocytes from patients with rheumatoid arthritis and osteoarthritis. Osteoarthritis Cartilage 14: 652–659. 49. Kiener HP, Lee DM, Agarwal SK, Brenner MB (2006) Cadherin-11 induces
rheumatoid arthritis fibroblast-like synoviocytes to form lining layers in vitro. Am J Pathol 168: 1486–1499.
50. Kudryavtseva E, Forde TS, Pucker AD, Adarichev VA (2012) Wnt signaling genes of murine chromosome 15 are involved in sex-affected pathways of inflammatory arthritis. Arthritis Rheum 64: 1057–1068.