ACPD
13, 18581–18620, 2013Surface response to rain events throughout the West
African monsoon
F. Lohou et al.
Title Page
Abstract Introduction
Conclusions References
Tables Figures
◭ ◮
◭ ◮
Back Close
Full Screen / Esc
Printer-friendly Version
Interactive Discussion
Discussion
P
a
per
|
Dis
cussion
P
a
per
|
Discussion
P
a
per
|
Discussio
n
P
a
per
|
Atmos. Chem. Phys. Discuss., 13, 18581–18620, 2013 www.atmos-chem-phys-discuss.net/13/18581/2013/ doi:10.5194/acpd-13-18581-2013
© Author(s) 2013. CC Attribution 3.0 License.
Atmospheric Chemistry and Physics
Open Access
Discussions
Geoscientiic Geoscientiic
Geoscientiic Geoscientiic
This discussion paper is/has been under review for the journal Atmospheric Chemistry and Physics (ACP). Please refer to the corresponding final paper in ACP if available.
Surface response to rain events
throughout the West African monsoon
F. Lohou1, L. Kergoat2, F. Guichard3, A. Boone3, B. Cappelaere4, J.-M. Cohard5, J. Demarty4, S. Galle5, M. Grippa2, C. Peugeot4, D. Ramier6, C. M. Taylor7, and F. Timouk2
1
Laboratoire d’A ´erologie, UMR5560, Universit ´e de Toulouse and CNRS, Toulouse, France 2
GET (CNRS/UPS/IRD), Toulouse, France 3
CNRM-GAME (CNRS and M ´et ´eo-France), Toulouse, France 4
IRD, Hydrosciences, Montpellier, France 5
LTHE (UJF), Grenoble, France 6
CETE Ile de France, Trappes, France 7
CEH, Wallingford, UK
Received: 24 June 2013 – Accepted: 27 June 2013 – Published: 10 July 2013
Correspondence to: F. Lohou ([email protected])
ACPD
13, 18581–18620, 2013Surface response to rain events throughout the West
African monsoon
F. Lohou et al.
Title Page
Abstract Introduction
Conclusions References
Tables Figures
◭ ◮
◭ ◮
Back Close
Full Screen / Esc
Printer-friendly Version
Interactive Discussion
Discussion
P
a
per
|
Dis
cussion
P
a
per
|
Discussion
P
a
per
|
Discussio
n
P
a
per
|
Abstract
This study analyses the response of the continental surface to a rain event, taking ad-vantage of the long-term near-surface measurements over different vegetation covers at different latitudes, acquired during the African Monsoon Multidisciplinary Analysis (AMMA) experiment. The simulated surface response by nine land surface models
in-5
volved in AMMA Land Model Intercomparison Project (ALMIP), is compared to the observations. The surface response, described via the evaporative fraction, evolves in two steps: the immediate surface response and the surface recovery. The immediate surface response corresponds to an increase in the evaporative fraction occurring im-mediately after the rain. For all the experimental sites, the immediate surface response
10
is strongest when the surface is relatively dry. From the simulation point of view, this re-lationship is highly model and latitude dependent. The recovery period, characterized by a decrease of the evaporative fraction during several days after the rain, follows an exponential relationship whose rate is vegetation dependent: from 1 day over bare soil to 70 days over the forest. Land surface models correctly simulate the decrease of EF
15
over vegetation covers whereas a slower and more variable EF decrease is simulated over bare soil.
1 Introduction
The monsoon is the main source of precipitation over West-Africa. It generates long-lived mesoscale systems which provide 80 to 90 % of the annual rainfall in the
Sa-20
hel (D’Amato and Lebel, 1998). Rainfall is characterized by high intermittency and large spatial variability, as well as high temporal variability at the synoptic, intrasea-sonal, interannual and multidecadal timescales (Lebel et al., 2009; Nicholson, 2013). Land-atmosphere exchanges and surface fluxes are impacted by rainfall variability at all scales, either as a direct response to soil water availability or through vegetation
25
West-ACPD
13, 18581–18620, 2013Surface response to rain events throughout the West
African monsoon
F. Lohou et al.
Title Page
Abstract Introduction
Conclusions References
Tables Figures
◭ ◮
◭ ◮
Back Close
Full Screen / Esc
Printer-friendly Version
Interactive Discussion
Discussion
P
a
per
|
Dis
cussion
P
a
per
|
Discussion
P
a
per
|
Discussio
n
P
a
per
|
Africa (Eltahir and Gong, 1996; Zeng et al., 1999; Koster et al., 2004; Taylor et al., 2011b). Recent results demonstrated that convection triggering, which is a critical pro-cess in the tropics, was significantly enhanced by mesoscale heterogeneity of surface soil moisture (Taylor et al., 2011a, 2012). Such heterogeneity controls the spatial struc-ture of surface fluxes, with high latent heat flux and low sensible heat flux over the
5
wetted surface whereas the opposite is true over surroundings areas.
The occurrence of these patterns of surface fluxes is linked to rainfall spatial vari-ability and to the size and lifecycle of MCS and squall lines, but it is also related to the way the surface responds to a rain event, which is the focus of the present study. Lo-cally, immediately after a convective rain event, the partitioning of surface fluxes favours
10
the latent heat flux. During the following days, the sensible heat flux progressively in-creases with the drying of the surface. The surface wetted by a rain event then goes from relatively cold/moist to relatively warm/dry conditions over time, which in turn in-fluences the boundary layer (Schwendike et al., 2010). The temporal dynamics of the latent heat flux after a rain event have been studied in semi-arid regions by Kurc and
15
Small (2004), who highlighted marked differences between grassland and shrubland sites in New Mexico. Focusing on the end-of-season drying for 15 sites worldwide (in-cluding sites in Africa), Teuling et al. (2006) pointed out a large variability of drying dynamics, and suggested a prominent importance of vegetation rooting depth. These authors further proposed a possible link between rooting depth and aridity, leading to
20
the observed slower decrease of LE in drier climates. Such behaviour was not suc-cessfully simulated by the models involved in the Global Soil Wetness Project 2 which gather offline land surface model runs, compare the LSM schemes and conduct sensi-tivity studies. A large variability in the land surface model (LSM) response to rain events was also observed by Lohmann and Wood (2003) during the Red-Arkansas PILPS
in-25
ACPD
13, 18581–18620, 2013Surface response to rain events throughout the West
African monsoon
F. Lohou et al.
Title Page
Abstract Introduction
Conclusions References
Tables Figures
◭ ◮
◭ ◮
Back Close
Full Screen / Esc
Printer-friendly Version
Interactive Discussion
Discussion
P
a
per
|
Dis
cussion
P
a
per
|
Discussion
P
a
per
|
Discussio
n
P
a
per
|
most measurements only focused on the Niamey region, and over a relatively short time period. Altogether, these studies suggest that LSMs might have difficulties in rep-resenting flux dynamics in West-Africa. It is also clear that the different land cover types within a region have to be sampled as much as possible, if a reasonable understanding is expected at the regional scale.
5
The AMMA (African Monsoon Multidisciplinary Analysis) project (Redelsperger et al., 2006) and the AMMA-CATCH observing system (Lebel et al., 2009) were designed to more fully document the multiscale monsoon system over West Africa. Several sites were implemented along a south-north transect providing a rich long-term data set over different vegetation types and climates at different latitudes (Guyot et al., 2009;
10
Ramier et al., 2009; Timouk et al., 2009; Lohou et al., 2010). In parallel, modelling of the land surface during the monsoon was adressed by the AMMA Land Surface Model Intercomparison Project (ALMIP) (Boone et al., 2009). The ALMIP phase 1 scientific objective was to separate the coupling between atmosphere and land surface from the many other couplings (atmospheric, biological) which drive the monsoon system, in
15
order to evaluate LSM sensitivity to atmospheric forcings and intrinsic physics and to develop a climatology of surface diagnostics (Boone et al., 2009). A multimodel offline intercomparison approach used 9 land surface models and their different versions. Even with the same atmospheric forcings, the simulated annual cycle shows a high variability of soil water storage from LSM to LSM (Grippa et al., 2011). This variability
20
partly originates in the accumulation with time of differences occurring during and after each rain event of the monsoon season. Guichard et al. (2010) illustrated the devel-opment of such differences in modelled surface fluxes after the occurrence of a large MCS.
Our objectives here are to characterize the dynamics of the surface after a rain event,
25
ACPD
13, 18581–18620, 2013Surface response to rain events throughout the West
African monsoon
F. Lohou et al.
Title Page
Abstract Introduction
Conclusions References
Tables Figures
◭ ◮
◭ ◮
Back Close
Full Screen / Esc
Printer-friendly Version
Interactive Discussion
Discussion
P
a
per
|
Dis
cussion
P
a
per
|
Discussion
P
a
per
|
Discussio
n
P
a
per
|
The AMMA experimental surface database and the ALMIP land surface model sim-ulations (Sect. 2) are analysed with the same method both for rain event selection and surface response characterisation (Sect. 3). Whereas the previous studies (Hunt et al., 2002; Kurc and Small, 2004; Teuling et al., 2006) focused on the period after the rain, during which the evapotranspiration decreases, this study takes into account the
am-5
plitude of the surface response by comparing the surface fluxes before and after the rain, over the whole year. The decrease of the evaporative fraction with time is mod-eled by exponential relationships with coefficients that are analysed according to the vegetation cover (Sect. 4.1). The same analysis is carried out with the ALMIP models and the simulated surface response is compared to the experimental one (Sect. 4.2).
10
2 Data and simulations
Observations from AMMA (African Monsoon and Multidisciplinary Analysis) provide for the first time a continuous data set over several years which characterizes land-surface exchanges and surface properties over West Africa. Several experimental surface sites were deployed along a meridional transect crossing Benin, Niger and Mali and
char-15
acterising different climatic regimes from humid tropical to sub-saharian regimes. Five of these experimental sites provided throughout several seasonal cycles all the neces-sary data (surface state and land-atmosphere exchange characteristics) for this study (Fig. 1): forest and fallow in Benin, fallow and millet in Niger and grassland in Mali (hereafter BN-forest, BN-fallow, NG-fallow, NG-millet and ML-grassland, respectively).
20
ACPD
13, 18581–18620, 2013Surface response to rain events throughout the West
African monsoon
F. Lohou et al.
Title Page
Abstract Introduction
Conclusions References
Tables Figures
◭ ◮
◭ ◮
Back Close
Full Screen / Esc
Printer-friendly Version
Interactive Discussion
Discussion
P
a
per
|
Dis
cussion
P
a
per
|
Discussion
P
a
per
|
Discussio
n
P
a
per
|
2.1 Flux station sites
The two Benin sites are located in the Donga catchment which is characterized by a typical Sudanian climate. Rainfall is 1200 mm yr−1on average, and potential evapo-transpiration is around 1500 mm yr−1. During the monsoon season, from June to Octo-ber, rainfall events are regular with short dry periods between them (∼3 days). Before
5
and after the core rainy season (July to September), sparse rainfall occurs during the long transition period from March to May and in November. The climate is well-suited for extensive agricultural practice (30 % of the area) but large areas are still covered with shrub savannah (60 %). Only 10 % of the surface is occupied by scattered forest. Down to 0.5 m depth, the soil is composed of sand and loam. Deeper soil contains also
10
clay that holds water for vegetation. The first flux tower is located on a fallow site sur-rounded by various crops (Nalohou: 1.6◦E, 9.7◦N, 449 m). The second is set up over a scattered forest site (Bellefoungou: 1.7◦E, 9.8◦N, 414 m) where trees are 14 m high on average. These two flux stations are representative of the vegetation density range of this area.
15
The two Niger sites are located in the Wankama catchment (2.6◦E, 13.6◦N), typical of the cultivated Sahelian environment of southwest Niger (Cappelaere et al., 2009). The climate is semi-arid tropical with a mean annual rainfall of about 510 mm and a potential evapotranspiration of around 2500 mm yr−1 (Favreau et al., 2009). Ninety percent of the rainfall occurs from June to September, mostly from mesoscale
con-20
vective systems. Soils consist of weakly structured sands and are prone to surface crusting and to erosion. The former natural woody savannah has now been essentially turned into a mosaic of rain-fed millet fields and shrub-covered fallow patches (domi-nated byGuiera senegalensis). The two observation sites sample these two dominant land cover types.
25
ACPD
13, 18581–18620, 2013Surface response to rain events throughout the West
African monsoon
F. Lohou et al.
Title Page
Abstract Introduction
Conclusions References
Tables Figures
◭ ◮
◭ ◮
Back Close
Full Screen / Esc
Printer-friendly Version
Interactive Discussion
Discussion
P
a
per
|
Dis
cussion
P
a
per
|
Discussion
P
a
per
|
Discussio
n
P
a
per
|
between July and mid-September (Frappart et al., 2009). Three main landscape units dominate. The main landscape unit consists of large sandy dunes, with deep soils, covered by annual grasses and scattered trees, which occupy 60 % of the area. Very shallow soils, either rocky outcrops (sandstones, schists) or iron-pans, with very scarce trees, are second in terms of surface, occupying 35 % of the area. Seasonally flooded
5
valleys and ponds, usually densely vegetated, make up the rest of the landscape (5 %). The Agoufou flux tower is set-up on a sandy dune, which is the dominant ecosystem (Timouk et al., 2009).
The surface and atmospheric properties analysed in this study are listed in Ta-ble 1. High-frequency measurements were processed with the EdiRe software (Version
10
1.4.3.1167, R. Clement, University of Edinburgh) on 30 min sample to compute sensi-ble and latent heat flux. CarboEurope recommendations (Mauder and Foken, 2004) were used, including despiking, double rotation, cross-correlation for the derivation of the time lag between the sonic anemometer and the gas analyser, and spectral and Webb corrections. The soil moisture was measured at different depths at each site.
15
It has been vertically integrated over the first meter to ease the comparison between sites and also with the LSMs.
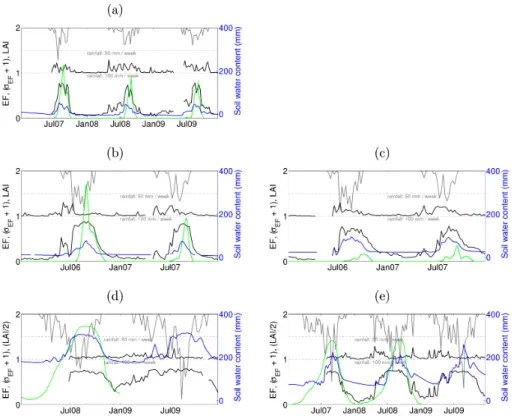
The evolution of the weekly rainfall, and the weekly-averaged leaf area index (LAI), evaporative fraction (EF) and its standard deviation and soil water content at each site are presented in Fig. 2. The evaporative fraction is computed as
20
EF=LE/(LE+H), (1)
where LE andH represent the weekly-averaged latent and sensible heat flux, respec-tively. The measurements were acquired over different periods at each site, between June 2006 and December 2009. One can note the good availability and continuity of the measurements with the exception, in 2009, of the LAI at the Benin sites. These
25
ACPD
13, 18581–18620, 2013Surface response to rain events throughout the West
African monsoon
F. Lohou et al.
Title Page
Abstract Introduction
Conclusions References
Tables Figures
◭ ◮
◭ ◮
Back Close
Full Screen / Esc
Printer-friendly Version
Interactive Discussion
Discussion
P
a
per
|
Dis
cussion
P
a
per
|
Discussion
P
a
per
|
Discussio
n
P
a
per
|
months in Benin (June to September), 3 to 4 months in Niger (July to September) and 2 months in Mali (July and August).
2.2 Land Surface Model Intercomparison Project
The 9 LSMs used in this study and their ALMIP configuration are summarized in Ta-ble 2. In ALMIP phase 1, regional-scale forcing is used. The land surface characteristics
5
for vegetation and soil texture from the ECOCLIMAP database (Masson et al., 2003) were used by all model except HTESSEL and SSiB. The surface meteorology is based on the European Centre for Medium-range Weather Forcast (ECMWF) short-term fore-cast data and consists of 3 hourly temperature, specific humidity, wind component at 10 m, and surface pressure. For the ALMIP experiment 3 used in this study, the
precip-10
itation is from the Tropical Rainfall Measurement Mission (TRMM) precipitation product 3B-42 (Huffman et al., 2007) and the incoming longwave and shortwave fluxes are pro-vided by the LAND-SAF project (Boone et al., 2009). It is important to note that the differences among the simulations shown hereafter can be directly linked to distinct formulations and/or configuration (and surface classification parameters for HTESSEL
15
and SSiB) of the LSMs as they all share the same forcing.
The LSM simulations cover the period 2002 to 2007 with a 0.5◦ spatial resolution and a 3 h time step. ALMIP data have been extracted at three grid points encompasing the experimental sites in Benin, Mali and Niger. Hereafter these three locations are re-ferred as Djougou, Niamey and Hombori, and the corresponding latitude and longitude
20
coordinates are given in Fig. 1.
The simulated sensible and latent heat fluxes are used to compute the evaporative fraction in the same way as done with the experimental data (Eq. 1). The simulated transpiration (TR) allows an estimation of the vegetation activity. A threshold of 0.1 for transpiration to evapotranspiration ratio (TR/ET) will be used to distinguish bare soil
25
ACPD
13, 18581–18620, 2013Surface response to rain events throughout the West
African monsoon
F. Lohou et al.
Title Page
Abstract Introduction
Conclusions References
Tables Figures
◭ ◮
◭ ◮
Back Close
Full Screen / Esc
Printer-friendly Version
Interactive Discussion
Discussion
P
a
per
|
Dis
cussion
P
a
per
|
Discussion
P
a
per
|
Discussio
n
P
a
per
|
the evapotranspiration ET and the total runoffR:
∂S
∂t =P −E−R. (2)
A time integration of∆S, simulated with a 3 h time step, defines what will be called hereafter the soil water content anomaly (SWCA) to the 1st of January 2002. SWCA range of variation can be compared from model to model, and to the range of variation
5
of the measured soil moisture. The evolution of the weekly-averaged SWCA, EF and its standard deviation simulated by the 9 LSMs at the three locations are presented in Fig. 3 over the reduced 2005–2006 period for an improved clarity of the figure.
Broadly speaking, EF seasonal evolutions at the three latitudes are well represented by the LSMs with: the higher the latitude, the shorter the period with high EF (4 months
10
in Djougou, 3 months in Niamey and, 2 months in Hombori). However, weekly-averaged EF discrepancy between the LSMs can reach+60 % during the rainy season, and the surface drying at the end of the rainy season is simulated quite differently by the LSMs. Such a discrepancy is also observed in SWCA, with a relative difference of+100 % or more. It would be tempting to link EF and SWCA variability, but the depth of the
simu-15
lated soil layer varies among LSMs, differences in intercepted water can be important, the water storage in the deep soil is treated differently and runoffvaries among LSMs. Therefore, differences in SWCA do not explain differences in EF in a simple way, as already pointed out by Desborough et al. (1996) who compared 13 LSMs simulation of bare soil evaporation.
20
Although it is not straightforward to compare local measurements to a larger scale simulated pixel, one can remark that ALMIP models simulate a much larger soil water content variation than the observed one. Soil water content at both fallow and BN-forest (Fig. 2) has a 100 mm variation between dry and wet conditions, whereas LSMs give at least a 200 to 300 mm variation (Fig. 3). The same features can be observed at
25
ACPD
13, 18581–18620, 2013Surface response to rain events throughout the West
African monsoon
F. Lohou et al.
Title Page
Abstract Introduction
Conclusions References
Tables Figures
◭ ◮
◭ ◮
Back Close
Full Screen / Esc
Printer-friendly Version
Interactive Discussion
Discussion
P
a
per
|
Dis
cussion
P
a
per
|
Discussion
P
a
per
|
Discussio
n
P
a
per
|
The standard deviation of EF at the weekly time scale (Figs. 2 and 3) gives clues on the effect of the rain events on the land surface: the larger the EF standard deviation, the higher the effect of the rain events. High standard deviations of about 0.4 (50 % of EF value) can be observed at all sites at the beginning of the monsoon. This impact decreases progressively throughout the rainy season in Benin, lasts longer in Niger,
5
and stays high during the whole monsoon in Mali. Analysis is now conducted by looking at the evolution of the surface fluxes for days either side a rain event.
3 Methods
The same method is applied to select the rain events and quantify the associated surface response to both measured and simulated data.
10
3.1 Rain event selection
The criteria defined to detect and select a rain event are:
– the rainfall must be preceded by 24 h without rain, which are used to estimate the initial state of the surface.
– the rainfall must be followed by at least 24 h without rain to analyse the surface
15
response. The longer the period without rain the longer the surface recovers from the rain event.
– Only events with cumulated rainfall above 3 mm are selected.
– When two consecutive rainfall events are separated by less than 3 h, they are considered as the same rain event.
20
ACPD
13, 18581–18620, 2013Surface response to rain events throughout the West
African monsoon
F. Lohou et al.
Title Page
Abstract Introduction
Conclusions References
Tables Figures
◭ ◮
◭ ◮
Back Close
Full Screen / Esc
Printer-friendly Version
Interactive Discussion
Discussion
P
a
per
|
Dis
cussion
P
a
per
|
Discussion
P
a
per
|
Discussio
n
P
a
per
|
LSMs since they are driven by the same atmospheric forcings. In 6 yr, 78, 96 and 88 rain events were selected at Djougou, Niamey and Hombori locations, respectively. The rain events in the simulated and measured datasets might not be the same since TRMM rainfall does not always coincide with local measurements, but the statistical analysis of long-term datasets allows a comparison between observed and simulated
5
mean surface responses.
3.2 Surface response
The surface state is considered from the turbulent flux partitioning point of view, via the evaporative fraction. This limits the impact of temporal variability of net radiation on our calculations. H and LE are averaged to get the mean surface response over
10
a 24 h period of time. Only measurements between 06:00 and 18:00 UTC are used to getH and LE means from which EF is computed.D0 stands for the 24 h preceding the rainfall, andDn (n≥1) stands for the (n−1)×24 ton×24 h following the end of the rainfall. As an example, for a rainfall finishing at 15:00 UTC the 22 July, EF atD1 stands for the mean evaporative fraction on the 22 July between 15:30 and 18:00 UTC and on
15
the 23 July between 06:00 UTC and 15:00 UTC.
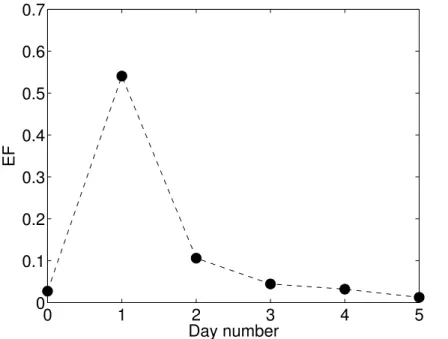
Figure 4 shows an evolution of EF before (D0) and after (D1 to D5) a rain event at NG-fallow. EF atD0 gives the initial surface flux partitioning. The rain leads to an increase of EF at D1. The ratio EF(D1)/EF(D0) depicts the immediate response of the surface. The period followingD1, during which EF generally decreases with time,
20
is the dry spell during which the surface recovers from the rain event.
The immediate response is of great interest in the context of the African monsoon because it varies a lot along the season according to the soil moisture and vegetation state and defines the initial conditions of the recovery period.
In order to model the surface recovery, Wallace and Holwill (1997) applied a
two-25
expo-ACPD
13, 18581–18620, 2013Surface response to rain events throughout the West
African monsoon
F. Lohou et al.
Title Page
Abstract Introduction
Conclusions References
Tables Figures
◭ ◮
◭ ◮
Back Close
Full Screen / Esc
Printer-friendly Version
Interactive Discussion
Discussion
P
a
per
|
Dis
cussion
P
a
per
|
Discussion
P
a
per
|
Discussio
n
P
a
per
|
nential relationship for: (1) EF decrease after the rain over tussok and rye grasslands in New Zealand by Hunt et al. (2002), and (2) LE (and LE normalized by net radiation and global radiation) decrease over various vegetation covers by Teuling et al. (2006). The evaporative fraction expression reads:
EF(D)=EF(D1) exp(−D/τ1), (3)
5
whereD is time in days after the rainfall and τ1 is the best fit exponential constant.
This model describes the EF decrease from the day after the rainfall (EF(D1)) until the zero value of EF. Kurc and Small (2004) used the same method to model soil moisture, evapotranspiration and EF over grass and shrub in central New Mexico, but the exponential constantτ2 is the best fit along a n-day long drydown period which
10
does not necessarily extend to a complete drying of the soil. The evaporative fraction expression is then:
EF(D)=(EF(D1)−EF(Dn)) exp(−D/τ2)+EF(Dn). (4)
The use of both exponential constants appears to be complementary; the former integrates all the time scales of the successive processes involved in the decrease
15
of EF down to zero; the second gives the time scale of the processes which dom-inate in the surface drying during the D1 to Dn period. In this study, τ1 and τ2 are
defined as the inverse of the slope of the linear regression of ln(EF(D)/EF(D1)) and ln((EF(D)−EF(Dn))/(EF(D1)−EF(Dn))) with time, respectively. τ1 and τ2 are
deter-mined for the median surface response computed over the selected rain events whose
20
ACPD
13, 18581–18620, 2013Surface response to rain events throughout the West
African monsoon
F. Lohou et al.
Title Page
Abstract Introduction
Conclusions References
Tables Figures
◭ ◮
◭ ◮
Back Close
Full Screen / Esc
Printer-friendly Version
Interactive Discussion
Discussion
P
a
per
|
Dis
cussion
P
a
per
|
Discussion
P
a
per
|
Discussio
n
P
a
per
|
4 Results
4.1 Observed surface response to a rain event
4.1.1 Immediate surface response
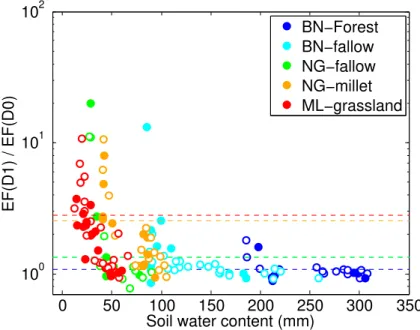
Several surface and atmospheric properties can drive the amplitude of the immedi-ate surface response (EF(D1)/EF(D0)): soil water content, vegetation and its root
5
layer depth, rainfall, potential evapotranspiration. . . Among them, the soil water con-tent, because of its strong seasonal variation, is expected to dominate the evolution of EF(D1)/EF(D0) throughout the monsoon. Actually, before the core of the rainy season, the surface soil water content is close to the wilting point value, so that the first rainfall events change significantly the surface humidity and then lead to a strong increase
10
of the evaporative fraction. In contrast, the evaporative fraction of a soil whose surface water content is already close to its field capacity value should not vary a lot after a rain event. These cases are very frequent in Benin but much less frequent in Mali even at the end of the rainy season as shown by EF standard deviation in Figs. 2 and 3.
The sensitivity of the immediate surface response to soil water content before the rain
15
is shown in Fig. 5. Soil moisture varies among sites according to (1) the latitude, (2) the soil texture and (3) the vegetation type. The extreme values are measured for the BN-forest (200 to 300 mm) and for the ML-grassland (0 to 60 mm). This shift aside, a similar behaviour is found for all the sites: the lower the soil water content, the higher the immediate surface response. These high immediate surface responses mainly occur at
20
the beginning of the monsoon when the LAI is close to zero (not shown) and then when the vegetation activity is still very low (except for BN-forest site where the vegetation is almost evergreen). Consequently these high immediate responses are much more related to soil evaporation than transpiration. A distinction between smaller and larger rainfall than an arbitrary threshold of 8 mm (Fig. 5) shows that the immediate response
25
ACPD
13, 18581–18620, 2013Surface response to rain events throughout the West
African monsoon
F. Lohou et al.
Title Page
Abstract Introduction
Conclusions References
Tables Figures
◭ ◮
◭ ◮
Back Close
Full Screen / Esc
Printer-friendly Version
Interactive Discussion
Discussion
P
a
per
|
Dis
cussion
P
a
per
|
Discussion
P
a
per
|
Discussio
n
P
a
per
|
immediate response, meaning that atmospheric demand is never limiting enough in these regions for these high immediate response events (not shown).
4.1.2 Surface recovery
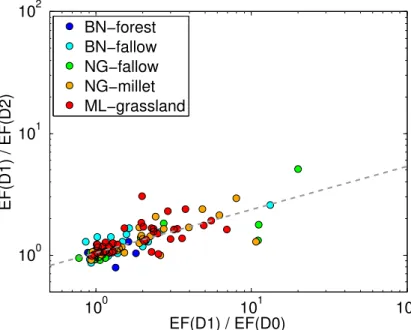
As expected, the seasonal cycle of surface recovery is close to the cycle of the im-mediate response. Figure 6 illustrates the strong link between the imim-mediate surface
5
response (EF(D1)/EF(D0)) and surface recovery amplitude onD2 (EF(D1)/EF(D2)). This power relationship shows a strong coherence between the way the surface reacts just after the rain and the way it recovers on D2, whatever the site. During the early monsoon, the EF increase onD1 is mainly due to bare soil and interception evapora-tion which weakens onD2, implying a decrease of EF. Later in the season, both surface
10
response and surface recovery amplitudes tend toward one when soil moisture is not highly affected by the rain and/or transpiration takes over evaporation.
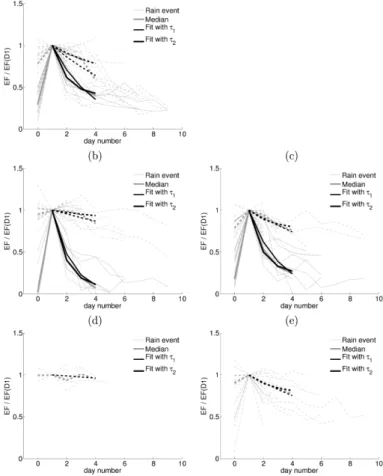
Figure 7 gathers EF evolution with time for all the rainfall events selected at each site. EF is normalised by EF(D1) for more clarity. The rain events are further sorted in two categories according to the LAI. LAI above 0.01 corresponds to a vegetation
15
coverage, whereas LAI below 0.01 represents a bare soil. All of the sites (but those in Benin) provide both bare soil (at the beginning of the monsoon) and vegetated surface (during the monsoon) recovery.
EF median evolution with time is computed up toD5 for the vegetation and bare soil cases, using only rain events whose following dry period lasts at least 5 days. Values
20
ofτ1andτ2and their uncertainties are presented in Table 3.
For bare soil, bothτ1andτ2have low values:τ1∼1.3–2.9 days andτ2∼1 day. For
vegetation covers, τ1 and τ2 are larger than for bare soil because the transpiration
process is added to the evaporation and slows the decrease of EF. Without quantifying it, Dugas et al. (1996) already observed such a difference over arid surfaces of the
25
south-western United States.τ2ranges from 1.7 to 5.5 days and is to be compared to
2 days found by Kurc and Small (2004).τ1 for vegetation covers is above 6 days, as
ACPD
13, 18581–18620, 2013Surface response to rain events throughout the West
African monsoon
F. Lohou et al.
Title Page
Abstract Introduction
Conclusions References
Tables Figures
◭ ◮
◭ ◮
Back Close
Full Screen / Esc
Printer-friendly Version
Interactive Discussion
Discussion
P
a
per
|
Dis
cussion
P
a
per
|
Discussion
P
a
per
|
Discussio
n
P
a
per
|
depth. The deeper the roots, the longerτ1, with 7 to 10 days for annual vegetation as
grass and millet, 10 to 21 days for fallow with shrubs and 74 days for the forest. As mentioned by Teuling et al. (2006),τseems to have a stronger relation with vegetation type than with soil type.
Uncertainties are generally lower than 10 %, except for NG-fallow where it is about
5
20 %, and for BN-forest where it reaches about 75 %. The latter can be explained by the use of only two rain events with a 5 day long recovery period but also because the recovery period is two short for this type of vegetation covers. However,τ1of 74 days
is coherent with values found by Teuling et al. (2006) for forest sites.
4.2 Simulated surface response to a rain event
10
The two stages of EF evolution, immediate response and surface recovery, are anal-ysed with the same method used for the experiment. However, one must keep in mind the difference of horizontal resolution (less than 1 km footprint for the experiment, and 0.5◦square for the ALMIP models) and also the larger statistical sample for the models (2 to 3 yr for the experiment and 6 yr for the ALMIP models).
15
4.2.1 Immediate surface response
The immediate surface response as a function of soil moisture is illustrated for 3 of the 9 LSMs in Fig. 8 for Djougou, Niamey and Hombori locations. The three simulations have been chosen to represent the diversity of the simulated surface response.
Whilst the relationship between immediate response and soil water content is similar
20
from site to site in the experiment (Fig. 5), it can be very different between the LSMs at a given location, and also, between locations for a given LSM. For Djougou, the LSMs are quite in agreement since the surface and vegetation respond in any case very little to rain events, the soil being sufficiently moist or the roots deep enough. The differences increase for drier soils at higher latitudes where the evaporative fraction
25
ACPD
13, 18581–18620, 2013Surface response to rain events throughout the West
African monsoon
F. Lohou et al.
Title Page
Abstract Introduction
Conclusions References
Tables Figures
◭ ◮
◭ ◮
Back Close
Full Screen / Esc
Printer-friendly Version
Interactive Discussion
Discussion
P
a
per
|
Dis
cussion
P
a
per
|
Discussion
P
a
per
|
Discussio
n
P
a
per
|
et al. (2008) already pointed out the various sensitivities of simulated surface fluxes to soil moisture comparing HTESSEL and NOAH. At Niamey, the relationship between the surface response and SWCA continously varies from an almost linear relationship, as in Fig. 8d and f, to a binary relationship for which the surface does not respond unless SWCA is zero, like in Fig. 8e (the intermediate relationships are not shown). At
5
the drier location of Hombori, most of the LSMs tend to loose the relationship between immediate reponse and SWCA.
In addition, the simulated immediate response is slightly overestimated (0 to 3 times) most of the time at Djougou and Niamey, and it is highly overestimated (3 to 10 times) at Hombori, compared to the experiment (Fig. 8).
10
4.2.2 Surface recovery
The relationship between the immediate surface response and the amplitude of EF recovery are quite differently simulated by the LSMs. Whereas the relationship in Fig. 9a is similar to the exprimental one, the LSM in Fig. 9b tends to simulate a high evaporative fraction onD2 with many cases where EF(D2)≈EF(D1). This means that
15
a strong increase of EF on D1 is not followed by a drecrease of EF on D2 as it has been generally observed (Fig. 6). On the contrary, the LSM in Fig. 9c tends to simulate a large decrease of EF on D2 compared to the increase on D1. The model whose results are close to the observed empirical relationship (Fig. 9a) is also the one whose simulated immediate response is clearly linked to SWCA (Fig. 8a, d, g).
20
The median of the simulated EF/EF(D1) evolution after the rain events selected dur-ing 6 monsoon seasons, are estimated considerdur-ing vegetation covers (TR/ET≥0.1) and bare soil (TR/ET<0.1) (Fig. 10 left and middle panels). Some LSMs (CLSM, HT-ESSEL) have no rain events over bare soil at Djougou, and in contrast, some LSMs (SSiB, SWAP) have no rain events over vegetation cover at Hombori. As already
ob-25
ACPD
13, 18581–18620, 2013Surface response to rain events throughout the West
African monsoon
F. Lohou et al.
Title Page
Abstract Introduction
Conclusions References
Tables Figures
◭ ◮
◭ ◮
Back Close
Full Screen / Esc
Printer-friendly Version
Interactive Discussion
Discussion
P
a
per
|
Dis
cussion
P
a
per
|
Discussion
P
a
per
|
Discussio
n
P
a
per
|
There is a relatively good agreement between models for vegetation covers, despite the differences between the simulated median evolution of the partitioning evapotran-spiration/evaporation (Fig. 10, right panels). The time evolution of TR/ET ratio shows that evaporation turns to be the main contribution to the simulated surface latent heat flux right after the rain (atD1), and then it gradually decreases. For HTESSEL,
tran-5
spiration is largely overriding, and nonetheless, the surface recovery is correctly simu-lated.
Estimates of τ1 and τ2 for the experiment and the simulated data are gathered in
Fig. 11. For bare soils,τ1andτ2 values deduced from experimental data are below 3
days (Table 3), whatever the soil type and the latitude. The values deduced from
sim-10
ulated data varies between 1 and 8 days. The standard deviation of these estimates varies between 0.5 and 1.9 days as a function of the site (Fig. 11). It represents a dis-crepancy between LSMs of 25 to 50 % of the mean value ofτ, which is not negligible considering thatτ1andτ2accuracy is less than 10 % for most of the LSMs (not shown).
The experimental values ofτ1at each location reflect the vegetation diversity which
15
decrease with increasing latitude. Actually, at Djougou, other vegetation covers could have been studied, in particular cultivated fields (crops, . . . ). In Niamey, the two surface stations sampled the two dominant land cover types. In Hombori, the sampled grass-land represents 60 % of the grass-landscape and 92 % of the vegetated surface (densely vegetated surface during the monsoon season occupying 5 % of the area is not taken
20
into account in this study, Timouk et al., 2009). Vegetation and soil texture in the LSMs are defined by ECOCLIMAP database (but for HTESSEL and SSiB) and the simulated EF presented in this study is an average over the grid point. Simulatedτ1 is then
ex-pected to be a weighted average of the experimental ones.
The simulatedτ1variability from LSM to LSM is about 25 % at Niamey and Hombori.
25
ACPD
13, 18581–18620, 2013Surface response to rain events throughout the West
African monsoon
F. Lohou et al.
Title Page
Abstract Introduction
Conclusions References
Tables Figures
◭ ◮
◭ ◮
Back Close
Full Screen / Esc
Printer-friendly Version
Interactive Discussion
Discussion
P
a
per
|
Dis
cussion
P
a
per
|
Discussion
P
a
per
|
Discussio
n
P
a
per
|
5 Discussion
Several empirical relationships have been derived from the AMMA surface measure-ments to better describe and understand the way the land surface responds to a rain event in a large range of surface caracteristics (soil moisture, vegetation types). It is in-teresting to note the consistency of the experimental results from one site to the other,
5
along the meridional transect. It has been shown that the relationships are simulated quite differently by the LSMs.
The simulated immediate response of the surface, i.e. the increase in EF the day after the rain, is not as clearly linked to soil moisture (Fig. 8) as it is in the observations (Fig. 6). Furthermore, most of the LSMs tend to overestimate the EF increase after the
10
rain, particularly at the highest latitude. Because the EF increase inD1 is mainly due to an increase in evaporation, several reasons could explain this overestimation by the LSMs, as an excess of interception or a limited drainage. However, it is questionable whether an over or under estimation of some processes, such as drainage or intercep-tion, can lead to a loss of relationship between surface response and soil moisture, in
15
particular for small LAI. Modeling bare soil evaporation is still an issue for LSM. The exponential decrease of EF during the dry period over bare soil is modeled with larger exponential coefficients in the simulation than in the experiment (Fig. 11). This means that, on average, the decrease of EF over bare soil is slower in the simulations. On the other hand, over vegetation covers, simulated and experimental exponential
20
coefficients are in the same range. Then differences between surface responses over bare soils and vegetations covers might be weaker in the simulations than they are in reality. This would lead to weaker surface heterogeneities whose role are important in convection initiation.
The dispersion of the exponential coefficient values among LSMs shows how the
25
ACPD
13, 18581–18620, 2013Surface response to rain events throughout the West
African monsoon
F. Lohou et al.
Title Page
Abstract Introduction
Conclusions References
Tables Figures
◭ ◮
◭ ◮
Back Close
Full Screen / Esc
Printer-friendly Version
Interactive Discussion
Discussion
P
a
per
|
Dis
cussion
P
a
per
|
Discussion
P
a
per
|
Discussio
n
P
a
per
|
Several Evaporation formulations have been compared by Mahfouf and Noilhan (1991) who pointed out a clear overestimation of nighttime evaporation with bulk aero-dynamic formulations whereas threeshold formulations are highly sensitive to the depth of the surface layer.
As in Teuling et al. (2006), the rooting depth is found to strongly influence the flux
5
recovery after a rain event. However, the more arid sites do not have the larger rooting depth. In fact, the dominant driver is the phenology of the dominant plants, with peren-nial plants found in forest and fallows (and tiger bush systems, not sampled here but common in some parts of the Sahel), and less so in annual-dominated ecosystemes like Sahelian grasslands and croplands. Note that trees and bushes are found in arid
10
Sahel, but usually at low density. A proper representation of the annual/perennial types of plants is therefore very important for simulating surface/atmosphere exchanges in West Africa.
These disparities between the simulated and the experimental relationships for the surface response and surface recovery do not necessarily explain model dispersion
15
at the annual time scale. It is difficult to know whether the errors are cumulative or whether they balance each other. The immediate response of the surface defines the initial conditions of the recovery period. Then, an overestimation of the simulated im-mediate response could shift the evaporative fraction toward high values during the whole dry period. On the contrary, this overestimation of the surface response after
20
the rain could also be balanced by an unusually weak exponential coefficent leading to a faster decrease of EF during the following days.
6 Conclusions
Several years of surface–atmosphere exchange measurements, over different vegeta-tion covers, at different latitudes in West Africa were acquired during the AMMA
ex-25
ACPD
13, 18581–18620, 2013Surface response to rain events throughout the West
African monsoon
F. Lohou et al.
Title Page
Abstract Introduction
Conclusions References
Tables Figures
◭ ◮
◭ ◮
Back Close
Full Screen / Esc
Printer-friendly Version
Interactive Discussion
Discussion
P
a
per
|
Dis
cussion
P
a
per
|
Discussion
P
a
per
|
Discussio
n
P
a
per
|
a rain event, throughout the monsoon, over bare soil and vegetation covers (fallow and forest in Benin, fallow and millet in Niger and grassland in Mali). In complement to the AMMA experiment, the ALMIP project provides several years of land surface model simulations.
In this study, the surface response is split into two stages: (1) the immediate surface
5
response which corresponds to evaporative fraction increase right after the rain and (2) the surface recovery period during which the evaporative fraction decreases with time. The measurements analysis shows that the soil water content before the rain mainly determines the amplitude of the surface immediate response: the lower the soil mois-ture, the higher the surface immediate response. Large surface responses are then
ob-10
served at the beginning of the monsoon when the soil moisture is still close to its wilting point value. The relationship between immediate surface response and soil moisture in the experiment is very similar from sites to sites, independent of the latitude. This is not the case in the simulations. The relationship, when it exists, is LSM and latitude dependent. Furthermore, the increase in EF after the rain tends to be overestimated
15
by the LSMs.
The decrease of the experimental evaporative fraction during the dry period is mod-eled by two exponential relationships previously used by Hunt et al. (2002); Kurc and Small (2004) and Teuling et al. (2006). Evaporative fraction over bare soil has been shown to decrease with a 1.0–2.9 day exponential coefficient at both the Niger and
20
Mali sites. The exponential coefficients for vegetation covers are higher and depend on the root depth, varying between 7 days for the grassland and 74 days for the forest. The phenology of the dominant plants proved to be critical for the surface recovery, in particuliar the density of perenial plants (shrubs, trees). In the simulations, the de-crease in EF over bare soil is less well simulated than over vegetation covers, with an
25
overestimation and a high discrepancy of the exponential coefficient.
ACPD
13, 18581–18620, 2013Surface response to rain events throughout the West
African monsoon
F. Lohou et al.
Title Page
Abstract Introduction
Conclusions References
Tables Figures
◭ ◮
◭ ◮
Back Close
Full Screen / Esc
Printer-friendly Version
Interactive Discussion
Discussion
P
a
per
|
Dis
cussion
P
a
per
|
Discussion
P
a
per
|
Discussio
n
P
a
per
|
evaporation appears to be one of these weaknesses which leads to a lack of relation-ship between surface response and soil moisture and to a LSMs disparity during the recovery period.
Acknowledgements. This work was supported by the AMMA project. AMMA was built by an international scientific group and was funded by a large number of agencies, especially
5
from France, UK, US and Africa. Field data were collected by the Service d’Observation AMMA-CATCH (www.amma-catch.org).
The publication of this article is financed by CNRS-INSU.
References
10
Balsamo, G., Viterbo, P. A., Beljaars, A., van den Hurk, B., Hirschi, M., Betts, A. K., and Sci-pal, K.: A revised hydrology for the ecmwf model: verification from field site to terrestrial water storage and impact in the integrated forecast system, J. Hydrometeorol., 10, 623–643, doi:10.1175/2008JHM1068.1, 2009. 18608
Boone, A., Masson, V., Meyers, T., and Noilhan, J.: The influence of the inclusion of soil freezing
15
on simulations by a soil–vegetation–atmosphere transfer scheme, J. Appl. Meteorol., 39, 1544–1569, 2000. 18608
Boone, A., De Rosnay, P., Balsamo, G., Beljaars, A., Chopin, F., Decharme, B., Ducharne, A., Gascoin, S., Grippa, M., Guichard, F., Gusev, Y., Harris, P., Jarlan, L., Kergoat, L., Mougin, E., Nasonova, O., Norgaard, A., Orgeval, T., Ottl ´e, C., Poccard-Leclerc, I.,
20
Polcher, J., Sandholt, I., Saux-Picard, S., Taylor, C., and Xue, Y.: The AMMA LAnd Sur-fAce ModeL inTercoMpAriSon projecT (ALMip), B. Am. Meteorol. Soc., 39, 1865–1880, doi:10.1175/2009BAMS2786.1, 2009. 18584, 18588
Boulain, N., Cappelaere, B., Ramier, D., Issoufou, H. B. A., Halilou, O., Seghieri, J., Guillemin, F., O¨ı, M., Gignoux, J., and Timouk, F.: Towards an understanding of coupled
ACPD
13, 18581–18620, 2013Surface response to rain events throughout the West
African monsoon
F. Lohou et al.
Title Page
Abstract Introduction
Conclusions References
Tables Figures
◭ ◮
◭ ◮
Back Close
Full Screen / Esc
Printer-friendly Version
Interactive Discussion
Discussion
P
a
per
|
Dis
cussion
P
a
per
|
Discussion
P
a
per
|
Discussio
n
P
a
per
|
physical and biological processes in the cultivated Sahel – 2. Vegetation and carbon dynam-ics, J. Hydrol., 375, 190–203, doi:10.1016/j.jhydrol.2008.11.045, 2009. 18607
Cappelaere, B., Descroix, L., Lebel, T., Boulain, N., Ramier, D., Laurent, J., Favreau, G., Boubkraoui, S., Boucher, M., Moussa, I. B., Chaffard, V., Hiernaux, P., Issoufou, H. B. A., Breton, E. L., Mamadou, I., Nazoumou, Y., Oi, M., Ottl ´e, C., and Quantin, G.: The
AMMA-5
CATCH experiment in the cultivated Sahelian area of south-west Niger – investigating water cycle response to a fluctuating climate and changing environment, J. Hydrol., 375, 34–51, doi:10.1016/j.jhydrol.2009.06.021, 2009. 18586
D’Amato, N. and Lebel, T.: On the characteristics of the rainfall events in the sahel with a view to the analysis of climatic variability, Int. J. Climatol., 18, 955–974, 1998. 18582
10
Decharme, B.: Influence of runoffparameterization on continental hydrology: comparison be-tween the Noah and the ISBA land surface models, J. Geophys. Res., 112, D19108, doi:10.1029/2007JD008463, 2007. 18608
de Rosnay, P., Gruhier, C., Timouk, F., Baup, F., Mougin, E., Hiernaux, P., Kergoat, L., and LeDantec, V.: Multi-scale soil moisture measurements at the Gourma meso-scale site in
15
Mali, J. Hydrol., 375, 241–252, doi:10.1016/j.jhydrol.2009.01.015, 2009. 18607
Desborough, C. E., Pitman, A. J., and Irannejad, P.: Analysis of the relationship between bare soil evaporation and soil moisture simulated by 13 land surface schemes for a simple non-vegetated site, Global Planet. Change, 13, 47–56, 1996. 18589
d’Orgeval, T., Polcher, J., and de Rosnay, P.: Sensitivity of the West African hydrological
20
cycle in ORCHIDEE to infiltration processes, Hydrol. Earth Syst. Sci., 12, 1387–1401, doi:10.5194/hess-12-1387-2008, 2008. 18608
Dugas, W. A., Hicks, R. A., and Gibbens, R. P.: Structure and function of C 3 and C 4 Chi-huahuan Desert plant communities. Energy balance components, J. Arid Env., 34, 63–79, 1996. 18594
25
Eltahir, E. A. B. and Gong, C.: Dynamics of wet and dry years in West Africa, J. Climate, 9, 1030–1042, 1996. 18583
Essery, R. L. H., Best, M. L., Betts, A. K., Cox, P. M., and Taylor, C. M.: Explicit representation of subgrid heterogeneity in a GCM land surface scheme, J. Hydrometeorol., 4, 530–543, 2003. 18608
30
ACPD
13, 18581–18620, 2013Surface response to rain events throughout the West
African monsoon
F. Lohou et al.
Title Page
Abstract Introduction
Conclusions References
Tables Figures
◭ ◮
◭ ◮
Back Close
Full Screen / Esc
Printer-friendly Version
Interactive Discussion
Discussion
P
a
per
|
Dis
cussion
P
a
per
|
Discussion
P
a
per
|
Discussio
n
P
a
per
|
Frappart, F., Hiernaux, P., Guichard, F., Mougin, E., Kergoat, L., Arjounin, M., Lavenu, F., Koit ´e, M., Paturel, J.-E., and Lebel, T.: Rainfall regime across the Sahel band in the Gourma region, Mali, J. Hydrol., 375, 128–142, doi:10.1016/j.jhydrol.2009.03.007, 2009. 18587, 18607
Gash, J., Kabat, P., Monteny, B., Amadou, M., Bessemoulin, P., Billing, H., Blyth, E., DeBruin, H.
5
A. R., Elbers, J., Friborg, T., Harrison, G., Holwill, C., Lloyd, C., Lhomme, J.-P., Moncrieff, J., Puech, D., Soegaard, H., Taupin, J., Tuzet, A., and Verhoeff, A.: The variability of evapora-tion during the HAPEX-Sahel Intensive Observaevapora-tion Period, J. Hydrol., 189, 385–399, 1997. 18583
Grippa, M., Kergoat, L., Frappart, F., Araud, Q., Boone, A., de Rosnay, P. J.-M, L., Gascoin, S.,
10
Balsamo, G., Ottl ´e, C., Decharme, B., Saux-Picart, S., and Ramillien, G.: Land water storage variability over West Africa estimated by Gravity Recovery and Climate Experiment (GRACE) and land surface models, Water Resour. Res., 47, 1–18, doi:10.1029/2009WR008856, 2011. 18584
Guichard, F., Asencio, N., Peugeot, C., Bock, O., Redelsperger, J.-L., Cui, X., Garvert, M.,
15
Lamptey, B., Orlandi, E., Sander, J., Fierli, F., Gaertner, M. A., Jones, S. C., Lafore, J.-P., Morse, A., Nuret, M., Boone, A., Balsamo, G., de Rosnay, P., Decharme, B., Harris, P. P., and Berg `es, J.-C.: An intercomparison of simulated rainfall and evapotranspiration associ-ated with a mesoscale convective system over West Africa, Weather Forecast., 25, 37–60, doi:10.1175/2009WAF2222250.1, 2010. 18584
20
Gusev, E. M., Nasonova, O. N., and Kovalev, E. E.: Modeling the components of heat and water balance for the land surface of the globe, Water Resour., 33, 616–627, 2006. 18608
Guyot, A., Cohard, J.-M., Anquetin, S., Galle, S., and Lloyd, C. R.: Combined analysis of energy and water balances to estimate latent heat flux of a sudanian small catchment, J. Hydrol., 375, 227–240, doi:10.1016/j.jhydrol.2008.12.027, 2009. 18584
25
Huffman, G. J., Adler, R. F., Bolvin, D. T., Gu, G., Nelkin, E. J., Bowman, K. P., Hong, Y., Stocker, E. F., and Wolff, D. B.: The TRMM Multisatellite Precipitation Analysis (TMPA): quasi-global, multiyear, combined-sensor precipitation estimates at fine scales, J. Hydrometeorol., 8, 38–55, doi:10.1175/JHM560.1, 2007. 18588
Hunt, J., Kelliher, F., McSeveny, T., and Byers, J.: Evaporation and carbon dioxide exchange
30
ACPD
13, 18581–18620, 2013Surface response to rain events throughout the West
African monsoon
F. Lohou et al.
Title Page
Abstract Introduction
Conclusions References
Tables Figures
◭ ◮
◭ ◮
Back Close
Full Screen / Esc
Printer-friendly Version
Interactive Discussion
Discussion
P
a
per
|
Dis
cussion
P
a
per
|
Discussion
P
a
per
|
Discussio
n
P
a
per
|
Koster, R. D., Suarez, M. J., Ducharne, A., Stieglitz, M., and Kumar, P.: A catchment-based approach to modeling land surface, J. Geophys. Res., 105, 24809–24822, 2000. 18608 Koster, R. D., Dirmeyer, P. A., Guo, Z., Bonan, G., Chan, E., Cox, P., Gordon, C. T., Kanae, S.,
Kowalczyk, E., Lawrence, D., Liu, P., Lu, C.-H., Malyshev, S., McAvaney, B., Mitchell, K., Mocko, D., Oki, T., Oleson, K., Pitman, A., Sud, Y. C., Taylor, C. M., Verseghy, D., Vasic, R.,
5
Xue, Y., and Yamada, T.: Regions of strong coupling between soil moisture and precipitation, Science, 305, 1138–1140, doi:10.1126/science.1100217, 2004. 18583
Kurc, S. A. and Small, E. E.: Dynamics of evapotranspiration in semiarid grassland and shrub-land ecosystems during the summer monsoon season, central New Mexico, Water Resour. Res., 40, 1–15, doi:10.1029/2004WR003068, 2004. 18583, 18585, 18592, 18594, 18600
10
Lebel, T., Cappelaere, B., Galle, S., Hanan, N., Kergoat, L., Levis, S., Vieux, B., Descroix, L., Gosset, M., Mougin, E., Peugeot, C., and Seguis, L.: AMMA-CATCH studies in the Sahelian region of West-Africa: an overview, J. Hydrol., 375, 3–13, doi:10.1016/j.jhydrol.2009.03.020, 2009. 18582, 18584
Lohmann, D. and Wood, E. F.: Timescales of land surface evapotranspiration response in the
15
PILPS phase 2(c), Global Planet. Change, 38, 81–91, doi:10.1016/S0921-8181(03)00007-9, 2003. 18583
Lohou, F., Sa¨ıd, F., Lothon, M., Durand, P., and Serc¸a, D.: Impact of boundary-layer processes on near-surface turbulence within the West African Monsoon, Bound.-Lay. Meteorol., 136, 1–23, doi:10.1007/s10546-010-9493-0, 2010. 18584
20
Mahfouf, J.-F. and Noilhan, J.: Comparative Study of Various Formulations of Evaporation from Bare Soil Using In Situ Data, J. Appl. Meteorol., 30, 1354–1365, 1991. 18599
Masson, V., Champeaux, J., Chauvin, F., Meriguet, C., and Lacaze, R.: A global database of land surface parameters at 1-km resolution in meteorological and climate models, J. Climate, 16, 1261–1282, 2003. 18588
25
Mauder, M. and Foken, T.: Documentation and Instruction Manual of the Eddy Covariance Software Package TK2, Work Report University of Bayreuth, Dept. of Micrometeorology, ISSN 1614-8916, 26, 42 pp., available at: http://opus.ub.uni-bayreuth.de/volltexte/2011/800/, 2004. 18587
Mougin, E., Hiernaux, P., Kergoat, L., Grippa, M., Rosnay, P. D., Timouk, F., Dantec, V. L.,
De-30
ACPD
13, 18581–18620, 2013Surface response to rain events throughout the West
African monsoon
F. Lohou et al.
Title Page
Abstract Introduction
Conclusions References
Tables Figures
◭ ◮
◭ ◮
Back Close
Full Screen / Esc
Printer-friendly Version
Interactive Discussion
Discussion
P
a
per
|
Dis
cussion
P
a
per
|
Discussion
P
a
per
|
Discussio
n
P
a
per
|
Lloyd, C., Hanan, N. P., Damesin, C., Delon, C., Serc¸a, D., Seghieri, J., Becerra, S., Dia, H., Gangneron, F., and Mazzega, P.: The AMMA-CATCH Gourma observatory site in Mali: lating climatic variations to changes in vegetation, surface hydrology, fluxes and natural re-sources, J. Hydrol., 375, 14–33, doi:10.1016/j.jhydrol.2009.06.045, 2009. 18586, 18607 Nicholson, S. E.: The West African Sahel: a review of recent studies on the rainfall regime and
5
its interannual variability, ISRN Meteorology, 2013, 1–32, doi:10.1155/2013/453521, 2013. 18582
Ramier, D., Boulain, N., Cappelaere, B., Timouk, F., Rabanit, M., Lloyd, C. R., Boubkraoui, S., M ´etayer, F., Descroix, L., and Wawrzyniak, V.: Towards an understanding of coupled physical and biological processes in the cultivated Sahel – 1. Energy and water, J. Hydrol., 375, 204–
10
216, doi:10.1016/j.jhydrol.2008.12.002, 2009. 18584, 18607
Redelsperger, J.-L., Thorncroft, C. D., Diedhiou, A., Lebel, T., Parker, D. J., and Polcher, J.: African monsoon multidisciplinary analysis, B. Am. Meteorol. Soc., 87, 1739–1746, doi:10.1175/BAMS-87-12-1739, 2006. 18584
Saux-Picart, S., Ottl ´e, C., Decharme, B., Andr ´e, C., Zribi, M., Perrier, A., Coudert, B.,
15
Boulain, N., Cappelaere, B., Descroix, L., and Ramier, D.: Water and energy budgets sim-ulation over the AMMA-Niger super-site spatially constrained with remote sensing data, J. Hydrol., 375, 287–295, doi:10.1016/j.jhydrol.2008.12.023, 2009. 18608
Sch ¨uttemeyer, D., Moene, A. F., Holtslag, A. A. M., and de Bruin, H. A. R.: Evaluation of two land surface schemes used in terrains of increasing aridity in West Africa, J. Hydrometeorol.,
20
9, 173–193, doi:10.1175/2007JHM797.1, 2008. 18595
Schwendike, J., Kalthoff, N., and Kohler, M.: The impact of mesoscale convective systems on the surface and boundary-layer structure in West Africa: case-studies from the AMMA campaign 2006, Q. J. Roy. Meteor. Soc., 136, 566–582, doi:10.1002/qj.599, 2010. 18583 Taylor, C. M., Gounou, A., Guichard, F., Harris, P. P., Ellis, R. J., Couvreux, F., and Kauwe, M. D.:
25
Frequency of Sahelian storm initiation enhanced over mesoscale soil-moisture patterns, Nat. Geosci., 4, 430–433, doi:10.1038/ngeo1173, 2011a. 18583
Taylor, C. M., Parker, D. J., Kalthoff, N., Gaertner, M. A., Philippon, N., Bastin, S., Har-ris, P. P., Boone, A., Agusti-Panareda, A., Baldi, M., Cerlini, P., Descroix, L., Fla-mant, C., Grandpeix, J.-Y., and Polcher, J.: New perspectives on land–atmosphere
feed-30
ACPD
13, 18581–18620, 2013Surface response to rain events throughout the West
African monsoon
F. Lohou et al.
Title Page
Abstract Introduction
Conclusions References
Tables Figures
◭ ◮
◭ ◮
Back Close
Full Screen / Esc
Printer-friendly Version
Interactive Discussion
Discussion
P
a
per
|
Dis
cussion
P
a
per
|
Discussion
P
a
per
|
Discussio
n
P
a
per
|
Taylor, C. M., de Jeu, R. A. M., Guichard, F., Harris, P. P., and Dorigo, W. A.: Afternoon rain more likely over drier soils, Nature, 489, 423–426, doi:10.1038/nature11377, 2012. 18583 Teuling, A. J., Seneviratne, S. I., Williams, C., and Troch, P. A.: Observed timescales
of evapotranspiration response to soil moisture, Geophys. Res. Lett., 33, L23403, doi:10.1029/2006GL028178, 2006. 18583, 18585, 18592, 18595, 18599, 18600
5
Timouk, F., Kergoat, L., Mougin, E., Lloyd, C., Ceschia, E., Cohard, J.-M., Rosnay, P. D., Hi-ernaux, P., Demarez, V., and Taylor, C.: Response of surface energy balance to water regime and vegetation development in a Sahelian landscape, J. Hydrol., 375, 178–189, doi:10.1016/j.jhydrol.2009.04.022, 2009. 18584, 18587, 18597, 18607
Wallace, J. and Holwill, C.: Soil evaporation from tiger-bush in south-west Niger, J. Hydrol.,
10
188–189, 426–442, doi:10.1016/S0022-1694(96)03185-X, 1997. 18591
Xue, Y., Sellers, P. J., Kinter, J., and Shukla, J.: A simplified Biosphere Model for Global Climate Studies, J. Climate, 4, 345–364, 1991. 18608
Zeng, N., Neelin, J. D., Lau, K.-M., and Tucker, J.: Enhancement of interdecadal cli-mate variability in the sahel by vegetation interaction, Science, 286, 1537–1540,
15
ACPD
13, 18581–18620, 2013Surface response to rain events throughout the West
African monsoon
F. Lohou et al.
Title Page
Abstract Introduction
Conclusions References
Tables Figures
◭ ◮
◭ ◮
Back Close
Full Screen / Esc
Printer-friendly Version
Interactive Discussion
Discussion
P
a
per
|
Dis
cussion
P
a
per
|
Discussion
P
a
per
|
Discussio
n
P
a
per
|
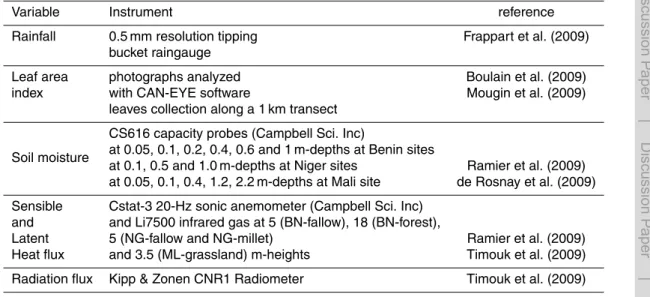
Table 1.Variables and associated instrument used at the experimental sites.
Variable Instrument reference
Rainfall 0.5 mm resolution tipping Frappart et al. (2009)
bucket raingauge
Leaf area photographs analyzed Boulain et al. (2009)
index with CAN-EYE software Mougin et al. (2009)
leaves collection along a 1 km transect
CS616 capacity probes (Campbell Sci. Inc)
Soil moisture at 0.05, 0.1, 0.2, 0.4, 0.6 and 1 m-depths at Benin sites
at 0.1, 0.5 and 1.0 m-depths at Niger sites Ramier et al. (2009)
at 0.05, 0.1, 0.4, 1.2, 2.2 m-depths at Mali site de Rosnay et al. (2009)
Sensible Cstat-3 20-Hz sonic anemometer (Campbell Sci. Inc)
and and Li7500 infrared gas at 5 (BN-fallow), 18 (BN-forest),
Latent 5 (NG-fallow and NG-millet) Ramier et al. (2009)
Heat flux and 3.5 (ML-grassland) m-heights Timouk et al. (2009)
ACPD
13, 18581–18620, 2013Surface response to rain events throughout the West
African monsoon
F. Lohou et al.
Title Page
Abstract Introduction
Conclusions References
Tables Figures
◭ ◮
◭ ◮
Back Close
Full Screen / Esc
Printer-friendly Version
Interactive Discussion
Discussion
P
a
per
|
Dis
cussion
P
a
per
|
Discussion
P
a
per
|
Discussio
n
P
a
per
|
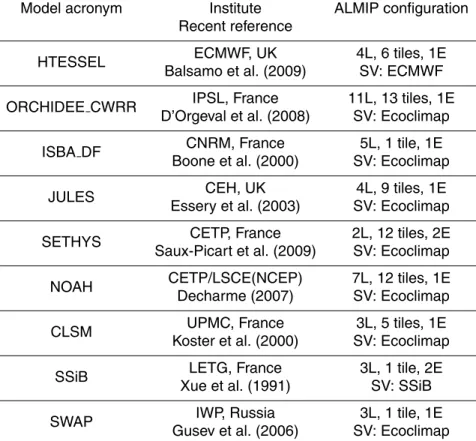
Table 2.Land Surface model participating in ALMIP experiment 3. The model configuration used for ALMIP is summarized in the last column with the number of vertical soil layers (L), number of energy budgets E per tile, and the soil-vegetation parameters used (SV). Tile refers to the maximum number of completely independent land surface types permitted within each grid box.
Model acronym Institute ALMIP configuration Recent reference
HTESSEL ECMWF, UK 4L, 6 tiles, 1E Balsamo et al. (2009) SV: ECMWF
ORCHIDEE CWRR IPSL, France 11L, 13 tiles, 1E D’Orgeval et al. (2008) SV: Ecoclimap
ISBA DF CNRM, France 5L, 1 tile, 1E Boone et al. (2000) SV: Ecoclimap
JULES CEH, UK 4L, 9 tiles, 1E
Essery et al. (2003) SV: Ecoclimap
SETHYS CETP, France 2L, 12 tiles, 2E Saux-Picart et al. (2009) SV: Ecoclimap
NOAH CETP/LSCE(NCEP) 7L, 12 tiles, 1E Decharme (2007) SV: Ecoclimap
CLSM UPMC, France 3L, 5 tiles, 1E Koster et al. (2000) SV: Ecoclimap
SSiB LETG, France 3L, 1 tile, 2E Xue et al. (1991) SV: SSiB