Meta-Analysis of Epidemiologic Studies
Hong-Bo Guan1*, Lang Wu2, Qi-Jun Wu3,4, Jingjing Zhu5, Tingting Gong1
1Department of Obstetrics and Gynecology, Shengjing Hospital, China Medical University, Shenyang, China,2Center for Clinical and Translational Science, Mayo Clinic, Rochester, Minnesota, United States of America,3Department of Epidemiology, Shanghai Cancer Institute, Renji Hospital, Shanghai Jiaotong University School of Medicine, Shanghai, China,4State Key Laboratory of Oncogene and Related Genes, Shanghai Cancer Institute, Renji Hospital, Shanghai Jiaotong University School of Medicine, Shanghai, China,5Department of Educational Psychology, University of Minnesota, Minneapolis, Minnesota, United States of America
Abstract
Background:Previous epidemiologic studies have reported inconsistent results between parity and pancreatic cancer (PC) risk. To our knowledge, a comprehensive and quantitative assessment of this association has not been conducted.
Methods: Relevant published studies of parity and PC were identified using MEDLINE (PubMed) and Web of Science databases until November 2013. Two authors (H-BG and LW) independently assessed eligibility and extracted data. Eleven prospective and 11 case-control studies reported relative risk (RR) estimates and 95% confidence intervals (CIs) of PC associated with parity. Fixed- and random-effects models were used to estimate the summary RR depending on the heterogeneity of effects.
Results:The summary RR for PC comparing the highest versus lowest parity was 0.86 (95% CI: 0.73–1.02;Q= 50.49,P,0.001,
I2= 58.4%). Significant inverse associations were also observed in the studies that adjusted for cigarette smoking (RR = 0.81; 95% CI: 0.68–0.98), Type 2 diabetes mellitus (RR = 0.83; 95% CI: 0.75–0.93), and those that included all confounders or important risk factors (RR = 0.85; 95% CI: 0.76–0.96). Additionally, in the dose-response analysis, the summary RR for per one live birth was 0.97 (95% CI: 0.94–1.01; Q= 62.83, P,0.001, I2= 69.8%), which also indicated a borderline statistically significant inverse effect of parity on PC risk. No evidence of publication bias and significant heterogeneity between subgroups were detected by meta-regression analyses.
Conclusion:In summary, these findings suggest that higher parity is associated with a decreased risk of PC. Future large consortia or pooled studies are warranted to fully adjust for potential confounders to confirm this association.
Citation:Guan H-B, Wu L, Wu Q-J, Zhu J, Gong T (2014) Parity and Pancreatic Cancer Risk: A Dose-Response Meta-Analysis of Epidemiologic Studies. PLoS ONE 9(3): e92738. doi:10.1371/journal.pone.0092738
Editor:Francisco X. Real, Centro Nacional de Investigaciones Oncolo´gicas (CNIO), Spain
ReceivedDecember 31, 2013;AcceptedFebruary 24, 2014;PublishedMarch 21, 2014
Copyright:ß2014 Guan et al. This is an open-access article distributed under the terms of the Creative Commons Attribution License, which permits unrestricted use, distribution, and reproduction in any medium, provided the original author and source are credited.
Funding:The authors have no support or funding to report.
Competing Interests:The authors have declared that no competing interests exist.
* E-mail: [email protected]
Introduction
Pancreatic cancer (PC) is the fourth leading cause of cancer death for both sexes in the United States [1], although the incidence rate is 30–50% higher in men than women [2]. Based on current knowledge, the incidence rate difference between the sexes cannot be completely attributed to established risk factors including cigarette smoking, overweight and obesity, history of diabetes mellitus (DM), history of pancreatitis, and non-O blood group [2]. Given the evidence fromin vitroandin vivostudies [3–4], it has been hypothesized that hormone-related or reproductive factors related to estrogen exposure may play a role in the etiology of PC.
Among the reproductive factors that have been investigated, parity (the number of livebirths in a woman’s lifetime), is less likely to be prone to recall bias and misclassification [5], but the results of epidemiologic studies have been conflicting which might be attributed to limited statistical power or inadequate adjustment for confounders [6–32]. Though a previous review has focused on this topic [33], to our knowledge, a comprehensive and quantitative
assessment of the association between parity and PC risk has not been conducted. Therefore, we carried out a dose-response meta-analysis on epidemiologic studies published up to November 2013 to quantify the association between parity and PC.
Materials and Methods
Literature search
Study selection criteria
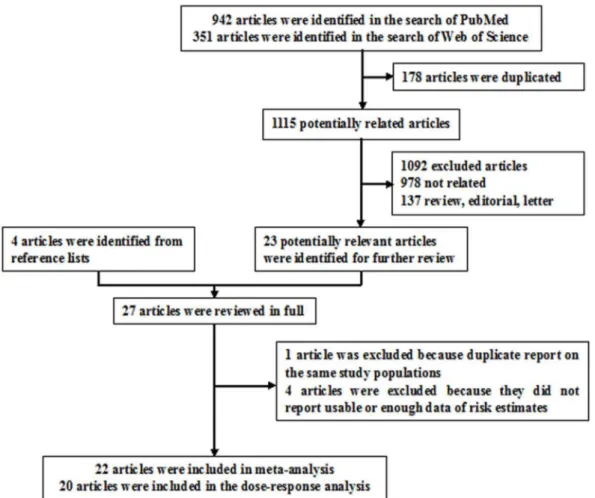
Published studies were included if they 1) used a case-control or prospective study design; 2) evaluated the association between parity and PC risk; and 3) presented hazard ratio (HR), odds ratio (OR), or relative risk (RR) estimates with 95% confidence intervals (CI), standard errors (SE) or data necessary to calculate these. When multiple publications from the same study were available, we used the publication with the largest number of cases and most applicable information. After excluding 1045 and 47 articles based on screening of titles or abstracts, respectively, we identified 27 potentially relevant articles for further full text review (Figure 1) [6–32]. One article was excluded because of duplicate reports from the same study population [29], 4 articles were excluded because they did not report usable or enough data of risk estimate [26,28,31–32]. Since less than 5% of the PC patients survive more than 5 years after diagnosis, thus we did not excluded the studies [9,12,16–17] reported the risk estimates between parity and PC mortality.
Data abstraction
For each eligible study, two investigators (H-BG and LW) independently performed the eligibility evaluation and data abstraction. The disagreements were discussed and resolved by consensus or by involving a third reviewer (Q-JW) for adjudica-tion. Data abstracted from each study were: author list, year of publication, study region and design, study sample size (number of cases and controls or cohort size), range of follow-up for cohort studies, exposure and outcome assessment including parity
categories, study-specific adjusted estimates with their 95% CIs for the highest versus lowest parity, and factors matched by or adjusted for in the design or data analysis. If multiple estimates of the association were available, we abstracted the estimate that adjusted for the most covariates.
Statistical analysis
The study-specific adjusted RRs were used as the measure of association across studies. Because the absolute risk of PC is low, we assumed that estimates of ORs from case-control studies and risk, rate or hazard ratios from prospective studies were all valid estimates of the RR and we therefore report all results as the RR for simplicity. For studies that did not use the category with lowest parity as the reference [11,19,23], we used the effective count method proposed by Hamling et al [37] to recalculate the RRs.
For the dose-response analysis which calculated parity as a continuous variable, we used the method proposed by Greenland et al. [38] to compute study-specific slopes (linear trends) and 95% CIs from the natural logs of the RRs and CIs across categories of parity. This method requires that the distribution of cases, person-years of non-cases and the RRs with the variance estimates for at least three quantitative exposure categories are known. For studies that reported the parity number by ranges we estimated the midpoint in each category by calculating the average of the lower and upper bound. When the highest category did not have an upper bound we assumed that the width of the open ended interval was the same as that of the adjacent interval. When the lowest category did not have a lower bound we set the lower
bound to zero. The dose-response results in the forest plots are presented based on increments of 1 live birth for parity. We examined a potential nonlinear dose-response relationship be-tween parity and PC using fractional polynomial models [39]. We determined the best-fitting second-order fractional polynomial regression model as the one with the lowest deviance. A likelihood ratio test was used to assess the difference between the nonlinear and linear models to test for nonlinearity [40].
We evaluated heterogeneity of RRs across studies by using the CochraneQstatistic and theI2statistic [41]. For theQstatistic, a P-value less than 0.1 was considered to be representative of statistically significant heterogeneity. I2represents the proportion of total variation contributed by between-study variation [41]. The summary estimate was based on the fixed-effects model [41] when no heterogeneity was detected or the random-effects model [42] when substantial heterogeneity was detected. In both methods, the study weight was the inverse of the variance of log RR, which was estimated from the 95% CI from each study. Subgroup analyses were carried out based on study design (cohort vs. case-control studies), number of cases ($200 (median) vs. ,200), type of controls for the case-control studies (population-based vs. hospital-based controls), geographic location (North America, Europe, or Asia). We also stratified the meta-analysis by potentially important confounders (i.e., body mass index (BMI), cigarette smoking, and Type 2 DM). Heterogeneity between subgroups was evaluated by meta-regression. AP-value less than 0.05 for meta-regression was considered representative of significant statistical difference between subgroups. Finally, we carried out sensitivity analyses excluding one study at a time to explore whether the results were strongly influenced by a specific study.
Publication bias was evaluated via Egger’s linear regression [43], Begg’s rank correlation methods [44] and funnel plots. AP -value less than 0.05 for Egger’s or Begg’s tests was considered representative of significant statistical publication bias. Statistical analyses were performed with Stata (version 11.2; StataCorp, College Station, TX).P-values were two sided with a significance level of 0.05.
Results
Study characteristics
Characteristics of the 22 included articles [6–25,27,30] are shown in Table S1. The included articles, which represent 8,247 cases and 3,498,673 non-cases, were published between 1992 and 2013 and consist of 11 prospective studies (9 cohort studies [7,9,12–13,15–18,20] and two nested case-control studies [6,23]) and 11 case-control studies [8,10–11,14,19,21–22,24–25,27,30]. Of the 11 prospective studies, four were conducted in the United States [7,15,17,20], and one each in Taiwan [9], United Kingdom [12], Norway [13], Japan [16], Canada [18], Sweden [23], and an international group which covered multiple countries [6]. Cohort sizes ranged from 37,459 [15] to 1,292,462 [9], and the number of PC cases varied from 154 [16] to 1,959 [17]. The highest parity in the prospective studies varied from 3 [9] to over 7 [17].
Of the 11 case-control studies, three were conducted in the United States [10,19,27], two each in Italy [8,25] and Canada [21–22], and one each in Egypt [14], China [24], and a study covering multiple countries [11]. The number of cases enrolled in these studies ranged from 56 [45] to 608 [46], and the number of control subjects varied from 52 [21] to 367 [11]. Control subjects were drawn from the general population in 7 studies [11,19,21– 22,24,27,30], hospitals in 4 studies [8,10,14,25], The highest parity in the case-control studies varied from 3 [11] to over 7 [14].
High vs. low parity
Eleven prospective [6–7,9,12–13,15–18,20,23] and 11 case-control studies [8,10–11,14,19,21–22,24–25,27,30] investigated the association between parity and PC risk. The summary RR of PC for the highest vs. lowest categories of parity was 0.86 (95% CI: 0.73–1.02), with significant heterogeneity (Q= 50.49,P,0.001,I2
= 58.4%) (Table 1 and Figure 2). There was no indication of publication bias with Egger’s test (P for bias = 0.652) or with Begg’s test (Pfor bias = 0.324) and no asymmetry was seen in the funnel plots when inspected visually. In a sensitivity analysis, we sequentially removed one study at a time and re-analyzed the data. The 22 study-specific RRs of parity ranged from a low of 0.84 (95% CI: 0.71–0.98, Q= 42.53, P= 0.002, I2 = 53.0%) after omission of the study by Ji et al [24] to a high of 0.89 (95% CI: 0.76–1.05,Q= 45.98,P= 0.001,I2 = 56.5%) after omission of the study by Lucenteforte et al. [8].
Dose-response analysis
Nine prospective [6–7,9,15–18,20,23] and 11 case-control studies [8,10–11,14,19,21–22,24–25,27,30] were included in the dose-response analysis. The summary RR per live birth was 0.97 (95% CI: 0.94–1.01), with significant of heterogeneity (Q= 62.83, P,0.001,I2 = 69.8%) (Table 1). In a sensitivity analysis excluding one study at a time, the summary RR for PC ranged from 0.97 (95% CI: 0.94–0.99,Q= 58.98,P,0.001,I2 = 69.5%) when the study by Ji et al [24] was excluded to 0.98 (95% CI: 0.95–1.01, Q= 56.29,P,0.001,I2 = 68.0%) when the study by Chang et al [9] was excluded. Additionally, the effect of excluding the two studies not included in the dose-response analysis on the summary RR for high vs. low parity was explored. The summary RR was 0.83 (95% CI: 0.68–1.00,Q= 43.60,P= 0.001,I2 = 56.4%) which
was similar to the original analysis including all studies. There was no evidence of a nonlinear association between parity and PC risk, P for nonlinearity = 0.2409. Furthermore, when we removed three studies [9,16–17] which reported the risk estimates from PC mortality, the results (RR, 0.98; 95% CI: 0.94–1.02,Q= 49.60, P,0.001,I2 = 67.7%) were similar.
Subgroup analyses
In subgroup analyses of highest versus lowest categories of parity and PC risk, almost all strata showed inverse associations, although not all of them showed statistical significance. There was no evidence of significant heterogeneity between subgroups with meta-regression analyses (Table 1). In the analyses stratified by whether the study included adjustment for specific potential confounders or important risk factors, significant inverse associ-ations were observed in studies which adjusted for cigarette smoking, Type 2 DM, or all of the potential confounders (Table 1). In addition, little heterogeneity was observed in the studies which adjusted for these aforementioned risk factors. Similar patterns were also observed in the dose-response analyses, but the results showed borderline statistical significance (Table 1). Since mortality rate of PC could be confounded by survival related factors, we further excluded the mortality estimates by the studies reported the risk estimates with PC mortality [9,12,16–17], but the estimate (RR = 0.89) were similar to the original analysis including all studies.
Discussion
of PC although the decrease in risk was small for each additional live birth. In addition, consistent inverse associations were observed within the analyses stratified by whether the studies included adjustment for cigarette smoking, Type 2 DM, or all of the confounders or important risk factors (Table 1).
Although the exact biological mechanisms by which increased parity may decrease the risk of PC are not well established, a hypothesis that endogenous estrogens may be protective against PC has been proposed based on in-vitro and in-vivo studies [3,47]. Pregnancy elevates serum estrogen levels approximately 100-fold [48]. Women with high parity are likely to have had longer periods of exposure to high levels of circulating estrogens which has been shown to inhibit the growth of preneoplastic pancreatic lesions or transplanted pancreatic carcinoma in rodent models [49–50]. In addition, sex-steroid biosynthetic enzymes (e.g., pancreatic homogenates and aromatase) and steroid hormone receptors have been detected in both normal and neoplastic human pancreatic tissue [51–54]. On the other hand, circulating insulin like growth factors (IGFs), which have been reported to increase PC risk through promoting cellular proliferation and inhibiting apoptosis [55], have been observed to be significantly lower in women with 4 births or more when compared with nulliparous women [56].
Although the results of meta-regression found no evidence of significant heterogeneity between subgroups by study design, the strength of the association estimate for prospective studies was weaker than that from case-control studies although both of them showed inverse associations with PC risk (Table 1). Given the extremely short median survival time of PC cases [57], possible survival bias in case-control studies could be of concern. Furthermore, though parity is less prone to recall bias and misclassification [5], the prospective studies enabled researchers to capture exposure information without the potential biases introduced by using proxy-interviews. For example, Duell et al [11] reported a positive association with PC although the confidence interval included 1. In addition, because deaths from PC may be regarded as a reasonable indicator of the incidence of PC considering about the short survival time and rapidly fatal characteristic of this cancer [9,57], this meta-analysis included four prospective studies [9,12,16–17] which reported the risk estimates for PC mortality. Our results were similar when we excluded these four studies in a sensitivity analysis (data not shown).
When we pooled the results stratified by whether the studies included adjustment for confounders, statistically significant inverse associations were detected in studies which adjusted for cigarette smoking, type 2 DM, and those that included all potential
Figure 2. Forest plot (random effects model) of parity (highest versus lowest) and pancreatic cancer risk by study design.Squares indicate study-specific relative risks (size of the square reflects the study-specific statistical weight); horizontal lines indicate 95% CIs; diamond indicates the summary relative risk estimate with its 95% CI. CI: confidence interval; RR: relative risk.
confounders. Several established risk factors for PC, including obesity [58–59], cigarette smoking [13,23], and type 2 DM [60– 61] are associated with parity and therefore might confound the association between parity and PC risk. Although meta-regression found no significant difference between the studies that did or did not adjust for specific confounders, the results and heterogeneity were slightly different. Compared to the high heterogeneity (Q= 65.1, P,0.001) which was observed among the studies did not adjust for type 2 DM, the summary results in these studies adjusted for aforementioned confounders had low heterogeneity. Similar pattern was also observed in the studies whether adjusted for the three confounders (BMI, cigarette smoking, and type 2 DM) (Table 1). However, considering that only a third of studies adjusted for type 2 DM and a quarter adjusted for the three confounders, future studies need to carefully adjust for these
potential confounders or report analyses stratified by these risk factors to better be able to rule out residual confounding.
This study had several strengths. To the best of our knowledge, this is the first comprehensive and quantitative assessment of parity and PC. Particular strengths of the current meta-analysis are that it including a total of 8,247 cases and 3,498,673 non-cases which should have provided sufficient statistical power to detect this putative association. A further strength is that we carried out a number of subgroup and sensitivity analyses to explore the potential sources of heterogeneity.
Potential limitations of this meta-analysis must be taken into consideration. First, as a meta-analysis of epidemiological studies, this study contains the limitations inherent to combining results from studies with heterogeneous study designs. Cohort studies are less susceptible to bias (e.g., recall and selection bias) than case-control studies because, due to the prospective design, information Table 1.Summary risk estimates of the association between parity and pancreatic cancer risk.
Highest versus lowest Dose-response analysis (per 1 live birth)
No. of Summary RR Q
I2
Value Ph* Ph** No. of Summary RR Q
I2
Value Ph* Ph**
studies (95% CIs) Statistic (%) studies (95% CIs) Statistic (%)
Overall 22 0.86 (0.73–1.02) 50.49 58.4 ,0.001 — 20 0.97 (0.94–1.01) 62.83 69.8 ,0.001
Subgroup analyses
Study Design 0.62 0.14
Prospective studies 11 0.92 (0.78–1.09) 18.5 45.9 0.047 9 0.99 (0.95–1.03) 31.29 74.4 ,0.001
Case-control studies 11 0.72 (0.50–1.05) 31.64 68.4 ,0.001 11 0.95 (0.90–1.01) 25.51 60.8 0.004
Number of cases 0.08 0.18
,200 10 0.71 (0.49–1.04) 24.19 62.8 0.004 10 0.95 (0.90–1.01) 23.11 61.1 0.006
$200 12 0.92 (0.77–1.10) 26.15 57.9 0.0006 10 0.98 (0.95–1.02) 35.45 74.6 ,0.001
Type of Control Subjects 0.25 0.38
Population based 7 0.75 (0.46–1.22) 21.24 71.8 0.002 7 0.94 (0.85–1.04) 20.59 70.9 0.002
Hospital based 4 0.67 (0.35–1.27) 9.44 68.2 0.024 4 0.96 (0.92–1.02) 4.80 37.6 0.187
Geographic location 0.27 0.33
North America 10 0.81 (0.63–1.02) 17.93 49.8 0.036 10 0.97 (0.94–1.01) 17.3 48.0 0.044
Europe 7 0.89 (0.65–1.22) 18.91 68.3 0.004 5 0.97 (0.90–1.04) 15.27 73.8 0.004
Asia 3 0.99 (0.46–2.13) 10.27 80.5 0.006 3 0.99 (0.86–1.14) 10.27 80.5 0.006
Adjustment for confounders or important risk factors
BMI 0.19 0.16
Yes 10 0.89 (0.71–1.12) 24.2 62.8 0.004 9 0.99 (0.94–1.03) 21.58 62.9 0.006
No 12 0.82 (0.63–1.08) 26.29 58.2 0.006 11 0.96 (0.91–1.01) 33.19 69.9 ,0.001
Cigarette smoking 0.70 0.90
Yes 18 0.81 (0.68–0.98) 36.71 53.7 0.004 17 0.97 (0.94–1.00) 30.30 47.2 0.016
No 4 1.09 (0.71–1.68) 10.98 72.7 0.012 3 0.99 (0.90–1.08) 11.23 82.2 0.004
DM 0.32 0.29
Yes 8 0.83 (0.75–0.93) 11.93 41.3 0.103 7 0.98 (0.96–1.00) 7.21 16.7 0.302
No 14 0.86 (0.65–1.13) 37.20 65.1 ,0.001 13 0.97 (0.92–1.02) 43.14 72.2 ,0.001
BMI, Cigarette smoking, and Type 2 DM
0.16 0.16
Yes 6 0.85 (0.76–0.96) 7.89 36.6 0.162 5 0.98 (0.96–1.00) 4.85 17.5 0.303
No 18 0.82 (0.63–1.06) 42.39 64.6 ,0.001 15 0.96 (0.92–1.01) 49.65 71.8 ,0.001
RR: relative risk; CI: confidence interval; BMI: body mass index; DM: diabetes mellitus.
* Pvalue for heterogeneity within each subgroup.
**
on exposures is collected before the diagnosis of the disease. Additionally, given the possible differences in detailed confounder adjustment information over time, we also carried out the stratified analysis by published year, but the results were unchanged (data not shown). Second, since we did not have access to the primary data of the studies included in this meta-analysis, we could not perform additional adjustments for potentially important covari-ates or accurately assign an exposure value to open-ended parity categories [62]. However, this is a common limitation in studies of dose-response relationships based on aggregate data. In addition, since the quality scoring in a meta-analysis of observational studies is controversial, lacks demonstrated validity, and results may not be associated with quality [63], we did not use the Newcastle-Ottawa Scale [64–65] to assess the methodological quality of included studies. Instead, we carried out numerous subgroup and sensitivity analyses. Third, significant heterogeneity and possible publication bias must be considered. There was significant heterogeneity for all studies combined in the analysis of high vs. low parity, as well as in the dose-response analysis, which could be explained by many factors, mainly the differences in confounder adjustment (Table 1). In addition, publication bias can be a problem in meta-analyses of published studies; however, we found no statistical evidence of publication bias in this meta-analysis by Egger’s linear regression and Begg’s rank correlation methods, and there did not appear to be asymmetry in the funnel plots when inspected visually.
In conclusion, this comprehensive meta-analysis provides evidence that increased parity is associated with a slightly decreased risk of PC. Although this relative risk is moderate in size, given the limited established risk factors and low survival rate, further large consortia or pooled studies, are warranted to fully adjust for the potential confounders and focus on the sex-steroid related factors which might play a role in the development of PC malignancies.
Supporting Information
Table S1 Characteristics of studies of parity and
pancreatic cancer risk.
(DOC)
Checklist S1 PRISMA 2009 Checklist.
(DOC)
Author Contributions
Conceived and designed the experiments: H-BG LW Q-JW J-JZ T-TG. Performed the experiments: H-BG LW Q-JW. Analyzed the data: H-BG Q-JW. Contributed reagents/materials/analysis tools: H-BG LW Q-JW J-JZ T-TG. Wrote the paper: H-BG. Approved the final manuscript: H-BG LW Q-JW J-JZ T-TG. Had full access to all of the data and the final responsibility for the decision to submit for publication: H-BG.
References
1. Siegel R, Naishadham D, Jemal A (2013) Cancer statistics, 2013. CA Cancer J Clin 63:11–30.
2. Anderson KE, Mack TM, Silverman DT (2006) Cancer of the pancreas. In: Schottenfeld D, Fraumeni JF Jr, eds. Cancer Epidemiology and Prevention. 3rd ed. New York, NY: Oxford University Press:721–762.
3. Benz C, Hollander C, Miller B (1986) Endocrine-responsive pancreatic carcinoma: steroid binding and cytotoxicity studies in human tumor cell lines. Cancer Res 46:2276–2281.
4. Bourhis J, Lacaine F, Augusti M, Huguier M (1987) Protective effect of oestrogen in pancreatic cancer. Lancet 2:977.
5. Dahabreh IJ, Trikalinos TA, Paulus JK (2012) Parity and risk of lung cancer in women: systematic review and meta-analysis of epidemiological studies. Lung Cancer 76:150–158.
6. Duell EJ, Travier N, Lujan-Barroso L, Dossus L, Boutron-Ruault MC, et al. (2013) Menstrual and reproductive factors in women, genetic variation in CYP17A1, and pancreatic cancer risk in the European prospective investigation into cancer and nutrition (EPIC) cohort. Int J Cancer 132:2164–2175. 7. Lee E, Horn-Ross PL, Rull RP, Neuhausen SL, Anton-Culver H, et al. (2013)
Reproductive Factors, Exogenous Hormones, and Pancreatic Cancer Risk in the CTS. Am J Epidemiol 178:1403–1413.
8. Lucenteforte E, Zucchetto A, Bosetti C, Talamini R, Negri E, et al. (2011) Reproductive and hormonal factors and pancreatic cancer risk in women. Pancreas 40:460–463.
9. Chang CC, Chiu HF, Yang CY (2010) Parity, age at first birth, and risk of death from pancreatic cancer: evidence from a cohort in Taiwan. Pancreas 39:567– 571.
10. Zhang Y, Coogan PF, Palmer JR, Strom BL, Rosenberg L (2010) A case-control study of reproductive factors, female hormone use, and risk of pancreatic cancer. Cancer Causes Control 21:473–478.
11. Duell EJ, Maisonneuve P, Baghurst PA, Bueno-de-Mesquita HB, Ghadirian P, et al. (2009) Menstrual and reproductive factors and pancreatic cancer in the SEARCH program of the IARC. Cancer Causes Control 20:1757–1762. 12. Stevens RJ, Roddam AW, Green J, Pirie K, Bull D, et al. (2009) Reproductive
history and pancreatic cancer incidence and mortality in a cohort of postmenopausal women. Cancer Epidemiol Biomarkers Prev 18:1457–1460. 13. Heuch I, Jacobsen BK, Albrektsen G, Kvale G (2008) Reproductive factors and
pancreatic cancer risk: a Norwegian cohort study. Br J Cancer 98:189–193. 14. Lo AC, Soliman AS, El-Ghawalby N, Abdel-Wahab M, Fathy O, et al. (2007)
Lifestyle, occupational, and reproductive factors in relation to pancreatic cancer risk. Pancreas 35:120–129.
15. Prizment AE, Anderson KE, Hong CP, Folsom AR (2007) Pancreatic cancer incidence in relation to female reproductive factors: Iowa Women’s Health Study. JOP 8:16–27.
16. Lin Y, Kikuchi S, Tamakoshi A, Kawamura T, Inaba Y, et al. (2006) Association of menstrual and reproductive factors with pancreatic cancer risk in
women: findings of the Japan Collaborative Cohort Study for Evaluation of Cancer Risk. J Gastroenterol 41:878–883.
17. Teras LR, Patel AV, Rodriguez C, Thun MJ, Calle EE (2005) Parity, other reproductive factors, and risk of pancreatic cancer mortality in a large cohort of U.S. women (United States). Cancer Causes Control 16:1035–1040. 18. Navarro SS, Miller AB, Rohan TE (2005) Hormonal and reproductive factors
and pancreatic cancer risk: a prospective cohort study. Pancreas 30:369–374. 19. Duell EJ, Holly EA (2005) Reproductive and menstrual risk factors for
pancreatic cancer: a population-based study of San Francisco Bay Area women. Am J Epidemiol 161:741–747.
20. Skinner HG, Michaud DS, Colditz GA, Giovannucci EL, Stampfer MJ, et al. (2003) Parity, reproductive factors, and the risk of pancreatic cancer in women. Cancer Epidemiol Biomarkers Prev 12:433–438.
21. Kreiger N, Lacroix J, Sloan M (2001) Hormonal factors and pancreatic cancer in women. Ann Epidemiol 11:563–567.
22. Hanley AJ, Johnson KC, Villeneuve PJ, Mao Y (2001) Physical activity, anthropometric factors and risk of pancreatic cancer: results from the Canadian enhanced cancer surveillance system. Int J Cancer 94:140–147.
23. Karlson BM, Wuu J, Hsieh CC, Lambe M, Ekbom A (1998) Parity and the risk of pancreatic cancer: a nested case-control study. Int J Cancer 77:224–227. 24. Ji BT, Hatch MC, Chow WH, McLaughlin JK, Dai Q, et al. (1996)
Anthropometric and reproductive factors and the risk of pancreatic cancer: a case-control study in Shanghai, China. Int J Cancer 66:432–437.
25. Fernandez E, La Vecchia C, D’Avanzo B, Negri E (1995) Menstrual and reproductive factors and pancreatic cancer risk in women. Int J Cancer 62:11– 14.
26. Kvale G, Heuch I, Nilssen S (1994) Parity in relation to mortality and cancer incidence: a prospective study of Norwegian women. Int J Epidemiol 23:691– 699.
27. Cantor KP, Lynch CF, Johnson D (1993) Reproductive factors and risk of brain, colon, and other malignancies in Iowa (United States). Cancer Causes Control 4:505–511.
28. Kalapothaki V, Tzonou A, Hsieh CC, Toupadaki N, Karakatsani A, et al. (1993) Tobacco, ethanol, coffee, pancreatitis, diabetes mellitus, and cholelithiasis as risk factors for pancreatic carcinoma. Cancer Causes Control 4:375–382. 29. La Vecchia C, Negri E, Franceschi S, Parazzini F (1993) Long-term impact of
reproductive factors on cancer risk. Int J Cancer 53:215–219.
30. Bueno DMH, Maisonneuve P, Moerman CJ, Walker AM (1992) Anthropo-metric and reproductive variables and exocrine carcinoma of the pancreas: a population-based case-control study in The Netherlands. Int J Cancer 52:24–29. 31. Haines AP, Moss AR, Whittemore A, Quivey J (1982) A case-control study of
pancreatic carcinoma. J Cancer Res Clin Oncol 103:93–97.
33. Wahi MM, Shah N, Schrock CE, Rosemurgy AN, Goldin SB (2009) Reproductive factors and risk of pancreatic cancer in women: a review of the literature. Ann Epidemiol 19:103–111.
34. Moher D, Liberati A, Tetzlaff J, Altman DG (2009) Preferred reporting items for systematic reviews and meta-analyses: the PRISMA statement. BMJ 339:b2535. 35. Wu QJ, Xie L, Zheng W, Vogtmann E, Li HL, et al. (2013) Cruciferous vegetables consumption and the risk of female lung cancer: a prospective study and a meta-analysis. Ann Oncol 24:1918–1924.
36. Guan HB, Wu QJ, Gong TT (2013) Parity and kidney cancer risk: evidence from epidemiologic studies. Cancer Epidemiol Biomarkers Prev 22:2345–2353. 37. Hamling J, Lee P, Weitkunat R, Ambuhl M (2008) Facilitating meta-analyses by deriving relative effect and precision estimates for alternative comparisons from a set of estimates presented by exposure level or disease category. Stat Med 27:954–970.
38. Greenland S, Longnecker MP (1992) Methods for trend estimation from summarized dose-response data, with applications to meta-analysis. Am J Epidemiol 135:1301–1309.
39. Royston P (2000) A strategy for modelling the effect of a continuous covariate in medicine and epidemiology. Stat Med 19:1831–1847.
40. Bagnardi V, Zambon A, Quatto P, Corrao G (2004) Flexible meta-regression functions for modeling aggregate dose-response data, with an application to alcohol and mortality. Am J Epidemiol 159:1077–1086.
41. Higgins JP, Thompson SG (2002) Quantifying heterogeneity in a meta-analysis. Stat Med 21:1539–1558.
42. DerSimonian R, Laird N (1986) Meta-analysis in clinical trials. Control Clin Trials 7:177–188.
43. Egger M, Davey SG, Schneider M, Minder C (1997) Bias in meta-analysis detected by a simple, graphical test. BMJ 315:629–634.
44. Begg CB, Mazumdar M (1994) Operating characteristics of a rank correlation test for publication bias. Biometrics 50:1088–1101.
45. La Vecchia C, Negri E, Franceschi S, Parazzini F (1993) Long-term impact of reproductive factors on cancer risk. Int J Cancer 53:215–219.
46. Lindblad P, Mellemgaard A, Schlehofer B, Adami HO, McCredie M, et al. (1995) International renal-cell cancer study. V. Reproductive factors, gyneco-logic operations and exogenous hormones. Int J Cancer 61:192–198. 47. Longnecker DS, Sumi C (1990) Effects of sex steroid hormones on pancreatic
cancer in the rat. Int J Pancreatol 7:159–165.
48. Yen SS (1994) Endocrinology of pregnancy. In: Creasy RK, Resnik R, eds. Maternal-Fetal Medicine: Principles and Practice. 3rd ed. Philadelphia, PA: Saunders:382–412.
49. Sumi C, Longnecker DS, Roebuck BD, Brinck-Johnsen T (1989) Inhibitory effects of estrogen and castration on the early stage of pancreatic carcinogenesis in Fischer rats treated with azaserine. Cancer Res 49:2332–2336.
50. Sumi C, Brinck-Johnsen T, Longnecker DS (1989) Inhibition of a transplantable pancreatic carcinoma by castration and estradiol administration in rats. Cancer Res 49:6687–6692.
51. Iqbal MJ, Greenway B, Wilkinson ML, Johnson PJ, Williams R (1983) Sex-steroid enzymes, aromatase and 5 alpha-reductase in the pancreas: a comparison of normal adult, foetal and malignant tissue. Clin Sci (Lond) 65:71–75. 52. Andren-Sandberg A, Hoem D, Backman PL (1999) Other risk factors for
pancreatic cancer: hormonal aspects. Ann Oncol 10 Suppl 4:131–135. 53. Greenway B, Iqbal MJ, Johnson PJ, Williams R (1981) Oestrogen receptor
proteins in malignant and fetal pancreas. Br Med J (Clin Res Ed) 283:751–753. 54. Singh S, Baker PR, Poulsom R, Wright NA, Sheppard MC, et al. (1997) Expression of oestrogen receptor and oestrogen-inducible genes in pancreatic cancer. Br J Surg 84:1085–1089.
55. LeRoith D, Roberts CJ (2003) The insulin-like growth factor system and cancer. Cancer Lett 195:127–137.
56. Holmes MD, Pollak MN, Hankinson SE (2002) Lifestyle correlates of plasma insulin-like growth factor I and insulin-like growth factor binding protein 3 concentrations. Cancer Epidemiol Biomarkers Prev 11:862–867.
57. Jemal A, Clegg LX, Ward E, Ries LA, Wu X, et al. (2004) Annual report to the nation on the status of cancer, 1975-2001, with a special feature regarding survival. Cancer 101:3–27.
58. Rosenberg L, Palmer JR, Wise LA, Horton NJ, Kumanyika SK, et al. (2003) A prospective study of the effect of childbearing on weight gain in African-American women. Obes Res 11:1526–1535.
59. Williamson DF, Madans J, Pamuk E, Flegal KM, Kendrick JS, et al. (1994) A prospective study of childbearing and 10-year weight gain in US white women 25 to 45 years of age. Int J Obes Relat Metab Disord 18:561–569.
60. Kritz-Silverstein D, Barrett-Connor E, Wingard DL (1989) The effect of parity on the later development of non-insulin-dependent diabetes mellitus or impaired glucose tolerance. N Engl J Med 321:1214–1219.
61. Nicholson WK, Asao K, Brancati F, Coresh J, Pankow JS, et al. (2006) Parity and risk of type 2 diabetes: the Atherosclerosis Risk in Communities Study. Diabetes Care 29:2349–2354.
62. Il’Yasova D, Hertz-Picciotto I, Peters U, Berlin JA, Poole C (2005) Choice of exposure scores for categorical regression in meta-analysis: a case study of a common problem. Cancer Causes Control 16:383–388.
63. Greenland S (1994) Invited commentary: a critical look at some popular meta-analytic methods. Am J Epidemiol 140:290–296.
64. Wells GA, Shea B, O’Connell D, Peterson J, Welch V, et al. The Newcastle-Ottawa Scale (NOS) for assessing the quality of nonrandomised studies in meta-analyses. Available from: http://www.ohri.ca/programs/clinical_ epidemiology/oxford.asp. Accessed October 1, 2013.