Interferon Response Pathways in Active Tuberculosis
Tom H. M. Ottenhoff2*, Ranjeeta Hari Dass1., Ninghan Yang1., Mingzi M. Zhang1
, Hazel E. E. Wong1, Edhyana Sahiratmadja4, Chiea Chuen Khor1, Bachti Alisjahbana4, Reinout van Crevel5,
Sangkot Marzuki3, Mark Seielstad1, Esther van de Vosse2, Martin L. Hibberd1*
1Infectious Disease, Genome Institute of Singapore, Singapore, Singapore, 2Department of Infectious Diseases, Leiden University Medical Center, Leiden, The Netherlands,3Eijkman Institute for Molecular Biology, Jakarta, Indonesia,4Health Research Unit, Faculty of Medicine, Padjadjaran University, Hasan Sadikin Hospital, Bandung, Indonesia,5Department of Internal Medicine, Radboud University Nijmegen Medical Center, Nijmegen, The Netherlands
Abstract
Tuberculosis (TB), caused by Mycobacterium tuberculosis (M.tb), remains the leading cause of mortality from a single infectious agent. Each year around 9 million individuals newly develop active TB disease, and over 2 billion individuals are latently infected withM.tbworldwide, thus being at risk of developing TB reactivation disease later in life. The underlying mechanisms and pathways of protection against TB in humans, as well as the dynamics of the host response toM.tb infection, are incompletely understood. We carried out whole-genome expression profiling on a cohort of TB patients longitudinally sampled along 3 time-points: during active infection, during treatment, and after completion of curative treatment. We identified molecular signatures involving the upregulation of type-1 interferon (a/b) mediated signaling and chronic inflammation during active TB disease in an Indonesian population, in line with results from two recent studies in ethnically and epidemiologically different populations in Europe and South Africa. Expression profiles were captured in neutrophil-depleted blood samples, indicating a major contribution of lymphocytes and myeloid cells. Expression of type-1 interferon (a/b) genes mediated was also upregulated in the lungs of M.tb infected mice and in infected human macrophages. In patients, the regulated gene expression-signature normalized during treatment, including the type-1 interferon mediated signaling and a concurrent opposite regulation of interferon-gamma. Further analysis revealedIL15RA, UBE2L6andGBP4as molecules involved in the type-I interferon response in all three experimental models. Our data is highly suggestive that the innate immune type-I interferon signaling cascade could be used as a quantitative tool for monitoring active TB disease, and provide evidence that components of the patient’s blood gene expression signature bear similarities to the pulmonary and macrophage response to mycobacterial infection.
Citation:Ottenhoff THM, Dass RH, Yang N, Zhang MM, Wong HEE, et al. (2012) Genome-Wide Expression Profiling Identifies Type 1 Interferon Response Pathways in Active Tuberculosis. PLoS ONE 7(9): e45839. doi:10.1371/journal.pone.0045839
Editor:Delia Goletti, National Institute for Infectious Diseases (L. Spallanzani), Italy
ReceivedJuly 6, 2012;AcceptedAugust 24, 2012;PublishedSeptember 21, 2012
Copyright:ß2012 Ottenhoff et al. This is an open-access article distributed under the terms of the Creative Commons Attribution License, which permits unrestricted use, distribution, and reproduction in any medium, provided the original author and source are credited.
Funding:The authors gratefully acknowledge the support of the following organizations: the Netherlands’ Organization of Scientific Research (NWO); the Royal Netherlands’ Academy of Arts and Sciences (KNAW); WOTRO/NACCAP; the Bill and Melinda Gates Foundation Grand Challenges in Global Health (grant GC6#74); the Netherlands Leprosy Relief Foundation; the Q.M. Gastmann Wichers Foundation. The research also received funding from the European Union’s Seventh Framework Programme [FP7/2007–2013] for projects NEWTBVAC; IDEA; and ADITEC (No: 280873). The funders had no role in study design, data collection and analysis, decision to publish, or preparation of the manuscript.
Competing Interests:The authors have declared that no competing interests exist. * E-mail: [email protected] (THMO); [email protected] (MLH)
.These authors contributed equally to this work.
Introduction
Approximately one third of the world’s population is estimated to be latently infected with Mycobacterium tuberculosis (M.tb), the etiological agent of tuberculosis (TB), which is responsible for about 8–10 million active new cases of TB each year [1,2]. A bacteriologically confirmed diagnosis of TB is challenging, as direct microscopy has low sensitivity, bacterial culture takes 2 to 4 weeks, and sputum samples can be microbiologically false negative. Effective treatment of active TB is crucial in containing spread of the disease, and better diagnostics would greatly impact on TB control by facilitating early treatment. Little is known about the precise mechanisms and pathways that control protective versus pathogenic immunity during TB [3,4]. The IL-12/IFN-c
and the TNF/TNFR axis are both crucial in protection during
M.tbinfection, as genetic (e.g.defects in the IL-12/IL-23/IFN-c/
STAT1 axis) or acquired (HIV; immune-suppressants; anti-cytokine auto-antibodies) defects strongly increase host-suscepti-bility to mycobacterial disease [5–7]. IFN-cis produced mostly by CD4+T cells and assists macrophages in controlling intracellular
M.tbinfection through various anti-microbial immunity pathways, which include phagosomal maturation; anti-microbial peptides; oxidative stress; apoptosis and autophagy [8]. Although IFN-cis essential to protection againstM.tb, it is not in itself a correlate of protection, however.
sarcoidosis patients (of European descent), a chronic inflammatory lung disease with granulomatous inflammatory pathology similar to TB, and observed a very similar pattern in gene-expression, miRNA expression and serum cytokine levels between the two diseases [16]. These data strongly suggest the presence of a major core pro-inflammatory pathway in TB and sarcoidosis, although also disease specific patterns could be distinguished marking TB and sarcoidosis. Thus there has been substantial success in identifying biomarkers associated with active TB.
Notwithstanding the value of these two genome wide gene expression studies reported recently, a major outstanding question is whether these signatures, captured mostly in EU and South African populations, also translate to populations and regions with a very different host genetic and TB epidemiological background. Our study addresses this issue directly by assessing unbiased whole genome expression profiles in Indonesia, an Asian country with the third highest TB prevalence worldwide. Specifically, we have examined gene expression patterns in PBMC from a longitudinal patient cohort during active TB, TB treatment and TB convalescence. Moreover, we replicated the findings in two independent model systems, a mouseM.tb-infection model and a mycobacterium-infected human macrophage cell line model. Although mouse models typically do not develop caseous necrotic lesions, the hallmark of human pulmonary TB [17], both mice and humans develop TB granulomas in the lung with activation of similar pro-inflammatory and anti-inflammatory responses [18], and develop highly parallel innate and adaptive immune responses during M.tb infection [8,19,20]. Our results validate and significantly extend the results available in the current literature, extend these to different ethnic and TB epidemiological settings, and further refine the pro-inflammatory biomarker signature associated with active TB.
Results
Gene Expression Profiles of Active TB Patients Versus Healthy Controls in a Longitudinal Patient Cohort from Indonesia
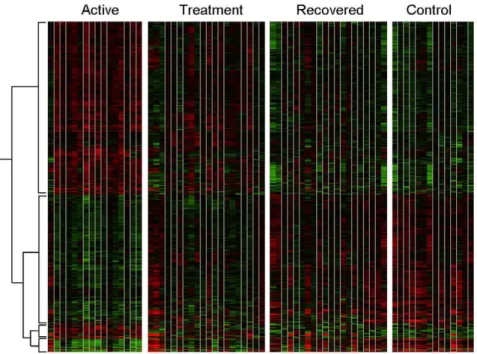
To identify molecular signatures involved in active TB, we applied microarray analysis to compare global gene expression in 23 patients with active TB (t = 0 weeks), whilst they were undergoing treatment (t = 8 weeks), and after they had completed the entire course of treatment (t = 28 weeks). The same microarray analysis was also applied to 23 matched healthy controls from the same population from the same area (see Methods). A total of 875 transcripts were significantly differentially expressed with an additional filter of a fold change greater than 2 compared to controls. The heatmap generated by these transcripts is shown (Figure 1). Looking at the overall gene-expression profile patterns as a continuum from active disease (t = 0 weeks) to treatment (t = 8 weeks) and cure (t = 28 weeks), we observed that global gene expression profile patterns were more similar for patients in the active disease stage (t = 0 weeks) and at the treatment stage (t = 8 weeks), whilst the gene expression profile patterns for patients after 28 weeks of curative treatment were more similar to those of the healthy controls.
Active TB Disease Involves the Expression of Genes Related to Several Branches of Immunity
Gene ontology clustering was performed on the 875 differentially expressed transcripts described above using the Panther analysis software, comparing them to the entire reference list (N$24,000) of genes. Of the 875 transcripts 460 fall within eight broad groupings which were most statistically significant: amongst others immunity
and defense, interferon-mediated and macrophage-mediated im-munity, and the chemokine and cytokine pathways (Table 1, Bonferroni-correctedP-values,0.05 for all the groups).
Differential Gene Regulation in Humans During Active TB Disease and Upon Treatment
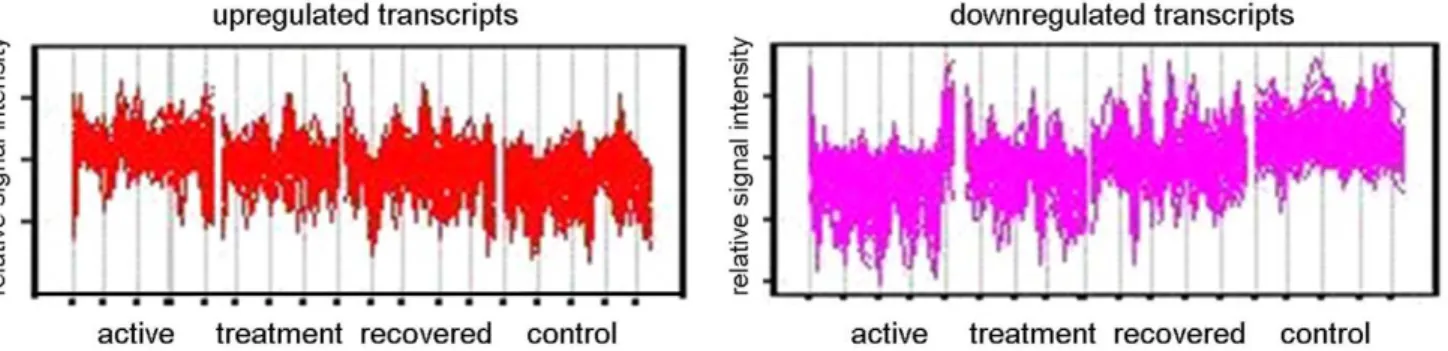
Further analysis was undertaken by hierarchically clustering the 875-transcript list using the Self Organizing Map (SOM) algorithm in Genespring GX10, taking into account the patients’ disease stage at the time of sampling (untreated active disease (t = 0), undergoing treatment (t = 8 weeks), during convalescence after curative treatment (t = 28 weeks)) and for comparison, healthy controls. In order to distinguish between different expression profiles across these four conditions, ANOVA was used and the 875 statistically significant transcripts discovered from gene ontology clustering were initially subjected to a 3 row by 4 column SOM matrix (model free). Transcripts which exhibited the same behavior were clustered together, and two groups of transcripts (Figure 2) can be observed to have the clearest evidence of increased (Figure 2, left panel) or decreased expression (Figure 2, right panel) when comparing with active TB (t = 0 weeks), with time points during treatment (t = 8, 28 weeks), as well as comparing with controls. Both clusters were investigated for gene ontology clustering using Panther analysis. Analysis with the group of transcripts showing significantly increased expression revealed 56 genes which were significantly involved in discrete biological pathways. The type 1 interferon mediated immunity (a subgroup of immunity and defense), underlined by interferona/b-mediated signaling, was highlighted as a very significant biological sub-process, (P= 5.2161028;
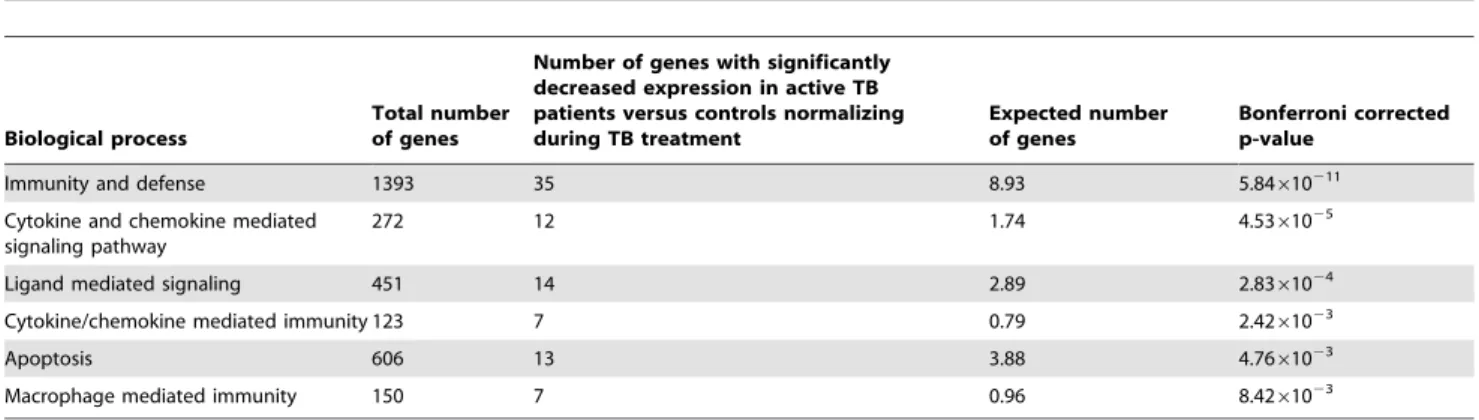
Table 2). Conversely, analysis with the group of transcripts showing significantly decreased expression revealed 88 genes involved in significant biological pathways. Apart from immunity and defense (P= 5.84610211), other highly significant biological processes highlighted include chemokine and chemokine-mediated signaling (P= 4.5361025 Table 3). Interestingly, a concurrent
down-regulation of interferon-gamma was observed.
Comparison of Gene Expression Signatures from the Longitudinal TB Cohort Versus Those Obtained in a Humanin vitroMacrophage Infection Model
In order to examine whether the findings using patient blood mRNA responses could be confirmed in a well defined in vitro
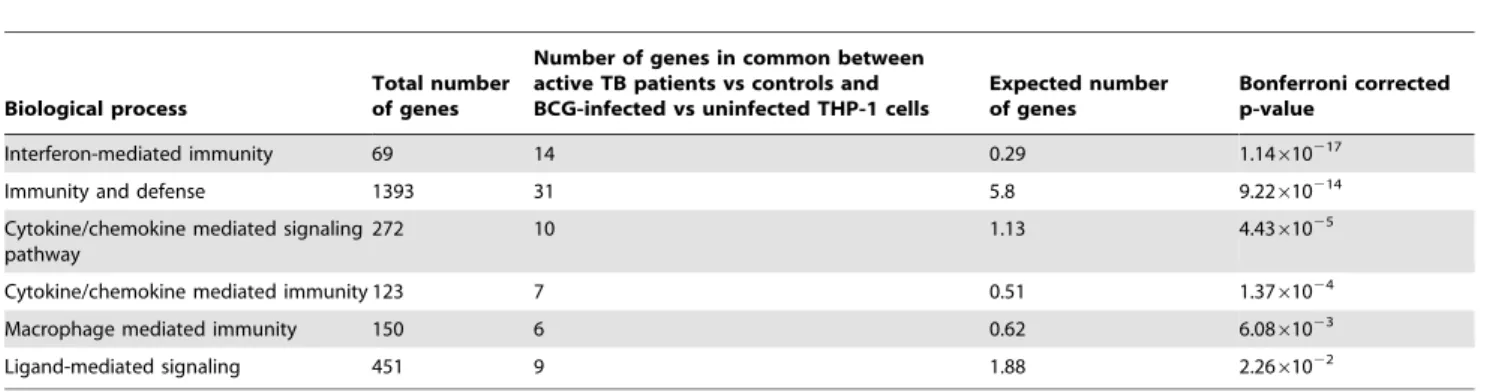
human macrophage (THP-1) cell line infection model, THP-1 cells were infected with the TB vaccine strain,M.bovis BCG (for 20 hours). A total of 461 transcripts were found by microarray analysis to be significantly differentially expressed in THP-1 macrophages following infection with BCG compared to unin-fected control cells. A significant proportion, 95 out of these 461 transcripts, was found to be shared with the significantly differentially in vivo expressed transcripts in the above patient cohort (Figure 3). These 95 transcripts were investigated for functional clustering using Panther analysis, of which 77 out of the 95 were found to be significantly involved within functional clusters. The most significant biological process was again found to be in interferon mediated immunity (P= 1.14610217
;Table 4).
Human Host Responses toM.tbInfection Common with anin vivoMouse Infection Model
1,674 transcripts were found by microarray analysis to be significantly differentially expressed in C57BL/6 mice infected withM.tbcompared to non-infected controls. Of these transcripts, 121 were common to the significantly differentially expressed transcripts in the human cohort (Figure 4). These common transcripts were subjected to Panther gene ontology analysis, and 85 out of the 121 transcripts clustered into significant biological pathways. The most significant biological pathway was once again type1 interferon-mediated immunity (Table 5).
Genes Found in Common in All 3 Models of TB
A total of 26 genes (or 33 entities due to the presence of multiple transcripts for several genes) were found to be significantly differentially expressed in all 3 models (longitudinal human TB
cohort, human macrophage cell line, and in vivomouse model;
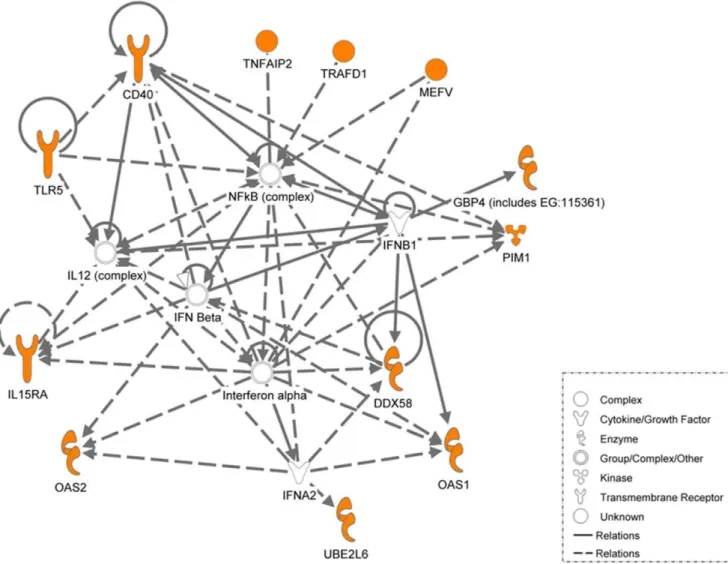
Table 6, Figure 5). These 26 genes were then subjected to Ingenuity Pathway Analysis (IPA). The most significant network (P,10232
) includes 18 focus molecules showing a high level of interaction between these molecules which involves both NFkB activation and the type I interferon response.
We then proceeded to validate the microarray findings for these 26 genes using quantitative RT-PCR (qRT-PCR); for successful validation, the direction for the fold-change in gene expression using qRT-PCR should be consistent with the micro-array findings. A total of 17 out of the 26 genes were successfully validated via qRT-PCR in the longitudinal patient cohort and 15 out of the 17 genes were validated in the human macrophage model (BCG-infected THP-1 cells) (Table 6). These 15 genes
Figure 1. Differential gene expression in blood from TB patients and controls determined by microarrays.Heat map of 875 transcripts which were statistically different in one condition from the other condition, using ANOVA and were hierarchically clustered. active = patients with active disease, treatment = patients after 8 weeks of treatment, recovered = patients after 28 weeks of treatment and controls = healthy controls. Red represents an increase in gene expression and green represents a decrease in gene expression.
doi:10.1371/journal.pone.0045839.g001
Table 1.The distinct pathways in which gene ontology clusters 460 of the 875 differentially expressed genes.
Biological process
Total number of genes
Number of genes differentially expressed between active TB patients and controls
Expected number of genes
Bonferroni corrected p-value
Immunity and defense 1393 126 53.85 3.57610217
Interferon mediated immunity 69 17 2.67 5.1561027
Macrophage-mediated immunity 150 24 5.8 1.5761026
Cytokine/chemokine mediated signaling pathway
272 31 10.51 3.5361025
Natural Killer Cell mediated immunity 77 14 2.98 4.2161024
Apoptosis 606 44 23.42 2.261023
T-cell mediated immunity 210 21 8.12 1.561022
Signal transduction 3791 183 146.54 2.161022
Significant pathways and biological processes overrepresented in differentially expressed genes between actively diagnosed patients and healthy controls from Panther analysis. 460 out of the 875 transcripts identified clustered into significant biological pathways and processes. A Bonferroni-correctedP,0.05 was considered statistically significant.
were common to both the human models (longitudinal patient cohort and BCG-infected THP-1 cells). However, only 5 out of the 17 genes could be validated in thein vivomouse model (Table 6). Considering all validation data, 3 genes (IL15RA, UBE2L6 and GBP4) out of the 26 genes common to all 3 models were found to be consistently and reproducibly upregulated across 3 model systems (Figure 6). It is clear from the network analysis (Figure 7) that IL15RA, UBE2L6 and GBP4 are involved in the type-I interferon signaling response.
Discussion
Comparing gene expression profiles in 3 models of TB, a longitudinal human TB cohort study comprising of newly-diagnosed TB patients followed up through treatment, a BCG-infected human macrophage cell line and anin vivomouse lung TB infection model, we identified in all three models a highly prominent type-I interferon molecular signature. This result significantly extends those of Berry et al [15], and Maertzdorf et al [16]. who found highly similar signatures in the blood of TB patients in Europe and South Africa; our results now confirm and extend this to a TB endemic setting on a third continent in a different host genetic as well as TB epidemiological setting, namely Indonesia. In addition, our results confirm and validate part of the findings in two independent models of TB infection, thus connecting the TB patient blood expression profiles to pulmonary and macrophage expression signatures.
Our un-biased whole genome microarray analysis revealed that the most prominent host responses in all three models of infection were immune related. The most significant pathways were interferon mediated immunity, macrophage mediated immunity
and cytokine and chemokine mediated signaling pathways. Further analysis of the differentially expressed genes in the TB patient study revealed that the type-1 interferon signaling activity was the predominant pathway up-regulated during active disease, and that there was concurrent down-regulation of interferon-gamma. This is consistent with findings that key protective immune mechanisms are repressed by type-1 interferon signaling during active TB infection [21,22] as a possible immune evasion response.
The network analysis of genes found to be commonly regulated in all 3 independent TB disease models showed that the most significant network was mainly involved in IL-12, IFN-aand
IFN-bsignaling. This is indeed noteworthy as evidence implicating the involvement of type 1 interferon (IFN-a and IFN-b) in TB have only begun to emerge very recently [15]. In the present study, we have shown an up regulation in type 1 interferon (a/b) and the genes involved. Kuchteyet al., showed that during early infection (2–3 weeks post infection) there was an enhanced growth ofM. bovisBCG in the lungs of mice deficient in IFN-abreceptors, and during late infection the burden of BCG was similar in lungs of IFN-ab2/2 and wild type mice [23]. Desvignes et al. recently
reported a similar non redundant protective role for type-1 interferons during earlyM.tbinfection in a mouse model [24]. In a large human study using whole blood from active TB patientsvs.
uninfected controls, Berryet al., found an increase in type 1 IFN which was attributed predominantly to neutrophils [15]. Here, however, we present highly similar findings in TB patients’ blood leucocytes, which were depleted of neutrophils through Ficoll density centrifugation, but still include monocyte/macrophages. The fact that the latter are the most likely source of this signature was supported by the finding of a similar signature in an
Figure 2. Cluster analysis using self-organizing map with further Panther analysis.Genespring GX10 was used to analyse transcripts which were significantly different between the four conditions (Active disease, Treatment, Recovered and Controls) using one-way ANOVA and subsequently subjected to self-organizing map clustering analysis. Upregulated transcripts (left panel) and downregulated transcripts (right panel) were subjected to further analysis through Panther.
doi:10.1371/journal.pone.0045839.g002
Table 2.The distinct pathways in which gene ontology clusters 56 of the genes with increased expression normalizing during treatment.
Biological process
Total number of genes
Number of genes with significantly increased expression in active TB patients versus controls, normalizing during TB treatment
Expected number of genes
Bonferroni corrected p-value
Immunity and defense 1393 39 11.20 1.83610210
Type-I interferon mediated immunity 69 10 0.55 5.2161028
Macrophage mediated immunity 150 7 1.21 0.034
independent, human macrophage cell line model of mycobacterial infection. Also in another study using whole blood to compare gene expression profiles in TB patients with active disease vs.
individuals with latent M.tbinfection several interferon inducible genes were found to be profoundly upregulated, including IFN-a
protein 6 and 27 and ISG15 [12]. Furthermore, exogenously added IFN-awas found to inhibit the priming effect of IFN-con key cytokine release by monocytes [22]. IFN-bwas found to have a similar effect [25]. This is compatible with a model in which enhanced type I interferon signaling inhibits type II interferon mediated protective immunity in TB.
It is unsurprising that of all immune cells and corresponding signaling systems (T-cells, B-cells, monocytes/dendritic cells/ macrophages, natural killer cells), the macrophage-mediated immunity process was consistently found to play a dominant role (Tables 1–4) in the transcriptional response in each of the three different study models. This highlights the key role that M.tb/ macrophage interactions play during infection. Alveolar macro-phages phagocytose inhaledM.tbby a wide range of receptors such as complement receptors CR1, 3 and 4; mannose receptors;
Toll-like receptors; C-type-2 lectin receptors and scavenger receptors [26]. The further influx of macrophages following the formation of a primary lesion further highlights the key role of these professional phagocytes in pulmonary host defence in TB [12].
M.tbhowever inhibits macrophage activity by inhibiting autoph-agy, an important cellular mechanism to control intracellularM.tb
[27,28]. In addition,M.tb blocks the maturation of phagosomes such that they fail to traffic further along the endosomal-lysosomal pathway and fail to fuse with lysosomes. One newly identified receptor which may be important in this process is human TLR8. A polymorphism resulting in a missense mutation in TLR8 (Met1Val) was recently shown to be strongly associated with human susceptibility to TB [29]. Increased credence to the possible involvement of TLR8 in upstreamM.tbrecognition is lent by findings from the expression array in the longitudinal patient cohort, which highlighted the significance of the immunity and defense pathway in active disease, including TLRs. It may be of interest to note that TLR8 is absent from mice, which could account for part of the differences in TB infection biology between humans and mice.
Table 3.The distinct pathways in which gene ontology clusters 88 of the genes with decreased expression normalizing during treatment.
Biological process
Total number of genes
Number of genes with significantly decreased expression in active TB patients versus controls normalizing during TB treatment
Expected number of genes
Bonferroni corrected p-value
Immunity and defense 1393 35 8.93 5.84610211
Cytokine and chemokine mediated signaling pathway
272 12 1.74 4.5361025
Ligand mediated signaling 451 14 2.89 2.8361024
Cytokine/chemokine mediated immunity 123 7 0.79 2.4261023
Apoptosis 606 13 3.88 4.7661023
Macrophage mediated immunity 150 7 0.96 8.4261023
Significant Panther biological processes were detected with 88 down-regulated genes; type 2 interferon expression is decreased in this group. doi:10.1371/journal.pone.0045839.t003
Figure 3. Comparison of differential gene expression betweenM.tbinfected patients and BCG infected THP-1 cells.Venn diagram representing the 875 significantly differentially expressed in TB patients and 461 transcripts significantly differentially expressed in THP-1 BCGin vitro model. A total of 95 transcripts were found to be in common between these two systems. Red – transcripts for active TB patients only; Green – Common between TB patients and BCG-infected THP-1 cell line; Blue – transcripts for BCG-infected THP-1 only.
Further validation of our findings using qRT-PCR revealed that
IL15RA, UBE2L6 and GBP4 were involved in this molecular signature in all three models (Figure 6). IL15RA encodes for interleukin-15 (IL-15) receptor alpha (IL-15Ra), a common cytokine receptor expressed by macrophages that plays an important role in the development, survival, and proliferation of various immune cells (e.g. natural killer and CD8+T cells). IL-15,
which is co expressed with IL-15Ra by antigen presenting cells allowing trans-production of cytokines to immune effector cells [30] is generally considered to be a regulator of T cell homeostasis as it cooperates with other cytokines like IL-2 and IL-7 to maintain pools of naive and memory T cell populations. Mortieret al., has described that IL-15Raexpression on macrophages supports the early transition of antigen specific effector CD8+ T cells to
memory cells [31]. As these processes are critical in the early immune response against microbial infections, and as data on the potential protective effects of IL-15 on murine experimental tuberculosis is starting to emerge, further studies are necessary in order to document the precise mechanism of action of
IL-15-mediated type-I interferon signaling on M.tb survival and proliferation.
The second gene with consistent validation across the three TB models studied here,UBE2L6, is a member of the ubiquitin family of proteins. The modification of proteins with ubiquitin is an important cellular mechanism for targeting abnormal or short-lived proteins for degradation, and recent work linking the ubiquitin family of proteins to type-I interferon mediated host immune responses is now beginning to emerge [32–35].
The third gene,GBP4, encodes Guanylate binding protein 4. With IFN-abeing a main hypothesis in our study, it is reassuring thatGBP4was commonly found in all 3 models, and indeed GBP4 displays a direct interaction with IFN-a(Figure 7). Type 1 and 2 IFNs have been shown to differentially regulate theGBPfamily of genes, and GBP4 is exclusively regulated by IFN-a production through macrophages [36].
In our study a substantial number of overlapping genes were identified when comparing BCG infected human macrophage cells and circulating leucocytes from TB patients with active disease (Figure 3). The majority of these genes was present in the
Table 4.Differentially expressed genes in common between active TB patients versus controls and BCG-infected versus uninfected THP-1 cells.
Biological process
Total number of genes
Number of genes in common between active TB patients vs controls and BCG-infected vs uninfected THP-1 cells
Expected number of genes
Bonferroni corrected p-value
Interferon-mediated immunity 69 14 0.29 1.14610217
Immunity and defense 1393 31 5.8 9.22610214
Cytokine/chemokine mediated signaling pathway
272 10 1.13 4.4361025
Cytokine/chemokine mediated immunity 123 7 0.51 1.3761024
Macrophage mediated immunity 150 6 0.62 6.0861023
Ligand-mediated signaling 451 9 1.88 2.2661022
Significant Panther biological processes were detected from 77 out of the 95 over-represented genes common between the two models. doi:10.1371/journal.pone.0045839.t004
Figure 4. Comparison of differential gene expression between patients with active TB and mice infectedM.tb in vivomodel.Venn diagram representing the 875 significantly differentially expressed in TB patients and 1674 transcripts significantly differentially expressed in TB actively infected mice. A total of 121 transcripts were found to be in common between these two systems. Red – transcripts for TB patient only; Green – Common between TB patients and mice infected with TB; Blue – transcripts for mice infected with TB only.
immune-mediated and host defense pathways. It needs to be highlighted that these genes were also common when the mouse TB infection model was compared to the data from the human models (Figure 4). The genes overlapping in all three systems were further validated with qRT-PCR. The 15 genes that were successfully validated in the THP-1 cell line model by qRT-PCR completely overlapped with the 17 genes validated by qRT-PCR in the longitudinal patient cohort. (Figure 6). This is not surprising since both models share a common human host background. The fact that only 3 genes were common to all three models may reflect important differences between the human and mouse models of TB. The PCR validation of these genes may represent an underestimate of the of the true array findings as the detection probes did not directly overlap with the array probes and so may not be able to confirm the specific RNA transcript identified by the array, particularly in the mouse to human comparisons. Although the use of BCG rather thanM.tbin the THP-1 infection model may also have contributed to this
relatively low number, it should be emphasized that the analysis focused only on those genes found in all three models, and that the variation between theM.tbinfected human patients and theM.tb
infected mice was significantly larger that that between theM.tb
infected human patients and the BCG infected THP-1 cells. Our approach thus excludes the identification of genes based on only one individual model, and identifies genes only when they have been validated in three models, which is a significant advance compared to previous studies. In our study the mice were infected withM.tbintravenously, and it will be of interest to see whether infection via the aerosolic route, which is reflective of natural TB transmission, would have yielded similar response patterns. A cardinal feature of human TB is of central caseous necrosis in pulmonary granulomatous lesions, while such necrotic lesions are not seen in the mouse TB infected lung. Caseous necrosis is considered an essential step towards developing cavernous TB, in which phaseM.tbbacilli are released into the open airways prior to transmission. Thus, there are clear differences in the pathological
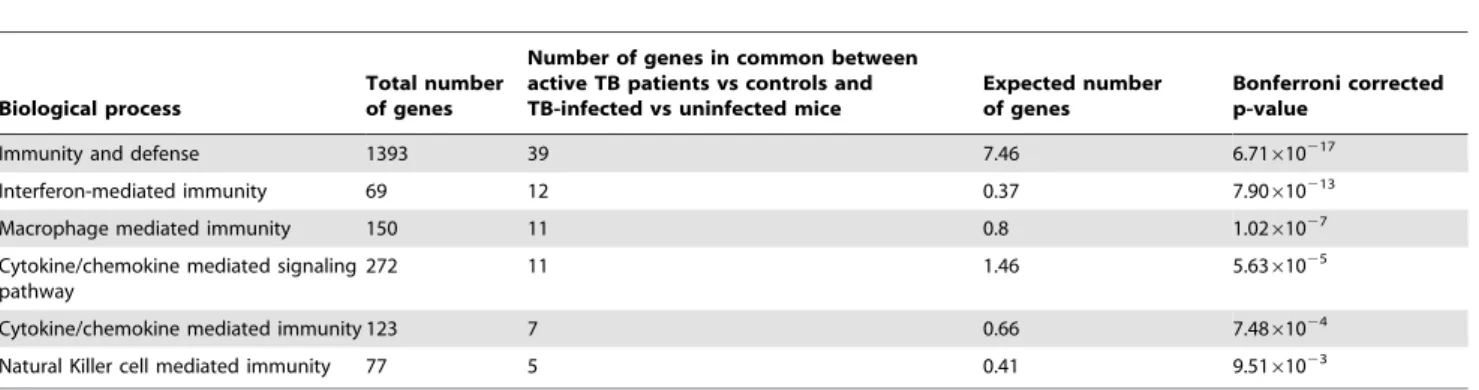
Table 5.Differentially expressed genes in common between active TB patients versus controls and TB-infected versus uninfected mice.
Biological process
Total number of genes
Number of genes in common between active TB patients vs controls and TB-infected vs uninfected mice
Expected number of genes
Bonferroni corrected p-value
Immunity and defense 1393 39 7.46 6.71610217
Interferon-mediated immunity 69 12 0.37 7.90610213
Macrophage mediated immunity 150 11 0.8 1.0261027
Cytokine/chemokine mediated signaling pathway
272 11 1.46 5.6361025
Cytokine/chemokine mediated immunity 123 7 0.66 7.4861024
Natural Killer cell mediated immunity 77 5 0.41 9.5161023
Significant Panther biological processes were detected from 85 out of the 121 over-represented genes common between the two models. doi:10.1371/journal.pone.0045839.t005
manifestations of TB in human and mouse systems and this difference in disease pathology has been central to the argument that the mouse is an imperfect model for TB. However, notwithstanding these differences, we were able to observe consistent molecular signatures of active TB across the distinct models, thus supporting the general conclusion that mouse models are appropriate for studying certain aspects of the immune molecular host response to infection.
The use of TB patients cohorts,in vitrohuman macrophage cell lines and inbred mouse models of TB have provided new information which is in line with, but also significantly extends recent work from other groups [15,16]. Collectively, these studies demonstrate the major role of dysregulated inflammation in general, and of strongly enhanced type 1 IFN-ab signaling in active TB disease. Importantly whereas this latter finding was originally attributed to the activity of neutrophils, we here find these same gene expression patterns also in cells devoid of neutrophils, such as PBMCs and macrophages. Finally, our study discovered genes commonly expressed in all three TB models we have studied, for exampleIL15RA,UBE2L6andGBP4which are all common to the IFN-anetwork. Future studies should extend this also to protein expression profiles to determine whether these
differences are also present at the protein level. This will allow further insights into their possible function during TB disease and
M.tbinfection, and help to better delineate new TB biomarker signatures.
Materials and Methods
Ethical Statement
This study was approved by the Ethical Committee of the Faculty of Medicine, University of Indonesia, Jakarta, and by the Eijkman Institute Research Ethics Committee, Jakarta, and written consent was voluntarily signed by all patients and control subjects [37].
Patient Recruitment
After informed consent, 23 new pulmonary tuberculosis patients above 15 years of age were recruited from an outpatient tuberculosis clinic in central Jakarta (Indonesia) [37]. Diagnosis of TB was performed according to the World Health Organization criteria, on the basis of the clinical presentation and a chest X-ray radiograph (CXR) and confirmed by sputum microscopy positive for mycobacteria using Ziehl-Nielsen stain. Free anti-TB drug
Table 6.Validation by qRT-PCR of 26 genes differentially expressed in all three models based on microarray analyses.
gene
Validated in longitudinal cohort TB patients
Validated in BCG-infected human macrophages
Validated inM.tb-infected lungs of mice
Direction of expression changea
BATF2 yes yes no up
C1QC yes no yes up
CCL2 no no no down
CCL7 no no no down
CD40 yes yes no up
CX3CR1 yes no yes up
CXCL10 no no no up
DDX58 yes yes no up
GBP4 yes yes yes up
IFIT2 no no no up
IFIT3 no no no up
IL15RA yes yes yes up
IL1A no no no Down
IMPA2 yes yes no Up
MEFV yes yes no Up
OAS1 yes yes no Up
OAS2 yes yes no Up
PBEF1 no no no Down
PIM1 yes yes no Up
SLAMF7 no no no Up
TLR5 yes yes no Up
TNFAIP2 yes yes no Up
TRAFD1 yes yes no Up
TRIM5 yes yes no Up
UBE2L6 yes yes yes Up
WARS no no no Up
17 genes 15 genes 5 genes
For successful validation, the direction for the fold-change in gene expression using qRT-PCR should be consistent with the microarray findings.
ain longitudinal cohort of TB patients.
treatment was provided to all patients and consisted of a standard regimen of isoniazid, rifampin, pyrazinamide and ethambutol (2HRZE, 4H3R3) for a total of 6 months according to the national TB program. Treatment was supervised once weekly by a directly observed treatment program.
Human immunodeficiency virus (HIV)-seropositive patients, diabetes mellitus affected patients, patients with heart diseases and patients with incomplete data records were excluded. 23 randomly selected control subjects with the same sex and age (+/210%) were recruited from neighboring households, with first degree relatives excluded. Controls with signs, symptoms and CXR results suggestive of active TB, a history of prior anti-TB treatment, diabetes mellitus or incomplete data entry were excluded. HIV status was not tested in control group. Indonesia is classified as a country with a low HIV prevalence of #0.1% during the sample period [38]. Patients’ self reported ethnicities
were recorded upon recruitment. A Javanese origin characterized three groups – the Jawa, Betawi and Sunda – and altogether comprised more than 80% of the total sample. The non-Javanese category included individuals born on other Indonesian islands.
RNA Extraction
Blood samples at three time points of disease spectrum (active phase: 0 weeks, treatment phase: 8 weeks and convalescent phase: 28 weeks) were obtained and collected in heparinized tubes. Peripheral blood mononuclear cells (PBMCs) were separated using a Ficoll density gradient, and kept frozen until use. Total RNA was extracted using the RNeasy Mini Kit (Qiagen, Germany) according to the manufacturer’s instructions, and subsequently subjected to DNAse treatment using RNAse free DNAse Set (Qiagen, Germany). RNA integrity was assessed by 1% agarose gel
Figure 6. Validating microarray data by qRT-PCR.Microarray results were validated by qRT-PCR. 17 genes from the 26 genes were found to be significantly different between TB patients with active disease and healthy controls, 15 genes from the 26 genes were found to be significantly different between live BCG-infected THP-1 cells at 20 hours compared to uninfected controls, and 5 genes from 26 genes were found to be significantly different between mice infected with active TB and mock infected mice, using student’s T test (P,0.05). Three genes which were common to all 3 models show similar levels of expression with both techniques applied. The fold increase for microarray technique (blue, orange and yellow) and qRT-PCR technique (light blue, light orange and light yellow) for patients, THP-1 cells and mice respectively. Microarray data (and their corresponding qRT-PCR data) that were not validated by qRT-PCR are not shown.
electrophoresis and samples of poor quality were excluded from analysis.
Mycobacterium bovis Bacillus Calmette Gue´rin (BCG) Infection of Differentiated THP-1 Macrophages
The human monocytic cell line THP-1 (ATCC, Rockville, MD) cells were cultured in RPMI 1640 supplemented with 10% FBS, penicillin (100 U/ml) and streptomycin (100mg/ml) (Invitrogen).
Cells were plated at a density of 106in 6-well tissue culture plates (Nunclon). Monocytes were allowed to adhere and differentiate into macrophages for 48 hours with 5 nM PMA (Sigma Aldrich) at 37uC in a humidified atmosphere of 5% CO2. Differentiated
macrophages were infected with BCG at an MOI of 5:1 and incubated at 37uC, 5% CO2. Infected cells at 4 hr post infection
were washed twice with RPMI without antibiotics to remove un-ingested and un-adhered bacteria to minimize cell death and re-incubated for a further 16 hours. The cells were washed once in 16distilled PBS before 350mL RTL buffer was added to lyse the
cells and RNA extraction was then carried out using the RNeasy Mini Kit (Qiagen, Germany), according to the manufacturer’s instructions.
C57BL/6 Mice Infected with Acute TB
C57BL/6Jbrc female mice (18–19 weeks old) were purchased from the Medical Research Centre (Biopolis, Singapore) from the specific pathogen free (SPF) facility. Mice were kept at the Novartis Institute for Tropical Diseases (NITD, Singapore) ABSL-3 facility for a week before the experiment. The experiment was approved by the Institute Animal Care and Use Committee of NITD. A total of eleven mice were used. Five mice were infected intravenously with 0.2 ml (approximately 106CFU) of M.tb
Erdman strain. Six mice served as mock infected controls. Briefly,M.tbErdman strain was grown in Dubos broth to the logarithmic stage. Bacteria were diluted in saline containing 0.05% Tween 80 for infection in mice. Mock infected mice were intravenously administered PBS containing 0.05% Tween 80. After four weeks, infected and control mice were sacrificed. Half of the lungs was immersed in saline containing 0.05% Tween 80 for homogenizing to determine the CFU (data not shown) and the other half was immersed in the RNA laterH stabilizer solution (AmbionH, USA) prior to preparing tissue lysate for extracting total RNA.
Figure 7. Ingenuity pathway analysis of the key genes identified.Ingenuity pathway analysis of the genes differentially regulated and common to the three systems described above (in orange). Network of genes in the interferon 1 signaling pathways that were found to be common in active TB patients, BCG-infected THP-1 cells at 20 hours and mice infected with active TB are illustrated. The lines in between genes represent known interactions, with solid lines representing direct interactions and dashed lines representing indirect interactions.
RNA Extraction from Mice Lungs
For preparation of tissue lysate, lung tissue immersed in the RNA laterHstabilizer solution (AmbionH, USA) was transferred to the lysing Matrix D tube of FastPrep system Pro Green Kit (Plants and Animals) (Qbiogen, Germany). Tissue lysate was then prepared according to the manufacturer’s instructions.
Total RNA was extracted from tissue lysate using the RNA Easy kit (Qiagen, Germany). Extracted RNA was subjected to DNAse treatment using RNAse free DNAse Set (Qiagen, Germany). Integrity of the RNA was assessed by 1% agarose gel electropho-resis and samples of poor quality were excluded from analysis.
Microarrays
Total RNA (250 ng) was amplified in a single round ofin vitro
transcription amplification that allowed incorporation of biotin-labelled nucleotides using the Illumina TotalPrep RNA amplifi-cation kit (Ambion, Austin, TX), according to the manufacturer’s instructions. cRNA (750 ng) of each sample was hybridized to an Illumina HumanRef-8 V3 BeadChip (containing probes to 24526 RefSeq gene sequences) at 58uC for 16 hours according to the manufacturer’s instructions (Illumina, Inc., San Diego, CA). This was followed by washing, blocking and streptavidin-Cy3 staining steps, followed by scanning with a high resolution Illumina bead array reader confocal scanner, according to the manufacturer’s instructions. For all arrays at the different time points, a rigorous quality check was carried out to ensure good performance before the array data was extracted. The data extraction was performed by using Illumina BeadStudio v3 software and uploaded into Genespring GX10 (Silicon Genetics, Redwood City, CA) software for downstream analysis.
Array Normalization
The standard normalization procedures recommended by Genespring software for one-colour array were followed. Data transformation was corrected for a low signal, with values recorded at ,0.01 increased to the minimum (0.01). Chip variability was accounted for using per-chip normalization by dividing all of the measurements on each chip by a 75thpercentile value. Probe set variability for different genes were accounted for using per-gene normalization by dividing all genes by the median of all genes. Analysis was restricted to probe sets for which a detection level of 0.9899 was obtained in at least 50% of arrays in at least one condition stated. Following quality control of probes, statistical analysis, hierarchical clustering and functional classification were performed.
Selection of Differentially Expressed Genes from Microarray Data
Differentially expressed genes were selected from the normal-ized data by using a procedure known as significance analysis of microarrays (SAM) [39] as installed on Genespring GX10. The statistic in SAM is given as d = (u12u2)/(s2s0), where the
numerator is the group mean difference, s is the standard error and s0 is a regularizing constant. Setting s0= 0 will yield a
t-statistic. This value, called the fudge constant, is found by removing the trend in d as a function of s in moving windows across the data to reduce false positive results. Since the statistic is not t-distributed, significance is computed using a permutation test. Genes with computed statistic larger than the threshold are called significant. 1000 permutations were conducted and a threshold false discovery rate (FDR) of 0.05 set to determine the differentially expressed genes which were significant, and subse-quently subjected to filtering through fold change of 2 or greater.
Clustering using Self Organizing Map (SOM) function was used to group genes with different gene expression profiles, with Euclidean distance metric, a maximum iterations of 50, grid rows of 3 by 4, initial learning rate of 0.03, initial neighborhood radius of 5, neighborhood bubble type, with a hexagonal grid topology.
Gene Ontology Clustering
The PANTHER (www.pantherdb.org) online gene expression analysis system was used to group significantly overrepresented genes into functional relationships. Similarly, the Ingenuity Pathway Analysis (IPA; www.ingenuity.com) was also used to classify differentially expressed genes into functional relationships and further show canonical pathways and networks involving these genes, with nodes defining potentially critical host mediators of infection. The canonical pathways are described in the library of the Ingenuity Pathways knowledge base and are based on well-known established textbook literature where molecular links are known. The networks are built from a compilation of literature searches. Connecting lines between nodes represent one or more publications which imply a direct or indirect connection between the genes. The Ingenuity program is updated monthly to reflect new publications.
For canonical pathways, the significance of the association was measured in two ways: (i) by the ratio of the number of genes from the data set that map to the pathway divided by the total number of genes in that pathway and (ii) by using the Benjamin-Hochberg multiple corrected p-value to obtain a p-value determining the probability that the association between the genes in the data set and the canonical pathway is explained by chance alone, correcting for multiple testing of the same genes against different canonical pathways.
Network-wise, IPA computes a score for each network related to the fit of the input set of differentially expressed genes. The score is obtained from the likelihood that the focus genes in a network are together due to chance alone, with a score of 2 being equivalent to a p-value of 0.01.
Quantitative RT-PCR (qRT-PCR) by Fluidigm System
Using the extracted RNA from the three systems above, 100 ng of total RNA was reverse transcribed using the High-Capacity cDNA Kit for 1000 reactions (ABI, USA), and processed for the 48.48 Fluidigm Microfluidic Chips, according to the manufactur-er’s instructions, together with data analysis using the Biomark qRT-PCR analysis and Biomark Melting Curve analysis software (Fluidigm, USA). We normalized the qRT-PCR data in relation to a reference gene expression quantitation using the gene 18S, according to well established procedures. The RNA samples used for PCR were the same as those used for the microarray.
Microarray Statistical Analysis
For microarray analysis, the Illumina HumanRef-8 V3 BeadChip was utilized, containing more than 24,000 genes. For the initial analysis, the T-test with Benjamin-Hochberg procedure was used to determine differentially expressed genes from the normalized data in any one condition from the controls (see Materials and Methods). Analysis of variance (ANOVA) was used to determine differentially expressed genes across patient groups.
Acknowledgments
Author Contributions
Conceived and designed the experiments: THMO ES BA RvC MS EvdV MLH. Performed the experiments: RHD NY MZ HEEW ES CCK BA.
Analyzed the data: THMO ES MS EvdV MLH. Contributed reagents/ materials/analysis tools: RvC BA ES SM MS MLH. Wrote the paper: THMO RvC MS EvdV MLH.
References
1. Raviglione MC (2003) The TB epidemic from 1992 to 2002. Tuberculosis 83: 4– 14.
2. Schuck SD, Mueller H, Kunitz F, Neher A, Hoffmann H, et al. (2009) Identification of T-Cell Antigens Specific for LatentMycobacterium Tuberculosis Infection. PLoS ONE 4: e5590.
3. Ottenhoff TH, Kaufmann SH (2012) Vaccines against tuberculosis: where are we and where do we need to go? PLoS Pathog 8: e1002607.
4. Ottenhoff TH, Ellner JJ, Kaufmann SH (2012) Ten challenges for TB biomarkers. Tuberculosis (Edinb ) 92 Suppl 1: S17–S20.
5. van de Vosse E, van Dissel JT, Ottenhoff TH (2009) Genetic deficiencies of innate immune signaling in human infectious disease. Lancet Infect Dis 9: 688– 698.
6. de Jong R, Altare F, Haagen IA, Elferink DG, Boer T, et al. (1998) Severe mycobacterial and Salmonella infections in interleukin-12 receptor-deficient patients. Science 280: 1435–1438.
7. Levin M, Newport M (2000) Inherited predisposition to mycobacterial infection: historical considerations. Microbes Infect 2: 1549–1552.
8. Ottenhoff THM (2012) New pathways of protective and pathological host defense to mycobacteria. Trends Microbiol 2012 (9 July Epub ahead of print). 9. Mistry R, Cliff JM, Clayton CL, Beyers N, Mohamed YS, et al. (2007) Gene-Expression Patterns in Whole Blood Identify Subjects at Risk for Recurrent Tuberculosis. J Infect Dis 195: 357–365.
10. Jacobsen M, Repsilber D, Gutschmidt A, Neher A, Feldmann K, et al. (2007) Candidate biomarkers for discrimination between infection and disease caused by Mycobacterium tuberculosis. J Mol Med 85: 613–621.
11. Joosten SA, Goeman JJ, Sutherland JS, Opmeer L, de Boer KG, et al. (2011) Identification of biomarkers for tuberculosis disease using a novel dual-color RT-MLPA assay. Genes Immun 13: 71–82.
12. Maertzdorf J, Repsilber D, Parida SK, Stanley K, Roberts T, et al. (2011) Human gene expression profiles of susceptibility and resistance in tuberculosis. Genes Immun 12: 15–22.
13. Maertzdorf J, Ota M, Repsilber D, Mollenkopf HJ, Weiner J, et al. (2011) Functional correlations of pathogenesis-driven gene expression signatures in tuberculosis. PLoS ONE 6: e26938.
14. Lesho E, Forestiero FJ, Hirata MH, Hirata RD, Cecon L, et al. (2011) Transcriptional responses of host peripheral blood cells to tuberculosis infection. Tuberculosis (Edinb ) 91: 390–399.
15. Berry MP, Graham CM, McNab FW, Xu Z, Bloch SA, et al. (2010) An interferon-inducible neutrophil-driven blood transcriptional signature in human tuberculosis. Nature 466: 973–977.
16. Maertzdorf J, Weiner J, Mollenkopf HJ, TBornotTB Network, Bauer T, et al. (2012) Common patterns and disease-related signatures in tuberculosis and sarcoidosis. Proc Natl Acad Sci U S A 109: 7853–7858.
17. Abebe M, Doherty TM, Wassie L, Aseffa A, Bobosha K, et al. (2010) Expression of apoptosis-related genes in an Ethiopian cohort study correlates with tuberculosis clinical status. Eur J Immunol 40: 291–301.
18. Schafer G, Guler R, Murray G, Brombacher F, Brown GD (2009) The Role of Scavenger Receptor B1 in Infection withMycobacterium tuberculosisin a Murine Model. PLoS ONE 4: e8448.
19. Dharmadhikari AS, Nardell EA (2008) What Animal Models Teach Humans about Tuberculosis. Am J Respir Cell Mol Biol 39: 503–508.
20. Ottenhoff TH, Verreck FA, Lichtenauer-Kaligis EG, Hoeve MA, Sanal O, et al. (2002) Genetics, cytokines and human infectious disease: lessons from weakly pathogenic mycobacteria and salmonellae. Nat Genet 32: 97–105.
21. Korbel DS, Schneider BE, Schaible UE (2008) Innate immunity in tuberculosis: myths and truth. Microbes Infect 10: 995–1004.
22. van de Wetering D, van Wengen A, Savage ND, van de Vosse E, van Dissel JT (2011) IFN-acannot substitute lack of IFN-cresponsiveness in cells of an IFN-cR1 deficient patient. Clin Immunol 138: 282–290.
23. Kuchtey J, Fulton SA, Reba SM, Harding CV, Boom WH (2006) Interferon-ab mediates partial control of early pulmonaryMycobacterium bovisbacillus Calmette-Gue´rin infection. Immunology 118: 39–49.
24. Desvignes L, Wolf AJ, Ernst JD (2012) Dynamic roles of type I and type II IFNs in early infection withMycobacterium tuberculosis. J Immunol 188: 6205–6215. 25. de Paus RA, van Wengen A, Schmidt I, Visser M, Verdegaal EME, et al. (2012)
Inhibition of the type I immune responses of human monocytes by IFN-aand IFN-b. submitted.
26. Sinai AP, Joiner KA (1997) Safe Haven: The Cell Biology of Nonfusogenic Pathogen Vacuoles. Annu Rev Microbiol 51: 415–462.
27. Gutierrez MG, Master SS, Singh SB, Taylor GA, Colombo MI, et al. (2004) Autophagy is a defense mechanism inhibiting BCG andMycobacterium tuberculosis survival in infected macrophages. Cell 119: 753–766.
28. Petruccioli E, Romagnoli A, Corazzari M, Coccia EM, Butera O, et al. (2012) Specific T cells restore the autophagic flux inhibited byMycobacterium tuberculosis in human primary macrophages. J Infect Dis 205: 1425–1435.
29. Davila S, Hibberd ML, Hari Dass R, Wong HE, Sahiratmadja E, et al. (2008) Genetic association and expression studies indicate a role of Toll-Like Receptor 8 in pulmonary tuberculosis. PLoS Genet 4: e1000218.
30. Wong RL, Liu B, Zhu X, You L, Kong L, et al. (2011) Interleukin-15:Interleukin-15 receptor a scaffold for creation of multivalent targeted immune molecules. Protein Eng Des Sel 24: 373–383.
31. Mortier E, Advincula R, Kim L, Chmura S, Barrera J, et al. (2009) Macrophage- and Dendritic-Cell-Derived Interleukin-15 Receptor Alpha Supports Homeostasis of Distinct CD8+T Cell Subsets. Immunity 31: 811–822. 32. Oshiumi H, Miyashita M, Inoue N, Okabe M, Matsumoto M, et al. (2010) The Ubiquitin Ligase Riplet Is Essential for RIG-I-Dependent Innate Immune Responses to RNA Virus Infection. Cell Host Microbe 8: 496–509. 33. Arimoto Ki, Takahashi H, Hishiki T, Konishi H, Fujita T, et al. (2007) Negative
regulation of the RIG-I signaling by the ubiquitin ligase RNF125. Proc Natl Acad Sci USA 104: 7500–7505.
34. Zhao C, Beaudenon SL, Kelley ML, Waddell MB, Yuan W, et al. (2004) The UbcH8 ubiquitin E2 enzyme is also the E2 enzyme for ISG15, an IFN- a/b-induced ubiquitin-like protein. Proc Natl Acad Sci USA 101: 7578–7582. 35. Jeon YJ, Choi JS, Lee JY, Yu KR, Kim SM, et al. (2009) ISG15 modification of
filamin B negatively regulates the type I interferon-induced JNK signalling pathway. EMBO Rep 10: 374–380.
36. Decker T, Lew DJ, Darnell JE (1991) Two distinct alpha-interferon-dependent signal transduction pathways may contribute to activation of transcription of the guanylate-binding protein gene. Mol Cell Biol 11: 5147–5153.
37. Sahiratmadja E, Alisjahbana B, de Boer T, Adnan I, Maya A, et al. (2007) Dynamic changes in pro- and anti-inflammatory cytokine profiles (IFN-c, TNF-a, IL-12/23, and IL-10) and IFN-creceptor signalling integrity correlate with tuberculosis disease activity and response to curative treatment. Infect Immun 75: 820–829.
38. WHO (2012) Global Health Observatory Data Repository. Available at: http:// apps.who.int/ghodata/(last accessed August 2012).