*Correspondence: A. T. Vooss, Universidade Regional Integrada do Alto Uruguai e das Missões, Av. Sete de Setembro, 1621, 99700-000 - Erechim – RS, Brasil. E-mail: [email protected]
A
rti
Pharmaceutical Sciences vol. 47, n. 2, apr./jun., 2011
Evaluation of prescription indicators established by the WHO in
Getúlio Vargas – RS
Andressa Tanise Vooss
1*, Helissara Silveira Diefenthaeler
11Regional Integrated University of Alto Uruguai and Missões (URI), Erechim Campus, Rio Grande do Sul
To evaluate the conditions of the services offered to the community regarding medications, the World Health Organization (WHO) has developed the Medication Use Indicators, among them Prescription indicators. The objective of this study was to evaluate drug prescriptions in a Basic Health Care Center in Getúlio Vargas – RS, according to the Prescription Indicators recommended by the WHO. The data collection was performed with the use of a form and the prescriptions for June / July and November / December 2008 were evaluated. The average number of drugs prescribed was 2.03, and 72.8% of the drugs were prescribed by generic name, 80.3% were on the list of essential drugs, 21.7% were antibiotics and 2.4% were injectable drugs. The results were in accordance with WHO recommendations and were similar to those reported by other studies.
Uniterms: Medications/rational use. Medications/prescription indicators. World Health Organization/ medication use indicators.
Para avaliar as condições dos serviços prestados à população no que se refere aos medicamentos, a Organização Mundial da Saúde (OMS) desenvolveu Indicadores do uso de Medicamentos, entre eles os de Prescrição. O objetivo da pesquisa foi avaliar prescrições medicamentosas de usuários de uma Unidade Básica de Saúde do município de Getúlio Vargas – RS conforme os Indicadores de Prescrição preconizados pela OMS. A coleta de dados foi realizada com uma icha. Para isso houve acesso as prescrições atendidas no período de junho/julho e de novembro/dezembro de 2008. A média de medicamentos prescritos foi de 2,03, 72,8% dos medicamentos foram prescritos pelo nome genérico, 80,3% constavam na lista dos medicamentos essenciais, 21,7% eram antibióticos e 2,4% injetáveis. Observou-se que os resultados obtidos estão de acordo com os recomendados pela OMS e que foram similares a outros estudos.
Unitermos: Medicamentos/uso racional. Medicamentos/indicadores de Prescrição. Organização Mundial da Saúde/indicadores do uso de medicamentos.
INTRODUCTION
The rational use of medications is a worldwide concern, and is therefore prominent among heath care professionals. Concerted efforts to readjust pharmaceu-tical actions and practices aiming at the rational use of medication are essential in today’s society, in which drugs are the most used therapeutic resource. Aiming to evaluate the conditions of the services offered to the population concerning medication, the World Health
Organization (WHO) developed Medication Use In-dicators, including Prescription Indicators (Bernardi, Bieberbach, Thomé, 2006).
Prescription Indicators allow the therapeutic actions taken in similar institutions to be ascertained, enabling subsequent comparison of parameters between them, and to evaluate the population’s medication needs and determine the most frequently used medications in a given place (Farias et al., 2007). In addition, these indicators allow identiication of the prescription proile and quality of services offered to the population.
Medication average per medical prescription
Through this indicator it is possible to investiga-te polymedication, a major factor contributing to drug interactions and adverse reactions. The educational and informational level of the person prescribing the medi-cation may also be observed (Oliveira et al., 2009; Farias et al., 2007; Carmo, Nitrini, 2004; Santos, Nitrini, 2004; Bontempo et al., 2003; Cunha, Zorzatto, Castro, 2002).
Percentage of medication prescribed with generic name
This indicator allows the calculation of the number of prescriptions in which the drugs are prescribed with the generic name, as determined by the current National Drug Policy (NDP) of October 1998. Thus, it is possible to control drug costs in the health service, due to the fact that the drugs of general references are more expensive. Also, it evaluates the marketing inluence on the person prescribing drugs (Oliveira et al., 2009; Farias et al., 2007; Carmo, Nitrini, 2004; Santos, Nitrini, 2004; Bontempo et al., 2003; Cunha, Zorzatto, Castro, 2002).
Percentage of prescribed drugs from list of essential drugs
Besides controlling costs, the essential drugs list guarantees the treatment of the principal diseases of the population.
Percentage of prescribed antibiotics
This indicator aims to evaluate the use of antibiotics in excess, a practice which contributes to bacterial dis-semination and resistance. (Oliveira et al., 2009; Farias et al., 2007; Carmo, Nitrini, 2004; Santos, Nitrini, 2004; Bontempo et al., 2003).
Percentage of prescribed injectable drugs
This indicator aims to evaluate the injectables in excess because their administration may have serious consequences when prescribed or applied wrongly, such as dificulty for case reversion in the event of anaphylactic reactions, adverse reactions, iber necrosis, etc. (Oliveira et al., 2009; Farias et al., 2007; Carmo, Nitrini, 2004; Santos, Nitrini, 2004).
With these indicators, it is possible to swiftly and safely evaluate the attention given to health, but these in-dicators do not quantify all the important aspects of drug use (Carmo, Farhat, Alves, 2003).
Studies applying the WHO Prescription Indica-tors have been conducted in many cities in Brazil. This has enabled evaluation of the conditions of the offered services concerning medication and also allowed com-parison and identiication of differences in the regions. In many studies, the authors found good results regarding the Prescription Indicators, possibly as a consequence of the National Drug Policy and the holding of the Drugs and Pharmaceutical Assistance City conference (Farias et al., 2007). Nevertheless, the Prescription Indicators of many cities are still needed in order to compare the Pharmaceuti-cal Assistance services among them.
The aim of this study was to evaluate the Prescrip-tion Indicators approved by the WHO in a Health Care Center in Getúlio Vargas –RS. This town has about 16,506 inhabitants and ive Health Care Centers, which provide completely free medication distribution through a health assistance program of the government (Getúlio Vargas, 2009).
MATERIAL AND METHODS
A transversal study design was used and the sample comprised all the medication prescriptions made out at a Health Care Center drugstore in Getúlio Vargas - RS.
As the South of Brazil has a colder and more intense winter in comparison to other regions of the country, disea-ses such as respiratory illnesdisea-ses are more often seen in this season. Thus, a higher percentage of drug prescriptions is expected, particularly injectables and those containing antibiotics. Aiming to compare the differences between the Prescription Indicators, it was chosen to evaluate prescriptions of two seasonal periods. Therefore, the data was collected from prescriptions in June and July, 2008, which were the winter prescriptions, and in November and December, 2008, which were the summer prescriptions.
The data collection was done using a tailored form. For this collection, the prescriptions made out during the speciied period were assessed and therefore patients were not questioned.
The variables of interest in this study were: number of medications in each prescription, percentage of pres-cribed drugs with generic name, percentage of prespres-cribed drugs on the list of the City’s essential medications, per-centage of prescribed antibiotics and injectables.
This research was approved by the Regional Integra-da doAlto Uruguai e Integra-das Missões – URI Campus de Ere-chim University Research Ethical Committee in EreEre-chim, RS, under registration number 176/TCH/08.
RESULTS
In this study, 1,030 prescriptions were analyzed from a total of 2,090 medical prescriptions and average number of medications per prescription was 2.03. Table I shows the number of medications in each prescription.
The prescription of 189 different medications was observed, the most frequent being diclofenac sodium and acetaminofen, both corresponding to 36.5% of the total. Other most frequently prescribed medications are shown in Table II.
The more prevalent therapeutic categories included analgesics (22.2%), anti-inlammatory (14.3%) anti-ulcer (9.9%) and antibiotics (7.3%).
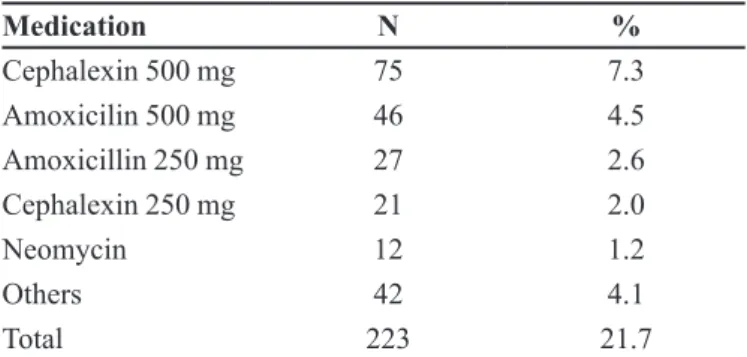
The percentage of medications prescribed with the generic name was 72.8% and the percentage of prescribed medications appearing in the list of essential medication was 80.3%. Antibiotics were prescribed in 21.7% of the prescriptions, and the prevalent antibiotics are shown in Table III.
Only 25 prescriptions (2.4%), had injectables pres-cribed and no more than one injectable was prespres-cribed in each prescription. The predominant injectables are shown in the Table IV.
Table V shows the differences found in prescriptions corresponding to the months of winter and summer.
DISCUSSION
A total of 1,030 prescriptions were studied most of which had only one medication prescribed (47.4%). However, there were 4 prescriptions (0.6%) in which more than 6 medications were prescribed according to
TABLE I - Number of medication in each prescription
Number of medications N (prescriptions) %
1 488 47.4
2 236 22.9
3 164 15.9
4 97 9.4
5 30 2.9
6 11 1.1
7 1 0.1
8 1 0.1
9 1 0.1
10 1 0.1
Total 1030 100.0
TABLE II - Medications most frequently prescribed
Medication N %
Diclofenac sodium 50 mg 147 14.3
Acetaminofen 500 mg 120 11.7
Acetaminofen 200 mg/mL 108 10.5
Omeprazole 20 mg 95 8.9
Cephalexin 500 mg 75 7.3
Others 489 47.3
Total 1030 100
TABLE III - Prevalent Antibiotics
Medication N %
Cephalexin 500 mg 75 7.3
Amoxicilin 500 mg 46 4.5
Amoxicillin 250 mg 27 2.6
Cephalexin 250 mg 21 2.0
Neomycin 12 1.2
Others 42 4.1
Total 223 21.7
TABLE IV - Predominant injectables
Medication N %
Benzilpeniciliin benzathine 5 0.5
Medroxyprogesterone 150 mg 4 0.4
Piroxicam 40 mg 4 0.4
Meloxicam 15 mg 3 0.3
*Hydroxocobalamin/Dexamethasone/Dipyrone 2 0.2
Others 7 0.6
Total 25 2.4
Table I. Similarly, in the study of Oliveira et al. (2009) it was observed that most prescriptions also had only one medication prescribed. However, in the Ev, Guimarães and Castro (2008) study, 34.27% of the prescriptions had one medication prescribed and 34.37% had 2 medication prescribed, thus differing from the present study.
The average number of medications in each pres-cription was 2.03 and this is in accordance with the WHO’s recommendation, which is 2 or less. We can conclude that there were no problems of polymedication and ad-verse reactions because the average medication in each prescription in this study was in accordance with WHO recommendations.
The medications most often prescribed in this study are shown in Table II. The study by Colombo et al. (2004), as did this study, found diclofenac and acetaminofen to be the most often prescribed, both corresponding to 22.6%. Other studies report these results by pharmacologic groups, where the more often prescribed medications are those for the respiratory and nervous system. (Girotto, Silva, 2006; Naves, Silver, 2005; Felício, 2007; Farias et al., 2007). We observed in this study that the prevalent therapeutic categories are compatible with the medications most often prescribed: analgesics (22.2%) anti inlam-matory (14.3%), anti tuberculosis (8.9%) and antibiotics (7.3%) and the difference between the prevalent pharma-cologic categories in this, and the other studies cited, is clear, which may be attributed to the differences among the regions where the research was carried out and the pathologies that appeared in the population.
The percentage of medications prescribed with the generic name was 72.8% where the WHO establishes this at 100%. This low percentage of prescribed medications with the generic name may be explained because of the high investment of the pharmaceutical industry in adverti-sing their medications and this may inluence prescribers. Moreover, we should point out that some medications appear in the local list under their commercial name, which
may deter professionals from using the generic name. A total of 80.3% of the prescribed medications were from the list of the essentials medications which is in compliance with the percentage recommended by the WHO of 70%. This indicator reveals that the standardized medications are being prescribed and are also covering most of the pathologies of the patients treated at the studied health care center. Thus, it can be assumed that essential medications are accessible to the population.
Antibiotics were prescribed in 21.7% of the pres-criptions and the most prevalent antibiotics are shown in Table III. The problem with antibiotics use is the bacterial resistance caused when there is inappropriate or excessive use. The indicator result is above the level approved by the WHO, which is 20% or less, but the igure found does not constitute excessive prescription.
Injectable medications were prescribed in 2.4% of the analyzed prescriptions and the predominant injectables are shown in Table IV. The WHO establishes the prescrip-tion of 10% injectables, and the percentage found in this study fell below this level. As observed in Table V, the prescription of injectables in the Winter was almost double (40%), compared with the Summer, and this inding is in accordance with Farias et al. (2007) study in which the percentage of injectables was 1.1% where this low per-centage was attributed to the hot season of the year. Other hypotheses for the low prescription of injectables may be because they appear in low quantities and varieties in the city’s list of essential medications.
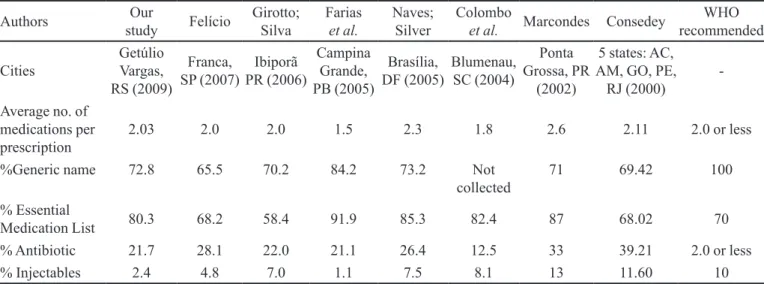
Although the prescription percentage of antibiotics and injectable drugs was found to be higher in the Winter, this difference was not signiicant (P>0.05). This result may suggest that there were no changes in the pattern of morbidity which justify a signiicant increase in the pres-cription of these drugs in the Winter. However, the morbi-dity epidemiologic data was not collected for comparison. Table VI provides a comparison between this study and other studies and reveals that the result for Prescrip-tions Indicators are similar among the different Brazilian cities, and bar some exceptions, all the studies were in accordance with the WHO’s recommendations.
CONCLUSION
This study showed that in the Health Care Center of Getúlio Vargas – RS, where the study was carried out, most of the indicators analyzed were in accordance with the WHO’s recommendations, except the percentage of medications prescribed with the generic name and the percentage of injectables. However, these two indicators were in line with other studies performed in different
TABLE V - Differences observed in prescriptions corresponding
to Winter and Summer
Winter Summer
Number of prescriptions 534 496
Average no. of medications in each
prescription 2.12 1.95
% Generic name 72.0 73.6
% Essential medication list 80.0 80.4
% Antibiotics 23.4 19.8
Brazilian cities, which also showed good results compared with the WHO recommendations and with other health care centers analyzed.
To adjust the percentage indicator of the prescribed medications with the generic name, prescribers must be aware of this and principally that the medications in the city’s essential medications list appear under their generic name in accordance with the NPD, whereas the commer-cial name is used in current lists.
These results allow the conclusion that through studies using the Prescription Indicators recommended by the WHO, it is possible to evaluate the conditions of the offered services concerning medications and also to compare and identify differences among regions. Thus, it can be asserted that the Prescription Indicators can help the Heath Care Centers to obtain better organization and improve healthcare attention to the public.
REFERENCES
BERNARDI, C.L.B.;BIEBERBACH, E.W.; THOMÉ,
H.I.Avaliação da Assistência Farmacêutica Básica nos
Municípios de Abrangência da 17ªCoordenadoria Regional
de Saúde do Rio Grande do Sul. Saúde Soc. São Paulo, v.15,
n.1, p.73-83, 2006.
BONTEMPO, V.L.;COELHO, M.C.; CHAVES, J.G.;
PEREIRA, L.A.M.; ANDRADE, W.W.; BRACCINI, C.M. Análise das prescrições geradas pelas equipes do PSF e das Unidades de Atendimento Imediato, em dois distritos
sanitários do município de Contagem/MG. Bol. Pneumol.
Sanit., v.11, n.2, p.17-24, 2003.
BRASIL. Portaria nº 3916, de 30 de outubro de 1998. Aprova a Política Nacional de Medicamentos, cuja íntegra consta
do anexo desta Portaria. Diário Oicial da União, Brasília,
DF, 10 nov. 1998. Available at: < http://e-legis.anvisa.gov. br/leisref/public/showAct.php?id=751> Accessed on: 20 may 2009.
CARMO, T.A.; FARHAT, F.C.L.G.; ALVES, J.M. Indicadores de Prescrições Medicamentosas: ferramentas para
intervenção. Saúde Rev., v.5, n.11, p.49-55, 2003.
CARMO, T.A.; NITRINI, S.M.O.O. Prescrições de medicamentos
para gestantes: um estudo farmacoepidemiológico. Cad.
Saúde Pública, v.20, n.4, p.1004-1013, 2004.
CENTRO BRASILEIRO DE INFORMAÇÃO SOBRE MEDICAMENTOS (CEBRIM). Promovendo o uso
racional dos medicamentos: principais componentes. Bol.
Farmacoterapêutica, v.8, n.1, p.38-43, 2003.
COLOMBO, D.; HELENA, E.T.S.; AGOSTINHO, A.C.M.G; DIDJURGEIT, J.S.M.A. Padrão de Prescrição de Medicamentos nas Unidades de Programa de Saúde da
Família de Blumenau. Rev. Bras. Ciênc. Farm., v.40, n.4,
p.549-558, 2004.
COSENDEY M.A.E. Análise da implantação do Programa
Farmácia Básica: um estudo multicêntrico em cinco estados do Brasil. Rio de Janeiro, 2000. 366 f. [Thesis of PhD degree in Public Health. Oswaldo Cruz Foundation/ National School of Public Health].
TABLE VI - Comparison between studies conducted in different cities of Brazil
Authors study Our Felício Girotto; Silva Fariaset al. Naves; Silver Colomboet al. Marcondes Consedey recommendedWHO
Cities Getúlio Vargas,
RS (2009)
Franca,
SP (2007) PR (2006)Ibiporã
Campina Grande, PB (2005)
Brasília,
DF (2005) Blumenau, SC (2004)
Ponta Grossa, PR
(2002)
5 states: AC, AM, GO, PE,
RJ (2000)
-Average no. of medications per
prescription 2.03 2.0 2.0 1.5 2.3 1.8 2.6 2.11 2.0 or less
%Generic name 72.8 65.5 70.2 84.2 73.2 Not
collected 71 69.42 100
% Essential
Medication List 80.3 68.2 58.4 91.9 85.3 82.4 87 68.02 70
% Antibiotic 21.7 28.1 22.0 21.1 26.4 12.5 33 39.21 2.0 or less
CUNHA, M.C.N.; ZORZATTO, J.R.; CASTRO,L.L.C. Avaliação do uso de medicamentos na Rede Pública
Municipal de Saúde de Campo Grande/MS. Rev. Bras.
Ciênc. Farm., v.38, n.2, p.215-227, 2002.
EV, L.S.; GUIMARÃES, A.G.; CASTRO, V.S. Avaliação das prescrições dispensadas em uma Unidade Básica de Saúde
do Município de Ouro Preto, Minas Gerais, Brasil. Lat. Am.
J. Pharm., v.27, n.4, p.543-547, 2008.
FARIAS, A.D.; CARDOSO, M.A.A.; MEDEIROS, A.C.D.; BELÉM, L.F; SIMÕES, M.O.S. Indicadores de prescrição médica nas unidades básicas de Saúde da Família no
município de Campina Grande, PB. Rev. Bras. Epidemiol.,
v.10, n.2, p.149-156, 2007.
FELICIO, N. Farmacoepidemiologia da prescrição e
dispensação de medicamentos na rede pública municipal de saúde de Patos de Minas/MG Franca. Franca, 2007. 117 f. [Dissertação de Mestrado em Promoção de Saúde. Universidade de Franca].
GETÚLIO VARGAS. Geograia. Available at: <http://www.
pmgv.rs.gov.br/geograia. html> Accessed on: 01 jun. 2009.
GIROTTO, E.; SILVA, P.V. A prescrição de medicamentos em
um município do Norte do Paraná. Rev. Bras. Epidemiol.,
v.9, n.2, p.226-234, jun. 2006.
MARCONDES, N.S.P. A Assistência Farmacêutica e o uso
de medicamentos na zona urbana do Município de Ponta Grossa Paraná: estudo de caso. Rio de Janeiro,2002. 170 f.
[Dissertação de Mestrado em Saúde Pública.Universidade
Estadual de Ponta Grossa/Fundação Oswaldo Cruz].
NAVES, J.O.S.; SILVER L.D. Evaluation of pharmaceutical
assistance in public primary care in Brasília, Brazil. Rev.
Saúde Pública, v.39, n.2, p.223-230, 2005.
OLIVEIRA, C.A.P.; MARIN, M.J.S.; MARCHIOLI, M.; PIZOLETTO, B.H.M.; SANTOS, R.V. Caracterização dos medicamentos prescritos aos idosos na Estratégia Saúde da
Família. Cad. Saúde Pública, v.25, n.5, p.1007-1016, 2009.
SANTOS, V.; NITRINI, S.M.O.O. Indicadores do uso de medicamentos prescritos e de assistência ao paciente de
serviços de saúde. Rev. Saúde Pública, v.38, n.6,
p.819-826, 2004.
Received for publication on 03rd August 2010