*Correspondence: A. A.-W. Shahba. Kayyali Chair for Pharmaceutical Industries. Department of Pharmaceutics, PO BOX-2457. College of Phar-macy, King Saud University. Riyadh - 11451, Kingdom of Saudi Arabia. Tel: +966114676228, ext. 108 / Fax: +966114676295. E-mail: [email protected]
A
r
vol. 52, n. 4, oct./dec., 2016 http://dx.doi.org/10.1590/S1984-82502016000400009
Optimization of self-nanoemulsifying formulations for weakly
basic lipophilic drugs: role of acidification and experimental design
Ahmad Abdul-Wahhab Shahba
1*, Kazi Mohsin
1, Fars Kaed Alanazi
1, Sayed Ibrahim
Abdel-Rahman
21 Kayyali Chair for Pharmaceutical Industries, Department of Pharmaceutics, College of Pharmacy, King Saud University, Riyadh, Kingdom of Saudi Arabia, 2 Department of Industrial Pharmacy, College of Pharmacy, Assiut University, Assiut, Egypt
Formulators face great challenges in adopting systematic approaches for designing self-nanoemulsifying formulations (SNEFs) for diferent drug categories. In this study, we aimed to build-up an advanced SNEF development framework for weakly basic lipophilic drugs, such as cinnarizine (CN). First, the inluence of formulation acidiication on CN solubility was investigated. Second, formulation self-emulsiication in media with diferent pH was assessed. Experimentally designed phase diagrams were also utilized for advanced optimization of CN-SNEF. Finally, the optimized formulation was examined using cross polarizing light microscopy for the presence of liquid crystals. CN solubility was signiicantly enhanced upon external and internal acidiication. Among the various fatty acids, oleic acid-based formulations showed superior self-emulsiication in all the tested media. Surprisingly, formulation turbidity and droplet size signiicantly decreased upon equilibration with CN. The design was validated using oleic acid/ Imwitor308/Cremophor El (25/25/50), which showed excellent self-nanoemulsiication, 43-nm droplet size (for CN-equilibrated formulations), and 88 mg/g CN solubility. In contrast to CN-free formulations, CN-loaded SNEF presented lamellar liquid crystals upon 50% aqueous dilution. These indings conirmed that CN-SNEF eiciency was greatly enhanced upon drug incorporation. The adopted strategy ofers fast and accurate development of SNEFs and could be extrapolated for other weakly basic lipophilic drugs.
Uniterms: Self-nanoemulsifying formulations/solubility. Cinnarizine/lipophilic drugs. Acidiication/ experimental design. Solubility enhancement.
INTRODUCTION
As a result of modern drug discovery practices,
there has been a consistent rise in the number of newly
discovered chemical entities that are considered poorly
water-soluble drugs (PWSDs). Owing to their poor dissolution, these PWSDs often present low and erratic
bioavailabilities. Pharmaceutical experts are therefore facing great challenges in formulating these entities
into oral dosage forms with adequate bioavailability (Dahan, Hofman, 2008). Among the various lipid-based
formulations, self-nanoemulsifying formulations (SNEFs) represent one of the most promising candidates in terms of enhancing the in-vivo performance of orally administered PWSD (Bahloul et al., 2015). Compared with other drug
delivery systems, SNEFs ofer great advantages, including
ease of manufacture and scaling-up, improved physical
stability, and maximized drug entrapment capacity. Upon
introduction to physiological media, no dissolution step
would be required owing to the formation of a nano-droplet size emulsion. This facilitates a higher rate and
extent of absorption and therefore high and reproducible bioavailability values (Balakumar et al., 2013; Gupta, Kesarla, Omri, 2013).
Current development approaches in the SNEF area are mostly empirical and consume large amounts
of time and money (Dahan, Hofman, 2008; Bahloul et al., 2015). SNEFs are commonly developed using the
“trial and error approach” which involves changing one
parameter at a time or the conventional “ternary phase
diagrams” technique. These two methods require several
experiments, hence resulting in high cost and long development periods (Bahloul, Lassoued, Sfar, 2014). In
owing to inadequate testing conditions, as further mentioned in the “self-emulsiication assessment section”
of the current study. Many other limitations still restrict the potential usage of SNEFs, including the lack of predictive
in-vitro tests, insufficient in-vivo drug precipitation studies, and lack of in vitro–in vivo correlations (IVIVC) (Bahloul et al., 2015). SNEF optimization for each drug
is not an easy process. Only very specific excipient
combinations will produce eicient self-nanoemulsifying systems. This could be conirmed by the vast amount of
research performed in this area leading to only limited numbers of SNEF products in the pharmaceutical market
(Gursoy, Benita, 2004; Elnaggar, El-Massik, Abdallah, 2009; Bahloul et al., 2015).
Therefore, regarding in-vitro prospects, there is a need for an advanced approach to accelerate the design,
characterization, and optimization of SNEFs and adopt a
formulation design platform that suits similar drug models (Bahloul et al., 2015).
The aim of the current study is to build-up an
advanced SNEF design framework for weakly basic lipophilic drugs. Cinnarizine (CN), a highly lipophilic
compound (log P = 5.8) (Loftsson, Hreinsdóttir, Másson, 2005), was selected as the model drug for the current study. CN is a weak base with Pka1 = 1.94 and Pka2 =
7.47 (Tokumura et al., 1987). It shows a pH-dependent solubility that is 0.29 mg/mL at pH 2, 0.017 mg/mL at pH 5, and 0.002 mg/mL at pH 6.5 (Gu et al., 2005;
Raghuvanshi, Pathak, 2014). Therefore, it is vital to
consider the influence of formulation acidity and pH
variation during the design of CN-SNEF (Shahba,
Mohsin, Alanazi, 2012a). In the current study, we aim to bridge the gaps regarding critical characterization issues, explore the role of formulation acidiication, and utilize the experimental design for a time-efective and accurate optimization of SNEFs for weakly basic lipophilic drugs.
MATERIAL AND METHODS
Material
Miglyol 810 (M810, medium chain triglycerides),
Miglyol 812 (M812, medium chain triglycerides), Imwitor 308 (I308, medium chain monoglycerides), and Imwitor 988 (I988, medium chain mono/diglycerides) were kindly supplied by Sasol GmbH, Germany. Oleic acid (OL, long chain fatty acid C18) and Tween 80 (T80) were obtained from Avonchem, UK. Tween 85 (T85) was purchased from Merck-Schuchardt OHG, Germany. Tween 20 (T20) was purchased from BDH, UK. Cremophor EL (Cr-El) and Cremophor RH40 (Cr-RH40) were supplied
by BASF, Germany. CremerAc Capric acid (C10) 98/100
and Cremer AC distilled coconut oil fatty acids (COFA)
were kindly supplied by Cremer Oleo GmbH & Co. KG, Germany. Caprylic acid (C8) was purchased from Wuji
Xinhui Chemical Co. Ltd, China. Sefsol 218 (S218),
HCO-30, and HCO-60 were kindly provided by Nikko Chemicals, Japan. Lauroglycol 90 and Capmul PG-12 were kindly supplied by Gattefosse, France and Abitec, USA, respectively. CN was supplied by FDC Limited,
India.
Equilibrium solubility studies
The equilibrium CN solubility in diverse formulations was determined according to previously reported studies (Baka, Comer, Takács-Novák, 2008) with some modiications. After at least a three-day equilibration period, samples were withdrawn, centrifuged, and assayed using ultra-performance liquid chromatography (UPLC) (Abdel-Hamid et al., 2012; Shahba, Mohsin, Alanazi,
2012a).
Self-emulsification assessment
A previously reported (Kommuru et al., 2001; Shahba, Mohsin, Alanazi, 2012b) visual test, used to assess self-emulsiication eiciency, was modiied and adopted for the current study. In accordance with routine practice, formulation dispersion in water was utilized as a fast and
general tool to assess formulation self-emulsification
eiciency. However, in the current study, it was proven that “formulation dispersion in water” was not suicient alone because some formulations may show variable emulsiication behaviors at diferent pH.
To assess such formulations accurately,
drug-equilibrated formulations were dispersed under the following conditions:
Primarily, formulations were subjected to 1:400 aqueous dilution in a 50.0 mL glass beaker, and the contents were gently mixed (~500 rpm) using a magnetic
stirrer (Nekkanti et al., 2010; Shahba, Mohsin, Alanazi, 2012b). Alternatively, formulations (20–30 mg) were diluted with 50.0 mL of 0.1 N HCl (pH 1.2) in order to mimic gastric pH. The contents were then gently mixed
as previously described. Finally, 25.0 mL of ≈120 mM
The formulations were evaluated on the basis of
performance indicator tools, such as excipient miscibility, spontaneity, and homogeneity/dispersibility (Shahba,
Mohsin, Alanazi, 2012b).
Optical density
For further exploration of assessment results, the optical density (OD) of selected diluted formulations
were examined at 600.0 nm using an UV-visible spectrophotometer (UVD-3200, Labomed Inc., USA) (Date, Nagarsenker, 2007; Thakkar et al., 2011). Prior
to OD measurement, drug free and/or drug equilibrated formulations were subjected to 1:400 aqueous dilutions in a 50.0 mL glass beaker, and the contents were gently mixed using a magnetic stirrer (~500 rpm) (Nekkanti et al., 2010; Shahba, Mohsin, Alanazi, 2012b). Formulation clarity was categorized according to the following OD600 ranges:
transparent: OD600 = 0.00-0.05, bluish: OD600 = 0.05-0.1,
turbid: OD600 = 0.1-0.3, and milky: OD600 > 0.3 (Shahba,
Mohsin, Alanazi, 2012b).
Droplet size analysis
The average droplet size of the diluted SNEF was examined using a Zetasizer Nano ZS (Malvern, UK). The formulations were diluted in distilled water at a ratio
of 1:1000 v/v and mixed for 1 min prior to examination (Kommuru et al., 2001; Atef, Belmonte, 2008).
Experimentally designed phase diagrams
Phase diagram studies often require large numbers of sample preparations, thereby requiring extensive time. In the current study, all phase diagrams were constructed
using advanced experimental design in order to reduce the number of experiments, save time, and obtain a comprehensive analysis of the data. Design Expert®
(version 9, Stat-Ease, Inc., USA) was used to construct the D-optimal mixture design (Mukherjee, Plakogiannis,
2010) of CN-SNEFs. The mixture study included three components: the oil portion (represented by free fatty acid,
A), the co-surfactant portion (represented by I308, B), and
the surfactant portion (represented by Cr-El, C).
COFA/I308/Cr-El system
This system was chosen as a model formulation
to study the influence of time and drug loading on
formulation turbidity upon aqueous dilution. Formulation turbidity was assessed by measuring the optical density
at 600 nm (Date, Nagarsenker, 2007; Thakkar et al.,
2011). On the basis of preliminary self-emulsiication and solubility data, the range for each component was selected as follows:
10 ≤ COFA ≤ 50 0 ≤ I308 ≤ 60 30 ≤ Cr-El ≤ 70
Total components = 100
The base design suggested 17 runs for the itting of a special cubic model, a check for lack of it, and an estimate
of experimental error in formulation OD600 (Mukherjee,
Plakogiannis, 2010).
The design included the assessment of ive responses as follows:
R1: OD600 after 5 min of aqueous dilution of
CN-free formulation; R2: OD600 after 1 h of aqueous dilution
of CN-free formulation; R3: OD600 after 5 min of aqueous
dilution of CN-equilibrated formulation; R4: OD600 after
1 h of aqueous dilution of CN-equilibrated formulation;
R5: OD600 after 2 h of aqueous dilution of CN-equilibrated formulation.
OL/I308/Cr-El system
On the basis of preliminary self-emulsiication and solubility data, the range of each component was selected as follows:
10 ≤ OL ≤ 30 10 ≤ I308 ≤ 40 30 ≤ Cr-El ≤ 70
Total components = 100
The base design suggested U_Pseudo coding with 16 runs for the itting of a quadratic model, a check for lack of it, and an estimate of experimental error (Mukherjee,
Plakogiannis, 2010).
The design included the assessment of three
responses as follows:
R1: droplet size after 1 h of aqueous dilution of drug-free formulation (nm); R2: droplet size after 1 h of aqueous dilution of drug-equilibrated formulation (nm); R3: equilibrium solubility (mg/g).
Cross polarizing light microscopy
crossed polarized light microscopy (Carl Zeiss, Axio lab. A1 (equipped with camera), Jena, Germany) (Mohsin, Long, Pouton, 2009; Mohsin, Pouton, 2012). Samples were examined for the existence of birefringence, a characteristic of liquid crystals, at a magniication of 40×
(Kossena et al., 2004). Liquid crystalline (LC) phases were further identiied as hexagonal or lamellar based on
the observed birefringence patterns. Within the current
study, liquid SNEF samples were examined to investigate the inluence of CN loading on birefringence patterns in anhydrous samples, as well as 30% and 50% water dilution
samples.
Determination of CN by using UPLC assay
CN was accurately quantiied by using a recently reported UPLC reversed-phase method (Abdel-Hamid et al., 2012) with minor modifications. The mobile phase composition was altered to 0.5% trifluroacetic acid:acentonitrile (55:45) and the run time was increased to 1.5 min to allow for higher resolution between the intact drug and degradation product peaks. Separation was achieved using an Acquity® UPLC BEH C18 (2.1 × 50
mm, 1.7 µm) column along with an Acquity guard ilter, maintained at 50 ºC, and the low rate was maintained at
0.5 ml/min. The UV detector was set at 251 nm and the injection volume was 1.0 µl.
Statistical analysis
The statistical significance of the results was analyzed using SPSS 22® software. One-way analysis of
variance (ANOVA) followed by post hoc tests (LSD) were
applied to compare solubility results (Atef, Belmonte,
2008; Shahba, Mohsin, Alanazi, 2012a). A value of p < 0.05 was considered signiicant.
RESULTS AND DISCUSSION
Equilibrium solubility studies
CN solubility was previously screened in diverse formulation compositions (Shahba, Mohsin, Alanazi, 2012a). In the current study, we aimed to maximize CN solubility and to develop a formulation design framework for weakly basic lipophilic drugs. Being a weak base, it was crucial to investigate the influence of formulation acidiication on CN solubility. Formulation acidiication was achieved using either an external acidiier (represented by HCl) or an internal acidiier (represented by free fatty
acid present in the formulation).
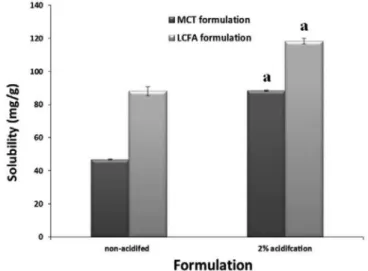
Influence of external acidification on CN solubility The inluence of formulation acidiication on CN solubility was investigated by acidifying SNEF by using 37% HCl solution as the external acidiier. HCl solution was added to the formulation at 1%, 2%, and 5% w/w. Preliminary data revealed that 2% HCl acidification showed the highest CN solubilization. This finding might be explained by the high formulation water content that led to lower CN solubilization in case of 5% acidiication.
The study involved investigating the acidiication of two formulations: medium chain triglyceride (MCT)
based-formulation and long chain fatty acid (LCFA)
based-formulation. In case of MCT formulations, 2% acidification resulted in a 100% solubility increase relative to the non-acidiied counterpart. However, the 2% acidiied LCFA formulation showed a 30% increase relative to the non-acidiied counterpart (Figure 1). The solubility increase upon acidiication complies with the fact that CN is a weak base and its solubility increases with decreasing pH (Gu et al., 2005). Similar results
have been obtained with other weakly basic drugs, such as albendazole, which was shown to present increased solubility with increased concentrations of acidified PEG400 in the formulation (Mukherjee, Plakogiannis,
2010). The solubility increase upon formulation
FIGURE 1 - Influence of external formulation acidification on CN solubility. MCT: medium chain triglycerides, LCFA:
long chain fatty acid. Non-acidified MCT formulation was represented by M812/I308/T85 (25/25/50); 2% acidiied MCT formulation by M812/I308/T85/HCl (24/24/50/2); non-acidiied LCFA formulation by OL/I308/Cr-El (25/25/50); 2% acidiied LCFA formulation by OL/I308/Cr-El/HCl (24.5/24.5/49/2). a
denotessigniicant diference (p < 0.05) from the corresponding
acidiication may be due to drug super-saturation or the
transient formation of hydrochloride salts.
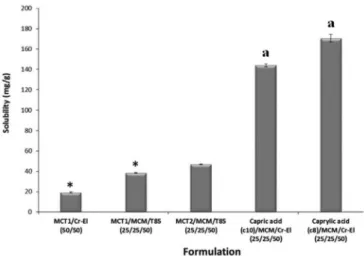
Influence of internal acidification (free fatty acids versus ester form)
CN shows significant solubility increase upon increasing the acidity of aqueous systems (Gu et al., 2005).
Interestingly, this phenomenon was also predominant in lipid-based systems (Figures 2 and 3).
Capric and caprylic acid (free fatty acids)
formulations showed significantly (p<0.05) higher
CN solubility relative to other capric/caprylic ester formulations (Figure 2). It seems that free fatty acids
signiicantly increase CN solubility by acting as lipophilic solubilizers, as well as internal acidiiers.
Similarly, a COFA (high % of free lauric acid)-based formulation showed significantly (p<0.05) higher CN
solubility relative to other lauric acid monoglycerides
(esters) formulations (Figure 3).
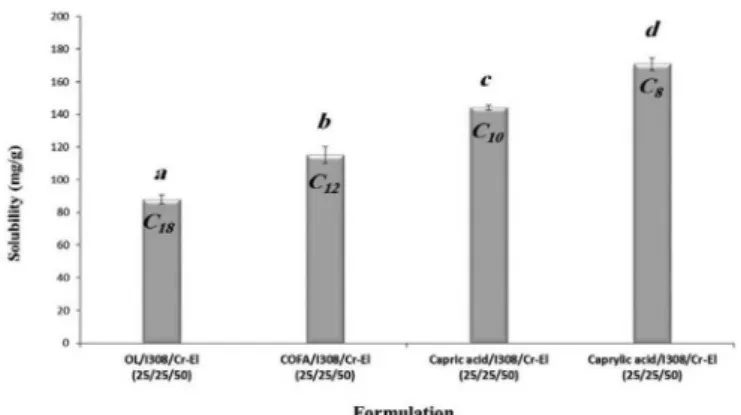
Influence of fatty acid chain length
A more focused study was conducted to evaluate the inluence of changing the fatty acid type within the formulation (Figure 4). CN solubility was signiicantly
(p<0.05) increased upon decreasing fatty acid chain
length. This finding may appear inconsistent with the finding of a previous study (Shahba, Mohsin, Alanazi,
2012a) that showed higher CN solubility in long chain lipid formulations. However, thorough data review
revealed that the previously compared formulations
were uneven since the previous study (Shahba, Mohsin, Alanazi, 2012a) compared long chain free fatty acid with
medium chain ester formulations. For a fair comparison,
formulators should consider whether the evaluated fatty
acid is in the free or ester form.
The phenomenon found in Figure 4 was correlated with the fact that the acid value of fatty acids increases
as the fatty acid chain length decreases. Finally, a direct
linear relationship was established between the reported
acid value of the fatty acids in the formulation and CN
solubility (Figure 5). CN solubility signiicantly (p<0.05)
increased as the acid value increased. This point provides
a suggested platform for the formulation design of weakly
basic lipophilic drugs.
Self-emulsification assessment
Influence of external acidification
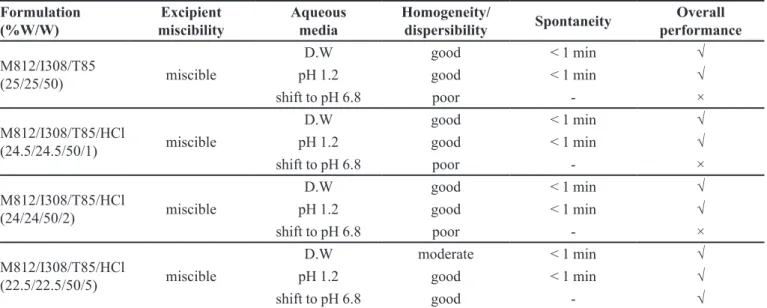
Medium chain glyceride formulations (acidiied by HCl) showed satisfactory self-emulsiication behavior upon water and acidic dilution at pH 1.2. However, all formulations (except for the 5% acidiied formulation) presented indispersible lakes upon shifting from pH 1.2 to pH 6.8 (Table I). This may be due to the interaction of the hydrochloride salt present in the formulation with the bufer salts of the alkaline media.
FIGURE 2 - Inluence of internal formulation acidiication on CN solubility in capric/caprylic acid-based formulations. MCT1 denotes medium chain capric/caprylic triglycerides (M810), MCT2 denotes medium chain capric/caprylic triglycerides (M812), and MCM denotes medium chain capric/caprylic
mono-glycerides (I308). *: Data adapted from Shahba, Mohsin, Alanazi, 2012a; a: signiicant diference (p < 0.05) from other
formulations. Data are expressed as mean ± S.D., n = 3.
FIGURE 3 - Influence of internal formulation acidification
on CN solubility in lauric acid-based formulations. PG-ML1 denotes propylene glycol monolaurate (Lauroglycol 90), PG-ML2 denotes propylene glycol monolaurate (Capmul PG-12). T20: Tween 20; Cr-RH40: Cremophor RH40; COFA: coconut oil free fatty acids (high % of lauric acid); MCM: medium chain capric/caprylic mono-glycerides (I308). a: signiicant diference (p < 0.05) from other formulations. Data are expressed as
Influence of internal acidification
Incorporation of free fatty acids in SNEFs offers
dual advantages of serving as lipophilic portions as well as internal acidiiers within the formulation. Diferent fatty acids were assessed in order to explore their inluence on formulation self-emulsifying eiciency.
Although some formulations containing COFA
showed eicient self-emulsiication upon water and acidic dilution, they presented indispersible lakes upon shifting to pH 6.8 (Table II). A follow-up study was conducted to assess whether bufer salts interact with formulation components and produce these lakes. To distinguish the inluence of the bufer salts, both formulation components and solution pH were maintained nearly equal while various bufer salts were investigated. COFA/I308/HCO-60 (25/25/50) was selected as a control formulation and
various buffer salts (with solution pH = 6.8 ± 1) were
assessed (Table III). The model formulation presented
poor homogeneity/dispersibility with all the investigated
buffer salts. These results suggest that the poor
self-emulsiication of the COFA formulation (at pH 6.8) might
be related to the fatty acid itself rather than any interaction
with the bufer salts.
Most capric acid (c10) and caprylic acid (c8)
formulations showed excellent self-emulsification behavior upon acidic dilution (Table IV). However, they
presented poor homogeneity/dispersibility upon shifting
to pH 6.8. On the other hand, OL formulations exhibited superior performance compared with other fatty acids (Table V). Most of the tested formulations showed excellent self-emulsiication in water, at pH 1.2, and even at pH 6.8. This observation is in agreement with recent
studies (Larsen et al., 2012; Patel, Sarma, Vavia, 2013) where OL self-emulsifying formulations have exhibited
excellent self-emulsification in all tested media. This promising OL characteristic might be explained by the
low acid value of OL compared with other fatty acids
(Figure 5) leading to a decreased precipitation tendency at
pH 6.8. Another possible reason may be that OL is thought to behave as a co-surfactant at neutral pH (Larsen et al., 2012).
The aforementioned discussion highlights the importance of conducting the self-emulsification
assessment in three diferent media (distilled water, pH 1.2, and pH 6.8), especially for weakly basic drugs. The usual practice of conducting the self-emulsiication assessment in water only could lead to inaccurate excipient selection, resulting in wasted time and unsuccessful formulation optimization.
Experimentally designed phase diagrams
For each phase diagram, dots represented the
investigated points in the design. Dots marked with a “2” or a “3” indicate points that were duplicated or triplicated, respectively. The analysis of response variables were carried out by using Design Expert® software. Data transformation was performed if necessary. Model itting was carried out to select a model with insigniicant lack-of-it, high adjusted and predicted R-squared values, small standard deviation, small predicted residual sum of squares (press), and no aliasing (Mukherjee, Plakogiannis, 2010).
COFA/I308/Cr-El system
The D-optimal mixture design was applied to examine the inluence of varying formulation components FIGURE 4 - Inluence of fatty acid chain length on CN solubility.
OL denotes oleic acid (c18) and COFA denotes coconut oil free
fatty acids (high % of lauric acid, C12). Diferent letters above the bars indicate signiicant diference (p<0.05) between the solubility values. Data are expressed as mean ± S.D., n = 3–6.
FIGURE 5 - Inluence of the acid value of the oil portion on CN
TABLE I - Inluence of HCl acidiication on self-emulsiication eiciency in medium chain glyceride formulations
Formulation (%W/W)
Excipient miscibility
Aqueous media
Homogeneity/
dispersibility Spontaneity
Overall performance
M812/I308/T85
(25/25/50) miscible
D.W good < 1 min √
pH 1.2 good < 1 min √
shift to pH 6.8 poor - ×
M812/I308/T85/HCl
(24.5/24.5/50/1) miscible
D.W good < 1 min √
pH 1.2 good < 1 min √
shift to pH 6.8 poor - ×
M812/I308/T85/HCl
(24/24/50/2) miscible
D.W good < 1 min √
pH 1.2 good < 1 min √
shift to pH 6.8 poor - ×
M812/I308/T85/HCl
(22.5/22.5/50/5) miscible
D.W moderate < 1 min √
pH 1.2 good < 1 min √
shift to pH 6.8 good - √
(√): good self-emulsifying eiciency; (×): poor self-emulsifying eiciency; M812: miglyol 812; I308: Imwitor 308; T85: tween 85.
TABLE II - Inluence of internal acidiication by COFA on formulation self-emulsifying eiciency
Formulation (%W/W) Excipient miscibility
Aqueous media
Homogeneity/ dispersibility
Spontaneity (min)
Overall performance
COFA/I308/Cr-El
(25/25/50) miscible
pH 1.2 poor < 1 ×
shift to pH 6.8 poor - ×
COFA/I308/Cr-El
(10/20/70) miscible
pH 1.2 good < 1 √
shift to pH 6.8 poor - ×
COFA/S218/Cr-El
(25/25/50) miscible
pH 1.2 good < 1 √
shift to pH 6.8 poor - ×
COFA/I308/T80
(25/25/50) miscible
pH 1.2 good < 1 √
shift to pH 6.8 poor - ×
COFA/I308/T20
(25/25/50) miscible
pH 1.2 good < 1 √
shift to pH 6.8 poor - ×
COFA/I308/PG/Cr-El
(25/15/10/50) miscible
pH 1.2 good < 1 √
shift to pH 6.8 poor - ×
COFA/I308/M812/Cr-El
(25/12.5/12.5/50) miscible
pH 1.2 good < 1 √
shift to pH 6.8 poor - ×
COFA/T85/Cr-El
(33.3/33.3/33.3) miscible pH 1.2
good < 1 √
shift to pH 6.8 poor - ×
COFA/I308/HCO-60
(25/25/50) miscible
pH 1.2 good < 1 √
shift to pH 6.8 poor - ×
(√): good self-emulsifying eiciency; (×): poor self-emulsifying eiciency; COFA: coconut oil fatty acids; I308: Imwitor 308; S218: sefsol 218; Cr-El: cremophor El; M812: miglyol 812; T20: Tween 20; PG: propylene glycol; T80: Tween 80.
on formulation OD600 after aqueous dilution at ive diferent
stages (Figures 6 and 7). The irst and second responses were conducted using CN-free formulation (Figure 6).
There was no substantial diference between OD600 at 5
TABLE III - Inluence of varying bufer solutions on formulation self-emulsifying eiciency
Formulation (%W/W) Bufer solution pH Homogeneity/ dispersibility
Spontaneity (min)
Overall performance
COFA/I308/HCO-60
(25/25/50)
K2HPO4,KH2PO4,
NaOH 7.5 poor < 1 ×
COFA/I308/HCO-60
(25/25/50) Na2HPO4, KH2PO4 6.8 poor < 1 ×
COFA/I308/HCO-60
(25/25/50)
Na-acetate,
0.1N HCl 5.9 poor < 1 ×
COFA/I308/HCO-60
(25/25/50)
tri-Na citrate,
0.1N HCl 6.65 poor < 1 ×
COFA/I308/HCO-60
(25/25/50)
K2HPO4,
0.1 N HCl 6.75 poor < 1 ×
COFA/I308/HCO-60
(25/25/50)
Na-acetate,
NaOH 6.7 poor < 1 ×
(√): good self-emulsifying eiciency; (×): poor self-emulsifying eiciency; COFA: coconut oil fatty acids; I308: Imwitor 308.
TABLE IV - Inluence of internal acidiication by capric (c10) and caprylic (c8) acid on formulation self-emulsifying eiciency
Formulation (%W/W) Excipient miscibility
Aqueous media
Homogeneity/ dispersibility
Spontaneity (min)
Overall performance
Capric acid (c10)/I308/Cr-El
(25/25/50) miscible
pH 1.2 good < 1 √
shift to pH 6.8 poor - ×
Capric acid (c10)/I308/T20
(25/25/50) miscible
pH 1.2 good < 1 √
shift to pH 6.8 poor - ×
Capric acid (c10)/I308/Cr-RH40
(25/25/50) miscible
pH 1.2 good < 1 √
shift to pH 6.8 poor - ×
Capric acid (c10)/I308/T85
(25/25/50) miscible
pH 1.2 good 1–5 √
shift to pH 6.8 poor - ×
Capric acid (c10)/I308/HCO-30
(25/25/50) miscible
pH 1.2 good < 1 √
shift to pH 6.8 poor - ×
Capric acid (c10)/I988/Cr-El
(25/25/50) miscible
pH 1.2 good < 1 √
shift to pH 6.8 poor - ×
Caprylic acid (c8)/I308/Cr-El
(25/25/50) miscible
pH 1.2 good < 1 √
shift to pH 6.8 poor - ×
(√): good self-emulsifying eiciency; (×): poor self-emulsifying eiciency; I308: Imwitor 308; I988: Imwitor 988; Cr-El: cremophor El; Cr-Rh40: cremophor RH40; T20: Tween 20; T85: Tween 85.
bluish and large turbid and milky areas. On the other
hand, CN-equilibrated formulations showed signiicant
decrease in OD600 compared to their CN-free counterparts
(Figure 6 [A, B], Figure 7 [A, B]). At 5 min, the phase
diagram showed large transparent and bluish areas with no existence of turbid or milky areas (Figure 7A). At subsequent (1 h and 2 h) samples, OD600 showed a
gradual shift upwards and a turbid area started to appear
at the expense of the transparent area (Figure 7 [B,C]).
It is worth noticing that all formulations showed sharply lower OD600 values after equilibration with CN. This is
an unusual phenomenon because CN is a PWSD and
TABLE V - Inluence of internal acidiication by OL on formulation self-emulsifying eiciency
Formulation
(%W/W) Aqueous media
Excipient miscibility
Homogeneity/ dispersibility
Spontaneity (min)
Overall performance
OL/I308/Cr-El
(25/25/50)
pH 1.2
miscible good < 1 √
shift to pH 6.8 good - √
OL/I308/Cr-El
(30/30/40) pH 1.2 miscible
good < 1 √
shift to pH 6.8 good - √
OL/I308/Cr-El
(30/40/30) pH 1.2 miscible
poor < 1 ×
shift to pH 6.8 poor - ×
OL/I308/HCO-60
(30/40/30) pH 1.2 miscible
good < 1 √
shift to pH 6.8 good - √
OL/I308/HCO-60
(25/25/50)
pH 1.2
immiscible good < 1 ×
shift to pH 6.8 good - ×
(√): good self-emulsifying eiciency; (×): poor self-emulsifying eiciency; OL: oleic acid, I308; Imwitor 308, Cr-El; cremophor El
FIGURE 6 - Mixture design for the COFA/I308/Cr-El system showing: (A1) phase diagram; (A2): 3D plot of OD600 after 5 min
of aqueous dilution of CN-free formulation; (B1) phase diagram; (B2): 3D plot of OD600 after 1 h of aqueous dilution of CN-free
of this phenomenon, another system was investigated
using OL, rather than COFA, as the oil component.
OL/I308/Cr-El system
D-optimal mixture design was applied to examine the
inluence of varying formulation components on droplet size and equilibrium solubility. The droplet size of the diluted CN-free formulations showed high variability, ranging from
less than 100 nm up to ≈ 1250 nm (Figure 8A). Formulations
with droplet size above 100 nm are expected to show a turbid or milky appearance (Shahba, Mohsin, Alanazi, FIGURE 7 - Mixture design for COFA/I308/Cr-El system showing: (A1) phase diagram; (A2) 3D plot of OD600 after 5 min of
aqueous dilution of CN-equilibrated formulation; (B1) phase diagram; (B2) 3D plot of OD600 after 1 h of aqueous dilution of
CN-equilibrated formulation; (C1) phase diagram; (C2) 3D plot of OD600 after 2 h of aqueous dilution of CN-equilibrated formulation.
2012b). However, formulation phase behavior completely
changed upon CN incorporation (Figure 8B). Diluted
CN-equilibrated formulations showed less variability and signiicantly smaller droplet sizes, with a maximum of 87
nm. This observation closely matches the results obtained
in the previous COFA/I308/Cr-El phase diagram, where the incorporation of CN led to smaller droplet sizes, decreased turbidity, and increased SNEF eiciency. Many researchers have examined the inluence of PWSD incorporation into SNEFs on droplet size. Some articles showed droplet size increases upon drug incorporation (Kommuru et al.,
2001; Kang et al., 2004), while a few articles showed no droplet size diference upon drug incorporation (Nielsen et al., 2007). However, one recent publication showed signiicant droplet size decrease upon drug incorporation (Patel, Sarma, Vavia, 2013). This last publication may be in agreement with the current work because it has also
investigated a very similar formulation composition (OL/
medium chain monoglycerides/Cr-El) with a weakly basic
drug (lumefantrine). According to that recent publication
(Patel, Sarma, Vavia, 2013), this phenomenon might be due to the interaction between the drug amine group and the OL carboxylic group, which leads to the formation of an
ion-pairing complex. The formed complex presented more
eicient self-emulsiication and lower droplet sizes than the
drug-free formulation. The observed phenomenon could be
extrapolated for other weakly basic lipophilic drugs. The third response involved the equilibrium CN
solubility in anhydrous SNEFs (Figure 8C). Maximum CN
solubility was achieved using higher OL and lower Cr-El proportions. This result matches the solubility data, which showed a signiicant (p < 0.05) rise in CN solubility upon increasing the free fatty acid proportion in the formulation
(Figure 3).
Experimental model validation
To achieve the optimum CN-SNEF, it was desirable to select the formulation presenting lower droplet size and higher CN solubility. The formulation [OL/I308/Cr-El (25/25/50)] was selected as a conirmation point to validate
the predictions of the experimental model. The design
was utilized to predict the three design responses for this formulation. Experiments were then conducted to obtain the actual response values. All the actual mean values were close to the predicted mean, and fall between the 95% lower and higher prediction intervals (Table VI). These results conirm the model accuracy in predicting diferent design responses. The selected formulation showed ultra-ine (43 nm) droplet size (in case of CN loading), high (88
mg/g) CN solubility, and therefore has great potential to
present an eicient CN-SNEF. These results match the
recently reported data regarding CN-SNEFs (Shahba,
Mohsin, Alanazi, 2012a).
Cross polarizing light microscopy
The optimal liquid SNEF (OL/I308/Cr-El [25/25/50)] was examined to investigate the inluence of CN loading on the birefringence pattern in anhydrous samples, as well as 30% and 50% water dilutions. Anhydrous liquid SNEF showed a transparent isotropic oily phase in both CN-free and CN-equilibrated samples. After hydration, CN-free liquid SNEF showed a two-phase emulsion mixture (without LC) at both 30% and 50% water ratios (Figure 9A, B). However, hydrated samples of CN-loaded SNEF
became more transparent and presented a birefringent LC
phase at 50% water ratio (Figure 9C, D). On the basis of the observed pattern, this sample was identiied as lamellar LC phase (Mohsin, Long, Pouton, 2009; Mohsin, Pouton,
2012). The presence of a lamellar LC phase could lead to
the enhancement of the formulation self-emulsiication eiciency. A very recent article (Lee et al., 2016) showed
pronounced enhancement of bioavailability upon using
lamellar LC nanoparticles. It is worth noticing that the LC phase was only observed in the CN-loaded formulation. This is in close correlation with the phenomenon observed in experimentally designed phase diagrams, which showed enhanced SNEF eiciency upon CN incorporation into
the formulation.
CONCLUSION
Pre-competitive research should be promoted to
build-up advanced formulation design frameworks for different PSWD categories. In the current study, we investigated the weakly basic lipophilic drug category
by using CN as a model. The formulation acidity and the
pH of the dispersion media were found to exert strong inluences on drug solubility and formulation eiciency,
respectively. Formulation acidification produced
significant drug solubility increase. It was critical to
conduct the self-emulsification assessment in media
with different pH rather than water alone. This step is of particular importance for weakly basic drugs. OL was found to be a vital component in the development of SNEFs for weakly basic lipophilic drugs. It offers several advantages, serving as a lipophilic solubilizer, an internal acidiier, along with maintaining excellent self-nanoemulsiication eiciency. As shown in the current
study, experimentally designed phase diagrams could be
of SNEFs. Future work may involve in vitro dissolution
and lipolysis studies in formulation optimization by experimental design. The adopted optimization approach explored critical characterization issues, the role of formulation acidiication, SNEF optimization by experimental design, and can be generalized for the whole
category of weakly basic lipophilic drugs.
ACKNOWLEDGEMENTS
This work was funded by the National Plan for Science, Technology, and Innovation (MAARIFAH), King FIGURE 8 - Mixture design for OL/I308/Cr-El system showing: (A1) phase diagram; (A2) 3D plot of droplet size of diluted CN-free
Abdulaziz City for Science and Technology, Kingdom of Saudi Arabia, Award Number (11NAN1953-02). The authors acknowledge “Kayyali Chair for Pharmaceutical Industries” for hosting the work. In addition, the authors
appreciate the professional support from Prof. Adel Sakr.
REFERENCES
ABDEL-HAMID, M.; SHAHBA, A.; MOHSIN, K.; ALANAZI, F. Ultra-performance liquid chromatography assay for cinnarizine in lipid-based formulations. Asian J. Chem., v.24, p.595-600, 2012.
ATEF, E.; BELMONTE, A.A. Formulation and in vitro and in vivo characterization of a phenytoin self-emulsifying
drug delivery system (SEDDS). Eur. J. Pharm. Sci., v.35,
p.257-263, 2008.
BAHLOUL, B.; LASSOUED, M.A.; SEGUIN, J.; LAI-KUEN, R.; DHOTEL, H.; SFAR, S., MIGNET, N. Self-emulsifying drug delivery system developed by the HLB-RSM approach: Characterization by transmission electron
microscopy and pharmacokinetic study. Int. J. Pharm.,
v.487, p.56-63, 2015.
TABLE VI - Validation of the experimental design model using the formulation [OL/I308/Cr-EL (25/25/50)]
Response S.D. n Predicted
mean
Actual data
mean 95% PI low 95% PI high
R1. Droplet size after 1 h of aqueous dilution
of drug-free formulation (nm) 105.8 3 652 677 448 857
R2. Droplet size after 1 h of aqueous dilution
of drug-equilibrated formulation (nm) 9.6 3 48.1 43.0 32.0 64.2
R3. Equilibrium solubility (mg/g) 0.04 6 86.6 88.0 83.0 90.7
n: number of replicates; S.D.: standard deviation; PI: prediction interval
FIGURE 9 - Polarizing microscope images of liquid SNEF showing A: CN-free SNEF/water (70/30, w/w), B: CN-free SNEF/water
BAHLOUL, B.; LASSOUED, M.A.; SFAR, S. A novel approach for the development and optimization of self-emulsifying drug delivery system using HLB and response surface methodology: Application to fenoibrate encapsulation. Int. J. Pharm., v.466, p.341-348, 2014.
BAKA, E.; COMER, J.E.A.; TAKÁCS-NOVÁK, K. Study
of equilibrium solubility measurement by saturation shake-lask method using hydrochlorothiazide as model
compound. J. Pharmac. Biomed., v.46, p.335-341, 2008.
BALAKUMAR, K.; RAGHAVAN, C.V.; SELVAN, N.T.; PRASAD, R.H.; ABDU, S. Self-nanoemulsifying drug
delivery system (SNEDDS) of rosuvastatin calcium: design, formulation, bioavailability and pharmacokinetic
evaluation. Colloid Surf. B., v.112, p.337-343, 2013.
DAHAN, A.; HOFFMAN, A. Rationalizing the selection of oral
lipid based drug delivery systems by an in vitro dynamic lipolysis model for improved oral bioavailability of poorly
water soluble drugs. J. Control. Rel., v.129, p.1-10, 2008.
DATE, A.A.; NAGARSENKER, M.S. Design and evaluation
of self-nanoemulsifying drug delivery systems (SNEDDS)
for cefpodoxime proxetil. Int. J. Pharm., v.329, p.166-172,
2007.
ELNAGGAR, Y.S.R.; EL-MASSIK, M.A.; ABDALLAH, O.Y.
Self-nanoemulsifying drug delivery systems of tamoxifen
citrate: Design and optimization. Int. J. Pharm., v.380,
p.133-141, 2009.
GU, C.H.; RAO, D.; GANDHI, R.B.; HILDEN, J.; RAGHAVAN,
K. Using a novel multicompartment dissolution system to
predict the efect of gastric pH on the oral absorption of weak bases with poor intrinsic solubility. J. Pharm. Sci., v.94, p.199-208, 2005.
GUPTA, S.; KESARLA, R.; OMRI, A. Formulation strategies
to improve the bioavailability of poorly absorbed drugs
with special emphasis on self-emulsifying systems. ISRN Pharm., v.2013, p.16, 2013.
GURSOY, R.N.; BENITA, S. Self-emulsifying drug delivery
systems (SEDDS) for improved oral delivery of lipophilic
drugs. Biomed. Pharmacother., v.58, p.173-182, 2004.
KANG, B.K.; LEE, J.S.; CHON, S.K.; JEONG, S.Y.; YUK, S.H.; KHANG, G.; LEE, H.B.; CHO, S.H. Development of
self-microemulsifying drug delivery systems (SMEDDS) for oral bioavailability enhancement of simvastatin in
beagle dogs. Int. J. Pharm., v.274, p.65-73, 2004.
KOMMURU, T.R.; GURLEY, B.; KHAN, M.A.; REDDY,
I.K. Self-emulsifying drug delivery systems (SEDDS)
of coenzyme Q10: formulation development and
bioavailability assessment. Int. J. Pharm., v.212,
p.233-246, 2001.
KOSSENA, G.A.; CHARMAN, W.N.; BOYD, B.J.; DUNSTAN, D.E.; PORTER, C.J. Probing drug solubilization patterns in
the gastrointestinal tract after administration of lipid-based delivery systems: a phase diagram approach. J. Pharm. Sci.,
v.93, p.332-348, 2004.
LARSEN, A.T.; OGBONNA, A.; ABU-RMAILEH, R.; ABRAHAMSSON, B.; OSTERGAARD, J.; MULLERTZ, A. SNEDDS containing poorly water soluble cinnarizine; development and in vitro characterization of dispersion, digestion and solubilization. Pharmac., v.4, p.641-665, 2012.
LEE, D.R.; PARK, J.S.; BAE, I.H.; LEE, Y.; KIM, B.M. Liquid
crystal nanoparticle formulation as an oral drug delivery
system for liver-speciic distribution. Int. J. Nanomed., v.11,
p.853-871, 2016.
LOFTSSON, T.; HREINSDÓTTIR, D.; MÁSSON, M.
Evaluation of cyclodextrin solubilization of drugs. Int. J. Pharm., v.302, p.18-28, 2005.
MOHSIN, K.; LONG, M.A.; POUTON, C.W. Design of
lipid-based formulations for oral administration of poorly
water-soluble drugs: precipitation of drug after dispersion of formulations in aqueous solution. J. Pharm. Sci., v.98,
p.3582-3595, 2009.
MOHSIN, K.; POUTON, C.W. The inluence of the ratio of
lipid to surfactant and the presence of cosolvent on phase
behaviour during aqueous dilution of lipid-based drug
delivery systems. J. Drug Deliv. Sci. Tec., v.22, p.531-540,
2012.
MUKHERJEE, T.; PLAKOGIANNIS, F.M. Development
and oral bioavailability assessment of a supersaturated self-microemulsifying drug delivery system (SMEDDS)
NEKKANTI, V.; KARATGI, P.; PRABHU, R.; PILLAI, R.
Solid self-microemulsifying formulation for Candesartan cilexetil. AAPS PharmSciTech, v.11, p.9-17, 2010.
NIELSEN, F.S.; GIBAULT, E.; LJUSBERG-WAHREN, H.; ARLETH, L.; PEDERSEN, J.S.; MULLERTZ, A. Characterization of prototype self-nanoemulsifying
formulations of lipophilic compounds. J. Pharm. Sci., v.96, p.876-892, 2007.
PATEL, K.; SARMA, V.; VAVIA, P. Design and evaluation
of Lumefantrine - Oleic acid self-nanoemulsifying ionic
complex for enhanced dissolution. Daru, v.21, p.27, 2013.
RAGHUVANSHI, S.; PATHAK, K. Recent advances in delivery systems and therapeutics of cinnarizine: a poorly water soluble drug with absorption window in stomach. J. Drug Deliv., v.2014, p.15, 2014.
SHAHBA, A.A.-W.; MOHSIN, K.; ALANAZI, F.K. Novel
self-nanoemulsifying drug delivery systems (SNEDDS) for oral
delivery of cinnarizine: design, optimization, and in-vitro
assessment. AAPS PharmSciTech, v.13, p.967-977, 2012a.
SHAHBA, A.A.; MOHSIN, K.; ALANAZI, F.K. The studies of phase equilibria and efficiency assessment for
self-emulsifying lipid-based formulations. AAPS PharmSciTech,
v.13, p.522-533, 2012b.
THAKKAR, H.; NANGESH, J.; PARMAR, M.; PATEL, D. Formulation and characterization of lipid-based
drug delivery system of raloxifene-microemulsion and self-microemulsifying drug delivery system. J. Pharm. Bioallied. Sci., v.3, p.442-448, 2011.
TOKUMURA, T.; TSUSHIMA, Y.; TATSUISHI, K.; KAYANO, M.; MACHIDA, Y.; NAGAI, T. Enhancement of the oral bioavailability of cinnarizine in oleic acid in beagle dogs.
J. Pharm. Sci., v.76, p.286-288, 1987.
Received for publication on 18th April 2016