Perceptual confusions among consonants in Brazilian
Portuguese as a function of noise
Confusões perceptivas entre consoantes do Português Brasileiro
em função do ruído
Lílian Marinho dos Santos1, Stela Maris Aguiar Lemos2, Rui Rothe-Neves3
ABSTRACT
Purpose: (a) to determine whether an individual’s behavior, in the perception of consonants in different noise conditions, is directly related to how these sounds are represented in the mind, (b) to determine whether there is a relationship between phonological and perceptual similarity. Methods: The study used a non-probability sample based on typicality, with participation of eleven adults, aged between twenty and thirty years. The inclusion criteria were: age between eighteen and thirty years; to read, agree and sign the Free and Cleared Term of Consent; to present peripheral hearing and auditory processing within the reference criteria. The data were collected in two stages: 1) Preliminary evaluation consisting of the following tests: pure tone audiometry, tympanometry, speech audiometry and speech test in noise and dichotic digits test, 2) Evaluation of the auditory perception of the consonants [p], [t], [d], [k], [f], [v], [ʃ] and [ʒ] followed by the vowel [a], under white noise or cocktail party noise in the signal/noise ratio of 0 and +5 dB (NS). Results: Under white noise, in both signal/noise ratios, there was more confusion between the consonants [f]-[p], [ʃ]-[k] and [ʃ]-[ʒ]. Under cocktail party noise, there was more confusion between the consonants [f]-[p], [v]-[p], [v]-[f] and [t]-[d]. It was observed that consonants that share more distinctive features are more confusing. Conclusion: The white noise and the cocktail party noise directly affect the perception of the consonants, but in different ways, and a larger perceptive distance is found among consonants under cocktail party noise. Therefore, the confusions among consonants seem to be more influenced by their acoustic rather than their phonological characteristics.
Keywords: Speech perception; Auditory perception; Hearing; Linguistics; Noise
RESUMO
Objetivo: (a) Verificar se o comportamento do indivíduo, na percepção de consoantes em meio a diferentes ruídos, está ligado diretamente ao modo como os sons são mentalmente representados; (b) Verificar se há relação entre similaridade fonológica e perceptiva. Métodos: A pesquisa utilizou uma amostra não probabilística, por tipicidade, composta por 11 participantes adultos, com idade entre 20 e 30 anos. Os critérios de inclu-são foram: ter idade entre 18 e 30 anos; ler, concordar e assinar o Termo de Consentimento Livre e Esclarecido; apresentar audição periférica e processamento auditivo dentro dos critérios de referência. A coleta de dados aconteceu em duas etapas: 1) Avaliação preliminar: audiometria tonal liminar, imitanciometria, logoaudiometria, teste de fala com ruído e teste dicótico de dígitos; 2) Avaliação da percepção de consoantes, com o objetivo de verificar a correta identificação das consoantes [p], [t], [d], [k], [f], [v], [ʃ] e [ʒ], seguidas da vogal [a], em meio aos ruídos branco e de festa, nas relações sinal ruído igual a 0 e +5 dB (NS). Resultados: No ruído branco, em ambas as relações sinal/ruído foram encontradas, em maior número, as confusões: [f]-[p], [ʃ]-[k] e [ʃ]-[ʒ]. No ruído de festa, foram mais encontradas as confusões: [f]-[p], [v]-[p], [v]-[f] e [t]-[d]. Observou-se que, quanto mais traços distintivos as consoantes compartilham, mais elas são confundidas. Conclusão: Ruído branco e ruído de festa afetam diretamente a percepção das consoantes, mas de forma diferente, sendo encontrada maior distância perceptiva entre con-soantes no ruído de festa. Assim, as confusões entre concon-soantes parecem sofrer maior influência das características acústicas, do que fonológicas.
Descritores: Percepção da fala; Percepção auditiva; Audição; Linguística; Ruído
Work performed in the Post-Graduation Program (MSc) in Linguistics, Faculty of Letters, Faculty of Letters – UFMG – Belo Horizonte, Minas Gerais (MG), Brazil. (1) Post-Graduation Program (MSc) in Linguistics, Faculty of Letters, Universidade Federal de Minas Gerais – UFMG – Belo Horizonte, Minas Gerais (MG), Brazil. (2) Department of Speech Therapy, Medical School, Universidade Federal de Minas Gerais – UFMG – Belo Horizonte, Minas Gerais (MG), Brazil.
(3) Faculty of Letters, Universidade Federal de Minas Gerais – UFMG – Belo Horizonte, Minas Gerais (MG), Brazil. Conflict of interests: No
Author’s contribution: LMS main researcher, elaboration of the study, elaboration of the schedule, literature review, data collection and analysis, writing of the
article, article submission and procedures; SMAL advisor, elaboration of the study, literature review, correction of the writing of the article, approval of the final
version; RRN advisor, elaboration of the study, elaboration of the schedule, literature review, data analysis, correction of the writing of the article, approval of
the final version.
Correspondence address: Lílian Marinho dos Santos. R. Rio de Janeiro, 1186/601, Centro, Belo Horizonte (MG), Brasil, CEP: 30160-041. E-mail: [email protected]
INTRODUCTION
The behavior of the individual in the perception of consonants in different situations can be directly related to how the sounds are represented in the mind. A proposal on the linguistic representation of speech sounds supposes that they are organized in a hierarchy of features, which constitute abstractions of their articulatory characteristics(1,2). The basic
premises of the feature geometry can be described as follows:
“a) The features can be grouped into classes; b) The classes form a strict hierarchy that can be represented by a tree with root; c) This hierarchy is universal ; d) Each feature and each class of feature is represented by nodes in separate segmental layers ; e) Each node is connected to elements of only one layer of the highest level.”
In an analysis of the Portuguese language according to the feature geometry(3), the hierarchically organized structure of
the consonant is represented by laryngeal root nodes, of oral cavity (OC) and consonant point (PC). The root node represents the segment as a phonological unit and dominates the other features. It is represented by the features of the main class [±sounding], [±approximant] and [-vocoid]. Laryngeal node refers to the involvement of the larynx in the production of the sounds and is represented by the sounding feature [± voice]. The oral cavity node corresponds to the function of the oral cavity in the production of articulatory sound. The features of the articulation point are connected to it (consonant point node) and also the articulation mode [± continuous]. The consonant point node refers to the point of articulation in the production of the segment and is represented by the [labial], [coronal] and [dorsal] features and by the [± anterior] feature, depending on [coronal]. Based on this description, a phonological matrix of the consonant segments of the Portuguese language was proposed.
From the feature geometry, speech sounds are more or less distinct in terms of their phonological similarity. Segments that share more features are more similar than those that share less features.
However, a sound organization theory should be integrated to other knowledge in order to understand the use of the language in everyday communication situations. It is known, for example, that the auditory perception is directly important for an efficient daily communication and depends on the proper integration of hearing abilities for the effective recognition of the speech sounds, especially in noisy environments(4,5),
since the auditory perception in the silence does not reflect the auditory perception in a noisy environment(6,7). According
to the current knowledge about the formation and function of the auditory system, it can be said that under different types of noise, different peripheral or central auditory capabilities
will be required to extract important features from the speech sound. For example, under white noise, the auditory-closure ability is more required, while under cocktail party noise, the figure-ground ability is more required for the speech perception. On the other hand, as the feature geometry proposes an organization of sounds in a universal hierarchy, it is understood that regardless of the processing characteristics (i.e., used abilities), the most affected and most confusing sounds under noise will be the same, since their phonological similarities will not be influenced by any noise.
This study was elaborated to determine whether an individual’s behavior, in the perception of consonants in different noise conditions, is directly related to how these sounds are represented in the mind. Additionally, its purpose was also to determine whether there is a relationship between phonological and perceptual similarity. In other words, it was expected that, in speech perception, someone would be more easily confused with segments that share more features. On the other hand, sounds that share less features should resist more to confusion and remain distinctly perceived, resisting the deleterious effects of noise on verbal communication.
A better understanding of the individual’s behavior in face of everyday communication situations involving abilities related to speech perception and to auditory processing associated with the understanding of the relationship between systems of distinctive features and speech perception may bring contributions for the areas of Language and Speech.
METHODS
This is a cross-sectional study with repeated measurements, performed with the prior approval of the Research Ethics Committee of the Universidade Federal de Minas Gerais (UFMG), opinion no. ETIC - 0316.0.203.000-11.
The study used a non-probability sample based on typicality, with participation of eleven adults, aged between twenty and thirty years recruited in the UFMG. The inclusion criteria for the study were:
- Age between 18 and 30 years old;
- To read, agree and sign the Free and Cleared Term of Consent;
- To present peripheral hearing and auditory processing within the reference criteria for pure tone audiometry, tympanometry, speech audiometry, speech test in noise and dichotic digits test, namely:
- Hearing thresholds up to 25 dB hearing level (NA)(8);
- Tympanometric curve type A, with bilateral presence of contralateral acoustic reflexes(9);
- Number of hits equal to or greater than 70% in the speech test in noise, with difference of up to 20% between the percentage of hits of the Percentage Index of Speech Recognition and Speech Test in Noise(10);
test, both in the right ear as in the left ear(10).
The exclusion criteria were:
- To refuse to participate in the research; - Not perform the proposed experimental tasks.
The data collection of the research was divided into two stages (preliminary evaluation for sample selection and evaluation of the perception of consonants), performed at the Laboratory of Speech Therapy of the UFMG.
The preliminary evaluation of the sample consisted of tests for analysis of the peripheral hearing (pure tone audiometry, speech audiometry and tympanometry) and auditory processing tests (speech test in noise and dichotic digit test), which evaluated the abilities (auditory-closure and figure-ground) required in our daily life for the speech perception in noise. The purpose of the evaluation of the perception of consonants in noise was to verify the perceptual confusion among consonants followed by the vowel /a/, under white noise or cocktail party noise in the signal/noise ratio of 0 and +5 dB (NS). The white noise is in aperiodic sound waves with equal energy within any frequency band and all phases in a random distribution. The cocktail party noise consists in the speech spectrum associated to noises in a party. The white noise equally masks the frequencies - for this study 10 to 10000 Hz – affecting the peripheral processing. The cocktail party noise acts differently in each frequency. Therefore, affects the central processing in abilities that depend on attention.
The consonants [p], [t], [d], [k], [f], [v], [ʃ] and [ʒ], followed by the vowel [a] were presented to the participants. These consonants were chosen for the following reasons: a) present the same features of the main class; b) vary only in features not belonging to main classes; c) form syllables of the consonant-vowel (CV) type with meaning, i.e., are lexical items of the Brazilian Portuguese. The distinctive features that characterize the consonant segments used in this study are:
/p/: [- sounding], [- vocoid ], [- approximant], [- continuous], [- voice], [labial]
/t/: [- sounding], [- vocoid], [ - approximant], [- continuous], [- voice], [coronal]
/d/: [- sounding], [- vocoid], [- approximant], [- continuous], [+ voice], [coronal]
/k/: [- sounding], [- vocoid], [- approximant], [- continuous], [- voice], [dorsal]
/f/: [- sounding] , [- vocoid], [- approximant], [+ continuous], [- voice], [labial]
/v/: [- sounding], [- vocoid], [- approximant], [+ continuous], [+ voice], [labial]
/ʃ/: [- sounding], [-vocoid], [- approximant], [+ continuous], [- voice], [coronal], [-anterior]
/ʒ/: [- sounding], [-vocoid], [- approximant], [+ continuous], [+ voice], [coronal], [-anterior]
The syllables were recorded by an adult male, in an acoustically treated and soundproofed room. Each syllable was recorded twice.
The syllables were presented to the participants in a diotic way associated with the presence of white noise or cocktail party noise in the signal/noise ratio of 0 and +5 dB (NS). Such signal/noise ratios are based on studies about the tests used for auditory processing(10). The two types of noise were
presented in the same session, with an average duration of 30 minutes and interval between the consonant blocks, in the presence of noise. The intensity level of the presentation of the syllables was 70 dB (NA). Syllables and sounds were presented in a random order. In total there were ten repetitions per type of syllable, totaling 80 syllables per individual in each type of noise.
The participants received a response sheet containing all options of reproduced syllables and were instructed to pay attention only to the syllable, ignoring the noise. After hearing the syllable, they should circle their option in the response sheet.
The responses were analyzed in a confusion matrix, where each row corresponded to the consonants offered as stimulus and each column corresponded to the response of the listener for each consonant. The frequency of hits and misses for each syllable, for the entire group of subjects, was included in this matrix. Based on the judgment of the listener, the perceptual distance among consonants was calculated by means of the frequency of misses. The distance was estimated by Phi (φ), a relationship between the obtained and expected confusion frequencies, weighted by the number of occurrences(11).
The perceptual distance between each consonant calculated this way was analyzed using multidimensional scaling, which is a geometric representation of the distances among consonants, such as a map(12). Therefore, it can be said that the result
represents a perceptual map of the consonants in each level and type of noise. Based on this analysis, the hypothesis that there would be no differences between the perceptual distances in each type of noise was investigated, since different noises do not affect the phonological similarity.
RESULTS
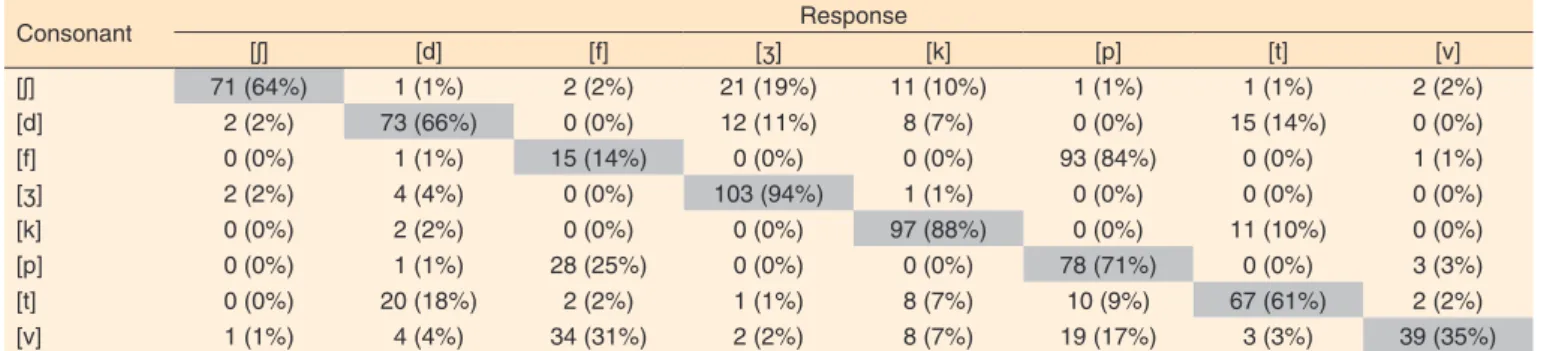
The absolute and relative numbers of hits resulted in a total of 110 presentations for each sound (total number of sample subjects). In the consonant confusion matrix, the diagonal always represents the maximum values in which the consonant was correctly responded, as itself. The values outside the diagonal represent the incorrect perception of each consonant, when it was perceived as another one (Tables 1 and 2).
Under white noise, in the signal/noise ratio of 0 dB (NS) (Table 1) as +5 dB (NS) (Table 2) the consonants that showed greater confusion with each other were: [f] - [p], [ʃ] - [k] and [ʃ] - [ʒ]. The less confusing consonants were: [k], [ʒ], [v] and [t] .
Comparing the performance under cocktail party noise 0 dB (NS) (Table 3) with white noise 0 dB (NS) (Table 1), it is observed that the percentage of hits, in most cases, was lower
under cocktail party noise 0 dB (NS), demonstrating the greater confusion of consonants, when exposed to this kind of noise (Table 3).
Under cocktail party noise 0 dB (NS) (Table 3) and +5 dB (NS), the consonants that showed greater confusion were: [f] - [p], [v] - [p] and [f] and [t] - [d]. The less confusing consonants were: [k], [ʒ] and [p] (Table 4).
Comparing the cocktail party noise +5 dB (NS) (Table 4) to white noise +5 dB (NS) (Table 2), it is also observed that the percentage of hits was lower under cocktail party noise. This finding was observed in both signal/noise ratios of 0 and +5 dB (NS). It was not possible to observe large differences in type of confusion in both signal/noise ratios of the same noise.
The results of the consonant confusion matrices were transformed into a symmetric distance matrix, and from this matrix, the perceptual map of the consonants of each kind of noise was elaborated in its signal/noise ratio. Although the map
Tabela 2. Matriz de confusão de consoante no ruído branco na relação sinal ruído igual a +5 dB (NS)
Consonant Response
[ʃ] [d] [f] [ʒ] [k] [p] [t] [v]
[ʃ] 50 (45%) 4 (4%) 1 (1%) 18 (16%) 28 (25%) 1 (1%) 8 (7%) 0 (0%)
[d] 2 (2%) 88 (80%) 0 (0%) 7 (6%) 1 (1%) 0 (0%) 10 (9%) 2 (2%)
[f] 0 (0%) 0 (0%) 36 (33%) 1 (1%) 1 (1%) 69 (63%) 2 (2%) 1 (1%)
[ʒ] 2 (2%) 3 (3%) 2 (2%) 101 (92%) 1 (1%) 0 (0%) 0 (0%) 1 (1%)
[k] 0 (0%) 0 (0%) 0 (0%) 0 (0%) 102(93%) 0 (0%) 8 (7%) 0 (0%)
[p] 0 (0%) 1 (1%) 24 (22%) 0 (0%) 0 (0%) 84 (76%) 0 (0%) 1 (1%)
[t] 0 (0%) 0 (0%) 10 (9%) 2 (2%) 1 (1%) 6 (5%) 90 (82%) 1 (1%)
[v] 0 (0%) 2 (2%) 6 (5%) 1 (1%) 2 (2%) 6 (5%) 1 (1%) 92 (84%)
Legenda: Célula cinza = consoante respondida corretamente como ela mesma
Tabela 1. Matriz de confusão de consoante no ruído branco na relação sinal ruído igual a 0 dB (NS)
Consonant Response
[ʃ] [d] [f] [ʒ] [k] [p] [t] [v]
[ʃ] 53 (48%) 5 (4%) 3 (3%) 13 (12%) 28 (25%) 0 (0%) 8 (7%) 0 (0%)
[d] 0 (0%) 86 (78%) 2 (2%) 7 (6%) 1 (1%) 2 (2%) 12 (11%) 0 (0%)
[f] 0 (0%) 0 (0%) 40 (36%) 1 (1%) 1 (1%) 66 (60%) 0 (0%) 2 (2%)
[ʒ] 2 (2%) 7 (6%) 0 (0%) 96 (87%) 2 (2%) 2 (2%) 1 (1%) 0 (0%)
[k] 0 (0%) 1 (1%) 0 (0%) 1 (1%) 101 (92%) 0 (0%) 7 (6%) 0 (0%)
[p] 0 (0%) 0 (0%) 27 (24%) 2 (2%) 0 (0%) 81 (74%) 0 (0%) 0 (0%)
[t] 1 (1%) 0 (0%) 4 (4%) 0 (0%) 0 (0%) 7 (6%) 96 (87%) 2 (2%)
[v] 0 (0%) 0 (0%) 7 (6%) 0 (0%) 2 (2%) 8 (7%) 2 (2%) 91 (83%)
Legenda: Célula cinza = consoante respondida corretamente como ela mesma
Tabela 3. Matriz de confusão de consoante no ruído festa na relação sinal ruído igual a 0 dB (NS)
Consonant Response
[ʃ] [d] [f] [ʒ] [k] [p] [t] [v]
[ʃ] 71 (64%) 1 (1%) 2 (2%) 21 (19%) 11 (10%) 1 (1%) 1 (1%) 2 (2%)
[d] 2 (2%) 73 (66%) 0 (0%) 12 (11%) 8 (7%) 0 (0%) 15 (14%) 0 (0%)
[f] 0 (0%) 1 (1%) 15 (14%) 0 (0%) 0 (0%) 93 (84%) 0 (0%) 1 (1%)
[ʒ] 2 (2%) 4 (4%) 0 (0%) 103 (94%) 1 (1%) 0 (0%) 0 (0%) 0 (0%)
[k] 0 (0%) 2 (2%) 0 (0%) 0 (0%) 97 (88%) 0 (0%) 11 (10%) 0 (0%)
[p] 0 (0%) 1 (1%) 28 (25%) 0 (0%) 0 (0%) 78 (71%) 0 (0%) 3 (3%)
[t] 0 (0%) 20 (18%) 2 (2%) 1 (1%) 8 (7%) 10 (9%) 67 (61%) 2 (2%)
[v] 1 (1%) 4 (4%) 34 (31%) 2 (2%) 8 (7%) 19 (17%) 3 (3%) 39 (35%)
is a two-dimensional representation, its data were obtained considering a four-dimensional space.
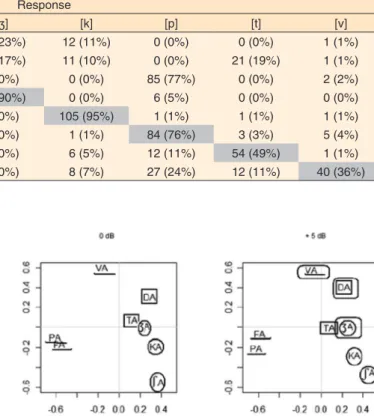
In the perceptual map of the white noise 0 dB (NS) (Figure 1), a division into three groups of consonants (classified from the feature geometry) is observed, which are in the same plane in the perceptual map: 1st) labial consonants ([pa], [d] and [fa]);
2nd) anterior coronal consonants ([ta] and [da]); 3rd) less anterior
coronal consonants and dorsal consonant ([ʃa], [ʒa] and [ka]). Under white noise, in the signal/noise ratio of +5 dB (NS), a division into five groups is observed: 1st) labial consonants
([pa], [va] e [fa]); 2nd) anterior coronal consonants ([ta] and
[da]); 3rd) less anterior coronal consonants and dorsal consonant
([ʃa], [ʒa] and [ka]); 4th) voiced consonants([va], [da] e [ʒa]);
5th) non voiced consonants ([fa], [pa], [ta], [ka], [ʃa]).
The consonants that are nearer in the map are the most confusing ones. There was a considerable confusion between [pa] and [fa] that share five distinctive features(3), namely: [-
sounding , - vocoid , - approximant, - voice, labial] .
Under white noise in the signal/noise ratio of 0 dB (NS), the labial consonants are more confused with the labial consonants, the coronal consonants are more confused with the coronal consonants and the dorsal consonants are more confused with the dorsal consonants. At +5 dB (NS), the confusions are more frequent between the consonants of the same group, and may also occur in relation to voicing (Figure 1).
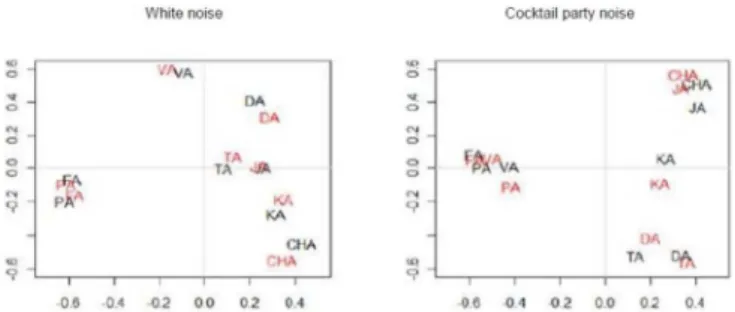
Under cocktail party noise, in the signal/noise ratio of 0 and +5 dB (NS), (Figure 2), a division into four groups is observed in the perceptual map, classified by the distinctive features: 1st)
labial consonants; 2nd) anterior coronal consonants; 3rd) less
anterior coronal consonants and dorsal consonant; 4th) minimal
pairs as to voicing.
Under cocktail party noise it is observed that voicing was not a dimension that stand out to separate large groups, unlike what happened in the confusion caused by the white noise +5 dB. Therewith, the hypothesis of the study that the confusion of consonants can be explained by phonological similarity and would not be affected by the type of noise (Figure 2) was not verified.
Comparing the signal/noise ratios under white noise and cocktail party noise, a slight gap from the consonants in the
signal/noise ratio of +5 dB (NS) is observed, which represents less confusion between the consonants (Figure 3).
Regarding the hypothesis of a relationship between phonological and perceptual similarity, considering the feature geometry, confusions among consonants that share three, four, five and six distinctive features were verified. In the analysis of the sounds that differ by only one distinctive feature – with five and six shared features - (more linguistically similar sounds), it is observed that there is greater confusion between sounds that differ by the features of the consonant point node Tabela 4. Matriz de confusão de consoante no ruído festa na relação sinal ruído igual a +5 dB (NS)
Consonant Response
[ʃ] [d] [f] [ʒ] [k] [p] [t] [v]
[ʃ] 71 (64%) 1 (1%) 0 (0%) 25 (23%) 12 (11%) 0 (0%) 0 (0%) 1 (1%)
[d] 2 (2%) 56 (51%) 0 (0%) 19 (17%) 11 (10%) 0 (0%) 21 (19%) 1 (1%)
[f] 0 (0%) 2 (2%) 21 (19%) 0 (0%) 0 (0%) 85 (77%) 0 (0%) 2 (2%)
[ʒ] 0 (0%) 1 (1%) 4 (4%) 99 (90%) 0 (0%) 6 (5%) 0 (0%) 0 (0%)
[k] 1 (1%) 1 (1%) 0 (0%) 0 (0%) 105 (95%) 1 (1%) 1 (1%) 1 (1%)
[p] 0 (0%) 0 (0%) 17 (15%) 0 (0%) 1 (1%) 84 (76%) 3 (3%) 5 (4%)
[t] 1 (1%) 35 (32%) 1 (1%) 0 (0%) 6 (5%) 12 (11%) 54 (49%) 1 (1%)
[v] 0 (0%) 2 (2%) 21 (19%) 0 (0%) 8 (7%) 27 (24%) 12 (11%) 40 (36%)
Legenda: Célula cinza = consoante respondida corretamente como ela mesma
Note: = labial consonants; = anterior coronal consonants; = less anterior coronal consonants and dorsal consonant; = voiced consonants
Figure 1. Perceptual map of consonants under white noise
Note: = labial consonants; = less anterior coronal consonants and dorsal consonant; = anterior coronal consonants; = minimal pairs differing only by voicing; CHA represents [ʃa]; JA represents [ʒa]
(coronal- [t]-[p], [k]-[t], [f]-[ʃ], dorsal- [k]-[p]), followed by laryngeal node (voicing- [f]-[v], [ʃ]-[Ʒ], [d]-[t] and oral cavity node (continuous- [f]-[p], [ʃ]-[t], [d]-[ʒ]).
The average distance between pairs of consonants as a function of the “number of distinctive features”, “type of noise “and “ signal/noise ratio “ is shown in Figure 4.
Consonants that share more features are perceptually less distant and the difference as a function of the quantity of shared features was significant in the ANOVA (F2,102=6.23,
p=0.0028). Under white noise, the consonants were more far between each other than under cocktail party noise, which shows that the latter produces more confusion between the consonants. This difference also showed to be significant in the ANOVA (F1,102=5.13, p=0.025). Finally, there was no
difference due to the noise level within each type of noise (F2,102=0.015, p=0.984). For this reason, the analysis was
done again, excluding the factor “noise level” resulting in an ANOVA with noise type and feature quantity as independent variables and perceptual distance as dependent variable. In the new analysis, the type of noise (p=0.024) and the amount of distinctive features (p=0.002) had a significant influence on the confusion among consonants.
Finally, the Tukey’s HSD test (post hoc) showed no difference in the perceptual distance between the pairs of
consonants that share three features and pairs that share four features (0.0162, p=0.913). There are significant differences in the perceptual distance between pairs of consonants that share three features and pairs that share five features (0.116, p=0.014) and between pairs of consonants that share four features and pairs that share five features (0.10, p=0.006).
DISCUSSION
Under white noise, in the signal/noise ratio of 0 and +5 dB (NS) - the following confusions were found in greater number: [f] – [p] (differ by the continuous feature), [ʃ] - [k] (in higher level of the feature hierarchy differ by the continuous feature, followed by coronal feature) and [ʃ] - [ʒ] (differ by the voicing feature) -, a confusion between plosive and fricative consonants was observed. This fact can be explained by a study(13), which
reports that noise affects high frequencies, causing confusion in fricative consonants. In the present study, the confusions [p] – [f] and [ʃ] – [k] also revealed a difference in articulation point. The literature(14) shows that the perception of the
articulation point is more impaired under white noise.
The confusion due voicing in [ʃ] - [ʒ] differs from the literature, which reports that the perception of voicing and nasality are features less affected by noise(15,16).
Under cocktail party noise, in the signal/noise ratio of 0 and +5 dB (NS) - the following confusions were found in greater number: [f] - [p] (differ by the continuous feature), [v] - [p] (in higher level in the hierarchy of features differ by voicing, followed by the continuous feature) and [v] - [f ] and [t] - [d] (differ by the voicing feature) - it was realized that the great confusion of the voicing feature under cocktail party noise demonstrates that the voicing feature is more susceptible to this type of noise, causing greater confusion between the consonants that differ by this feature(14,17). However, some authors(18,19)
report that the voicing feature is less affected by this noise than the articulation mode and point features.
Both for white noise as for cocktail party noise, the most frequently confusion was found between [f] and [p]. These consonants share five distinctive features. Considering that [f] is described by six features and [p] is also described by six features, this pair of confusion share a great number of features, differing only by the [continuous] feature, since [f] is [+continuous] and [p] is [-continuous]. Although they differ by the articulation mode, acoustically these sounds present a common transition from F2. Some studies(18,20) found great
confusion between [va] and [ba], which, like the confusion observed in this study ([fa] and [pa]), differ by only one distinctive feature (continuous)(3). The evidence of confusion
of the sound [f] was found in international studies(17,21,22), where
[f] appears among the most confusing consonants of the studies under noise exposure.
The less confusing sounds, both under white noise as under cocktail party noise, in both signal/noise ratios, were [k] and Note: Consonants in red – signal/noise ratio of 0 dB (NS); Consonants in black –
signal/noise ratio of +5 dB (NS); CHA represents [ʃa]; JA represents [ʒa]
Figure 3. Perceptual map comparing the consonants under white noise and under cocktail party noise
Note: B:0 = White noise; SNR=0; B:5 = White noise SNR = + 5; F:0 = Cocktail party noise SNR=0; F:5 = Cocktail party noise SNR= + 5
[ʒ]. Data from the literature(17,21) showed that these sounds
present higher recognition scores when compared to others under noise exposure.
A different confusion pattern regarding the white noise and cocktail party noise was observed, in which the percentage of errors in most cases was higher under cocktail party noise. This finding was observed in both signal/noise ratios of 0 and +5 dB (NS). In a national study(23), a greater difficulty of speech
recognition was evidenced under cocktail party noise. Moreover, an international study(17) observed that the cocktail party noise
masks the consonants in a different way, affecting more the recognition, while the white noise masks the consonants in a uniform way. However, some researchers(14) consider that there
are worse responses in recognition, especially of the articulation point, under white noise.
This difference in recognition of consonants in relation to types of noise can be explained by the acoustic characteristics of each noise. It can be inferred that the greatest difficulty in perception under cocktail party noise should be related to the need for further refinement of the auditory skills, where the subject should forget what was being heard in the noise, only paying attention to the syllables to be heard(24). As only subjects
with results within the indicative patterns of normality were included, i.e., with all characteristics required for the perception of the experimental differences between the consonants, the results cannot be due to systematic effects in the hearing level, either peripheral or central.
Regarding the signal/noise ratio, it was observed less confusion in the signal/noise ratio of +5 dB compared to 0 dB (NS), but this difference was not significant. The compiled studies(14,19,25) reported that, as the signal/noise ratio is positive,
the higher the scores of hits in the perception of consonants. However, in this study, a difference of only 5 dB was not sufficient to cause a significant difference in the scores.
The distance between all consonants was used in the construction of the perceptual map. Both for the white noise as for the cocktail party noise it was possible to organize the consonants in different groups, taking into account the common distinctive features of the consonants that were close in the same plane of the perceptual map. This analysis by grouping the consonants by amount of hits and misses is widely used in the literature(17,18,20,21,26,27). The different groupings as a function
of the type of noise can be explained by the effect of each one at different times of the auditory processing, with the white noise masking all frequencies at a peripheral level, and the cocktail party noise affecting different frequencies in a more central level of the auditory system.
It’s hard to explain, from the feature geometry(7), the
difference observed in the performance of the subjects regarding the types of noise, because the theory considers the behavior of sounds for the hierarchical organization of the features as universal, whatever the environment they are inserted. In other words, regardless of the type of noise, it should be expected
the same behavior in the responses. A possible explanation for this is that the hierarchical organization in features, as it is of phonological order, is not affected by the acoustic characteristics of the noise, being the confusion of consonants and phonological hierarchy of different orders. Therefore, they could not be inferred from each other.
Regarding the distinctive features, it was observed that when the consonants share more distinctive features, the distance between sounds becomes shorter and they are more confused. Considering the sounds that differ by only one distinctive feature (with five and six shared features), it is observed a greater confusion of the features of the consonant point node (coronal: [t]-[p], [k]-[t], [f]-[ʃ], dorsal: [k]-[p]), followed by laryngeal node (voicing: [f]-[v], [ʃ]-[ʒ], [d]-[t] and oral cavity node (continuous: [f]-[p], [ʃ]-[t], [d]-[ʒ]). Regarding the sounds that differ by two features, it was also observed that the confusion affecting the oral cavity node also tends to affect the consonant point node, lower in the hierarchy. These data confirm the following predictions of the feature geometry(7): a) A greater number of confusion
occurs in the lower part of the hierarchy tree of features, in the Consonant Point Node; b) Consonants that share more distinctive features are more confusing.
These are the consequences that could be observed from a more abstract phonological level about the confusion of consonants, which pattern seemed to be more determined by the acoustic nature of the evaluated sounds.
This study showed the importance of studying the perception of the consonants in order to better understand the acoustic, auditory and linguistic aspects that directly interfere in an efficient daily communication. The study reinforced the theory of interference of noises in the auditory perception and the importance of having an adequate auditory processing for better perception of the consonants. The data of the auditory perception provide information that can be useful in the speech rehabilitation of phonetic and phonological processes of speech and auditory perception in patients with hearing loss, and auditory processing disorders, among others. It also revealed that the acoustic aspects of the consonant interfere more in the hearing perception than the phonological aspects, such as proposed in the feature geometry. Furthermore, it showed an association of the perception of Portuguese consonants in noise associated to distinctive features in individuals with normal hearing. This association in Portuguese proved to be scarce in the literature review, in which most studies are of other languages and other phonological analysis.
CONCLUSION
The white noise and the cocktail party noise directly affect the perception of the consonants, although in different ways, and the largest number of errors of the perception of the consonants is found under cocktail party noise.
The feature geometry does not fully explain the confusions among consonants under the different noises that seem to be more influenced by acoustic aspects. However, in some pairs of consonants, there is the prediction that pairs of consonants that share more distinctive features are more confusing, as well as that there is more confusion in the lower part of the hierarchy tree of features, in the consonant point node.
REFERENCES
1. Clements GN. Feature organization. In: Brown K, editor. The Encyclopedia of Language and Linguistics. 2a ed. Oxford: Elsevier; 2006. p. 433-40.
2. Clements GN, Hume E. The internal organization of speech sounds. In: Goldsmith J, editor. Handbook of phonological theory. Oxford: Blackwell; 1995. p. 245-306.
3. Mota HB. Aquisição segmental do português: um modelo implicacional de complexidade de traços [tese]. Porto Alegre: Pontifícia Universidade Católica do Rio Grande do Sul; 1996.
4. Markham D, Hazan V. The effect of talker- and listener-related factors on intelligibility for a real-word, open-set perception test. J Speech Lang Hear Res. 2004;47(4):725-37. http://dx.doi.org/10.1044/1092-4388(2004/055)
5. Davies MG, Yellon L, Purdy SC. Speech-in-noise perception of children using cochlear implants and FM systems. Aust N Z J Audiol. 2001;23(1):52-62. http://dx.doi.org/10.1375/audi.23.1.52.31096 6. Fallon M, Trehub SE, Schneider BA. Children’s perception of speech in multitalker babble. J Acoust Soc Am. 2000;108(6):3023-9. http:// dx.doi.org/10.1121/1.1323233
7. Paula A, Oliveira JÁ, Godoy NM, Canovas MBA. Discriminação de monossílabos em ambiente silencioso e ambiente ruidoso. Braz J Otorhinolaryngol. 2000;66(5):426-31.
8. Lloyd LL, Kaplan H. Audiometric interpretation: a manual of basic audiometry. Baltimore: University Park; 1978.
9. Jerger J. Clinical experience with impedance audiometry. Arch Otolaryngol. 1970;92(4):311-24.
10. Pereira LD, Schochat E. Processamento auditivo central: manual de avaliação. São Paulo: Lovise; 1997.
11. Noruésis MJ. SPSS advanced statistics 6.1. 3a ed. Chicago: SPSS; 1994.
12. Leeuw J, Mair P. Multidimensional scaling using majorization: SMACOF in R. J Stat Softw. 2009;31(3):1-30.
13. Bell TS, Dirks D, Carterette EC. Interactive factor in consonant confusion patterns. J Acoust Soc Am. 1989;85(1):339-46. http://dx.doi. org/10.1121/1.397685
14. Alm M, Behne DM, Wang Y, Eg R. Audio-visual indentification of place of articulation and voicing in white and babble noise. J Acoust Soc Am. 2009;126(1):377-87. http://dx.doi.org/10.1121/1.3129508
15. Miller GA, Nicely PE. An analysis of perceptual confusions among some English consonants. J Acoust Soc Am. 1955;27(2):338-52. http:// dx.doi.org/10.1121/1.1907526
16. Wang MD, Bilger RC. Consonant confusion in noise: a study of perceptual features. J Acoust Soc Am. 1973;54(5):1248-66. http://dx.doi. org/10.1121/1.1914417
17. Phatak SA, Allen JB. Consonant and vowel confusions in speech-weighted noise. J Acoust Soc Am. 2007;121(4):2312-26. http://dx.doi. org/10.1121/1.2642397
18. Woods DL, Yund EW, Herron TJ, Malthew A, Ua Cruadhlaoich. Consonant identification in consonant-vowel-consonant syllables in speech-spectrum noise. J Acoust Soc Am. 2010;127(3):1609-23. http:// dx.doi.org/10.1121/1.3293005
19. Benkí JR. Analysis of English nonsense syllable recognition in noise. Phonetica. 2003;60(2):129-57. http://dx.doi.org/10.1159/000071450 20. Li F, Menon A, Allen JB. A psychoacoustic method to find the perceptual cues of stop consonants in natural speech. J Acoust Soc Am. 2010;127(4):2599-610. http://dx.doi.org/10.1121/1.3295689
21. Phatak SA, Yoon Y, Gooler DM, Allen JB. Consonant recognition loss in hearing impaired listeners. J Acoust Soc Am. 2009;126(5):2683-94. http://dx.doi.org/10.1121/1.3238257
22. Dubno JR, Levitt H. Prediciting consonant confusions from acoustic analysis. J Acoust Soc Am. 1981;69(1):249-61. http://dx.doi. org/10.1121/1.385345
23. Caporali AS, Silva JA. Reconhecimento de fala no ruído em jovens e idosos com perda auditiva. Rev Bras Otorrinolaring. 2004;70(4):525-32. http://dx.doi.org/10.1590/S0034-72992004000400014
24. Pereira LD. Sistema auditivo e desenvolvimento das habilidades auditivas. In: Ferreira LP, Befi-Lopes DM, Limongi SCO, editores. Tratado de fonoaudiologia. São Paulo: Roca; 2005. p.547-552.
25. Li N, Loizou PC. Factors influencing intelligibility of ideal binary-masked speech: implications for noise reduction. J Acoust Soc Am. 2008;123(3):1673-82. http://dx.doi.org/10.1121/1.2832617
26. Soli SD, Arabie P, Carroll JD. Discrete representation of perceptual structure underlying consonant confusion. J Acoust Soc Am. 1986;79(3):826-37. http://dx.doi.org/10.1121/1.393473