70
TEMPORAL VARIABILITY OF PRECIPITATION
INDICES AT A RAINGAUGE STATION IN PORTUGAL
Maria João Guerreiro
professora Auxiliarfaculdade de ciências e tecnologia - ufp [email protected]
Isabel Abreu
professora Auxiliarfaculdade de ciências e tecnologia - ufp [email protected]
Teresa Lajinha
professora Auxiliarfaculdade de ciências e tecnologia - ufp [email protected]
71
RESUMO
o objectivo deste estudo é avaliar variações nos índices de precipitação (precipitação total, intensidade, frequência, duração de dias secos e dias húmidos), que possam ser afectados por alterações climáticas numa estação udométrica, chouto, no período de 1912-2007. nes-sa estação não se observam variações significativas na precipitação anual no último século, o aumento de precipitação que se observa em outubro é compensado pela diminuição da precipitação em março. em outubro verifica-se um aumento de dias húmidos consecutivos e em março uma diminuição dos mesmos e um aumento de dias secos consecutivos.
PALAVRAS-CHAVE
Alterações climáticas, índices de precipitação, períodos secos, períodos húmidos.
ABSTRACT
the objective of this study is to provide insight on variations of precipitation indices (total precipitation, intensity, frequency, duration of wet and dry spells), that may be affected by climate change at a local raingauge station, chouto, in the period of 1912-2007. While no significant changes in precipitation totals were observed annually within the last century, the precipitation increase observed in the month of october is compensated by a precipi-tation decrease in march. Also in october, there has been an increase in the length of wet spells, whereas a decrease of these is observed in march, which also shows an increase in length of dry spells.
KEYWORDS
72
1.
INTRODUCTION
there is evidence that water resources may be affected by climate change, based on ob-servational records and climate projections, and that it will also affect human societies and ecosystems (bates et al., 2008).
changes in mean and extreme values of precipitation will impact river flows, lake and wetland levels, and evaporation. more intense precipitation events will affect agriculture by damaging crops, increasing soil erosion, and contaminating surface and groundwater, which may increase the risk of diseases and may include loss of property. on the other hand, an increase in drought events may lead to lower yields and possible failure in agri-culture and livestock development and consequent food and water shortage, increase of wildfires, and also loss of property. integration of information on climate variability into water resources management would help to adapt to longer-term climate change im-pacts (bates et al., 2008).
the ccl/cliVAr/jcomm expert team on climate change Detection and indices (cliVAr ho-mepage) published a series of indices for characterization of climate variability and change, of which eleven are related to precipitation. these indices were explored by other authors and further developed.
nicholls et al. (2000) examined three indices of extreme rainfall: extreme intensity - average intensity of rain falling above the long-term 95th percentile; extreme frequency - number of
precipitation events above the long-term 95th percentile; and extreme percent - proportion
of total rainfall falling above the long-term 95th percentile. they suggest that the extreme
intensity incorporates changes in all events above the upper percentiles, and if the number of wetdays changes equally over all intensities, the extreme intensity will not change.
in a study developed by nicholls et al. (2000), the results did not provide strong evidence of climate becoming more extreme or variable, although they point out that significant chan-ges could possibly occur at a regional level.
According to the climate change and Water report (bates et al., 2008), several studies indicate that southern europe is more sensitive to climate change than the northern part. Although precipitation increased, in general, over the 20th century between 30ºn and 85º n, southern europe is expected to become warmer and drier with impacts on preci-pitation patterns, intensity and extremes which may lead to changes in soil moisture and runoff (eeA, 2008).
Although precipitation decreases have been observed, an increase in heavy precipitation events has also been verified in europe (Klein tank and Können, 2003), with stronger incre-ases in the cool season (bates et al., 2008). Wet extremes will be more severe where precipi-tation increases, and dry extremes will be more severe where mean precipiprecipi-tation decreases (bates et al., 2008).
73
A significant decrease in winter rainfall was observed on the iberian peninsula during thesecond half of the 20th century (bustins et al., 2008), whereas an increase in precipitation
intensity and variability, frequency of heavy precipitation events, is expected to increase the risk of flood and drought.
lima et al. (2005) revealed that the annual precipitation series for nine stations in portugal show no trend. however, at the monthly level, there is a decreasing tendency in the rainfall of march and november, which is compensated by an increase in December and january, although not significant.
An increase in the frequency of heavy precipitation events was observed by nastos and Zerefos (2009) in greece, whereas, drought events have increased in most european regions during the last decades in frequency, duration, or intensity. nastos and Zerefos (2009) have analyzed the dry and wet spells based on the largest number of consecutive dry or wet days, respectively, and concluded that the variability of wet spells shows significant negative trends.
moberg and jones (2005) analyzed precipitation data from approximately 80 stations in cen-tral and Western europe and determined a significant increase in precipitation in the winter as far as average precipitation intensity and moderately strong events are concerned. the length of dry spells also showed an increasing tendency, although not significant. costa et al. (2008) have detected an increase in the annual frequency of dry events, and a decrease in the frequency of heavy precipitation events, in southern portugal, although both not sta-tistically significant.
the objective of this study is to provide insight on variations of precipitation indices (total precipitation, intensity, frequency, duration of wet and dry spells), that may be affected by climate change at a local raingauge station.
2.
DATA AND METHODS
2.1.
DATA
74
Fig. 1. location of chouto raingauge.
A homogeneity test was performed on the annual data using the shapiro-Wilk parametric hypothesis test of composite normality with a significance level of 5%.
the number of days with missing data was evaluated for the chouto daily precipitation time series and a total of six missing days (one in march and two in november of 2003 and three in january of 2004) were detected, emphasizing the good quality of the data set.
2.2.
THE SET OF EXTREMES INDICES
extreme frequency indexes used in this study were related to total number of days, and associated precipitation above or below a certain threshold, their relative value (intensity), and duration of dry and wet spells. these indices were further analyzed for trends in extreme rainfall: intensity, frequency and respective relative values (table 1).
Rx1day Monthly maximum 1-day precipitation:
Rx5day Monthly maximum consecutive 5-day precipitation
SDII Simple daily intensity index
Npj Annual count of days with precipitation ≥ Pp or Annual count of days with
75
Ppj Annual/monthly total precipitation when precipitation ≥ Pp
PINTp Annual average intensity for precipitation ≥ Pp
CDD Annual/monthly maximum length of dry spell, maximum number of consecutive days with rainfall < 1mm
CWD Annual/monthly maximum length of wet spell, maximum number of consecutive days with RR ≥ 1mm
PTOT Annual total precipitation in wet days
j – period in analysis
RRij - daily precipitation amount on day i in period j
RRkj - precipitation amount for the 5-day interval ending day k, in period j RRwj - daily precipitation amount on wet days, w (RR ≥ 1mm) in period j.
W - number of wet days
p - user defined threshold (5, 10, 25, 75, 90, and 95th percentiles)
Pp- precipitation ≤ 5, 10, 25 percentiles or precipitation ≥ 75, 90, 95 percentiles
Table 1. extreme indices used in the study.
percentiles of daily precipitation rather than a fixed value are often used to evaluate extreme precipitation events, due to the spatial variation of rainfall intensity (bates et al., 2008). per-centiles were evaluated using all data set.
extreme frequency indexes were calculated at different cut-offs - 5th, 10th, 25th, 75th, 90th and
95th percentiles rather than a fixed threshold (nicholls, 2000, bates et al., 2008), both annually
and monthly. seasonality was accounted for by examining the indexes on a monthly basis (silva et al., 2009).
2.3.
TREND ESTIMATION METHODS
A linear trend was evaluated using regression analysis on indexes for both the monthly and annual time series. the correlation coefficient, slope and its significance (p-value) were esti-mated for all indexes.
76
3.
RESULTS AND DISCUSSION
3.1.
PTOT – TOTAL PRECIPITATION
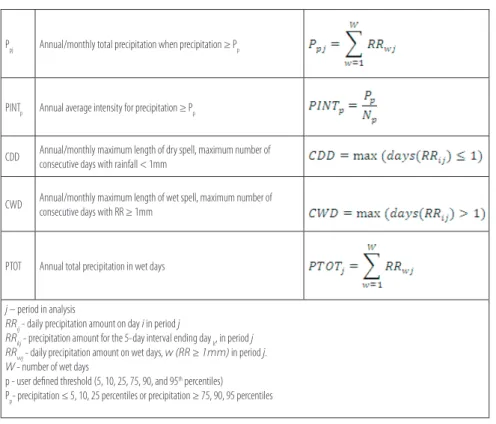
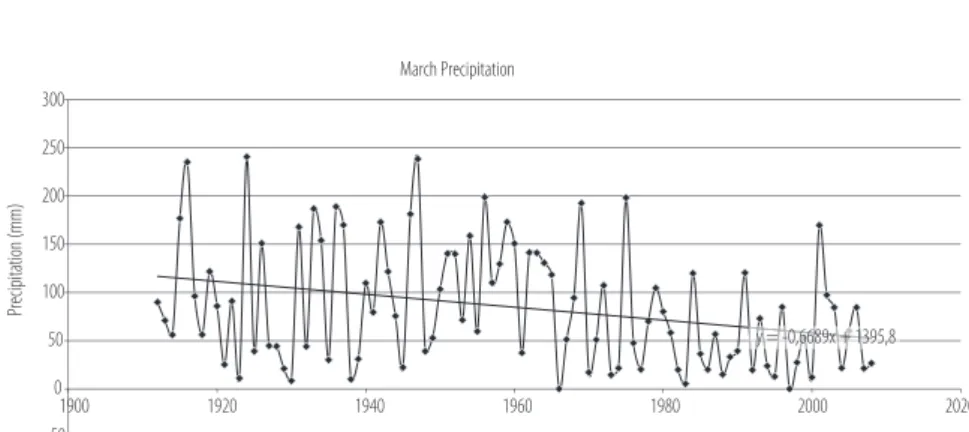
Annual total precipitation (hydrologic years) do not show a significant linear trend (figure 2) during the period in analysis (p-value=0.94), with an average value of 724 mm. results of the t-test for the first half of the period and the second half show no significant difference (p-value=0.89), nor does the f-test for analysis of variance (p-value=0.36). the month of march shows a significant decrease (figure 3) in total precipitation (p-value=0.003), whereas the month of october shows a significant increase (figure 4) (p-value=0.03). All other months show no significant trend during the period in analysis.
Fig. 2. Annual precipitation time series.
77
Fig. 4. october precipitation time series.
3.2.
Rx1day
– MAXIMUM DAILY PRECIPITATION
the maximum annual daily precipitation has a significant positive trend (p-value=0.003) with a slope of 0.19 mm.year-1, as well as a significant difference between the first and
se-cond halves of the series (39.0 mm and 50.7 mm , respectively – p-value=0.001), represen-ting a 30% increase. however, the only month in which there is a significant increase in maximum daily precipitation is october (p-value=0.002) with a slope of 0.212 mm.year-1,
and a difference between the first and second halves of the series (18.7 mm and 30.2 mm, respectively – p-value=0.002), representing a 61% increase in maximum daily precipitation.
3.3.
Rx5day
– MAXIMUM 5-DAY PRECIPITATION
it is the month of march that shows a significant (p-value=0.04) decrease in maximum con-secutive 5-day precipitation with a slope of -0.2124 mm.year-1, while october shows a
sig-nificant increase (p-value=0.006) with a slope of 0.3183 mm.year-1. the first and second half
of the series show significant differences, in average, for both march (46.9 and 32.1 mm, respectively - p-value=0.007) and october (42.3 and 51.7 mm, respectively - p-value=0.011), representing a 32% decrease in maximum consecutive 5 days precipitation in the month of march and a 22% increase in the month of october.
3.4.
SDII
– SIMPLE DAILY INTENSITY INDEX
the simple intensity index does not show a significant linear trend during the period in analysis at a 5% significance level, although a difference is observed between the first and second halves of the series in the month of march (9.1 mm/day and 8.1 mm/day, respective-ly – p-value=0.012), representing a 11% decrease in the intensity of precipitation.
3.5.
N
pand P
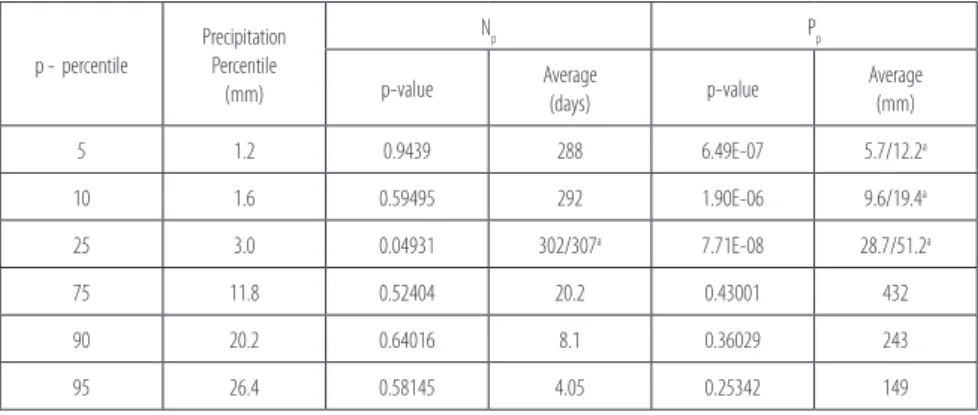
p– NUMBER OF DAYS AND PRECIPITATION
precipitation and number of days with precipitation below the 25th percentile, increase
sig-nificantly. A significant increase is also observed for total precipitation below the 5th and 10th
78
p - percentile
Precipitation Percentile
(mm)
Np Pp
p-value Average
(days) p-value
Average (mm)
5 1.2 0.9439 288 6.49E-07 5.7/12.2a
10 1.6 0.59495 292 1.90E-06 9.6/19.4a
25 3.0 0.04931 302/307a 7.71E-08 28.7/51.2a
75 11.8 0.52404 20.2 0.43001 432
90 20.2 0.64016 8.1 0.36029 243
95 26.4 0.58145 4.05 0.25342 149
Table 2. np and pp statistics. a – average 1912-1959/1960-2007
heavy rain (75th percentile and above) has not significantly changed in the last century. only
four days have precipitation above 26.4 mm, eight days above 20.2 mm and twenty days above 11.8 mm.
3.6.
PINTp
– PRECIPITATION INTENSITY
the comparative analysis between the first and second halves of the precipitation intensity series show a significant difference in average values on the 5th, 10th, and 25th precipitation
percentiles with average values presented in table 3.
Percentile
Precipitation Percentile
(mm)
Precipitation intensity (mm/day)
% increase p-value
1912-1959 1960-2007
5 1.2 0.02 0.04 119 3E-06
10 1.6 0.03 0.06 106 1.5E-07
25 3.0 0.09 0.17 76 9E-11
75 11.8 21.1 0.67
90 20.2 29.5 0.71
95 26.4 36.6 0.37
Table 3. precipitation intensity statistics.
79
3.7.
CDD - CONTINUOUS DRY DAYS
Annual continuous dry days do not show a significant linear trend during the period in analysis, with an average value of 60 days. results of the t-test when comparing the first half of the period and the second half, show no difference (p-value=0.5), nor does the f-test for analysis of variance (p-value=0.5).
upon analysis of monthly cDD, the only month that shows a significant increase is march (p-value= 0.014), with a slope of 0.06 days/year. the first and second half of the series show significant differences in both average (11.2 and 14.0 days, respectively - p-value=0.024) and variances (p-value=0.036), representing a 20% increase in number of continuous dry days in the month of march.
on the other hand, october shows a significant decrease at 10% significance level (p-va-lue=0.077) with a slope of -0.0425 days/year. Although the variance shows no significant difference on both halves of the series, the average is significantly different (14.8 and 12.1 days, respectively - p-value=0.047, representing a 18% decrease in number of continuous dry days in the month of october).
3.8.
CWD - CONTINUOUS WET DAYS
Annual cWD significantly decreased over the 1911-2007 period (p-value=0.007) with a slope of -0.033 days/year. upon comparison of the first and second halves of the series (average of 10.6 and 9.3 days, respectively) there is a significant difference at the 10% significance level (p-value=0.06), representing a 12% decrease in number of continuous wet days.
cWD shows a significant decrease (p-value=0.011) in the month of march (5.8 and 4.0, res-pectively), representing a 31% decrease in the number of continuous wet days in the month of march.
there is no evidence of trends in annual precipitation in the region of chouto, in accordance with the global historical climatology network from 1901 to 2005 (bates et al., 2008) and lima et al. (2005) for the iberian peninsula even though Klein tank and Können (2003) and bates et al. (2008) expect southern europe to become drier. nevertheless, precipitation has decreased in the month of march as also identified by norrant and Douguédroit (2006) for the mediterranean, and increased in the month of october.
80
4.
CONCLUSIONS
While no significant changes in precipitation totals are observed annually within the last century, the precipitation increase in october is compensated by a precipitation decrease in march, and also the wet semester (october-march) begins wetter for longer periods (wet spells) and ends drier also for longer periods (dry spells), immediately before the beginning of the dry semester (April-september).
october is wetter, has higher intensity rainfall events, and longer wet spells. march is drier, longer dry spells and shorter wet spells along with less intense rainfall events.
total precipitation for smaller events has increased, as well as their intensities, implying that more precipitation occurs at the smaller events with an opportunity to increase availability in soil moisture storage.
BIBLIOGRAPHY
BATES, B.C., KUNDZEWICZ, Z.W., WU, S., PALUTIKOF, J.P. (eds.). (2008). Climate Change and Water. technical paper of the intergovernmental panel on climate change, ipcc secretariat, geneva, 210 pp.
BUSTINS, J.A., VIDE, J.M., LORENZO, A.S. (2008). iberia Winter rainfall trends based upon changes in teleconnection and circulation patterns. In: Global and Planetary Change, 63, pp. 171–176.
CLIVAR HOMEPAGE [ON LINE]. AVAILABLE AT: HTTP://CCCMA.SEOS.UVIC.CA/ETCCD-MI/LIST_27_INDICES.SHTML [CONSULTED JUNE 9TH 2009].
COSTA, A.C., DURãO, R., SOARES, A., PEREIRA, M.J. (2008). A geostatistical exploratory Analysis of precipitation extremes in southern portugal. In: REVSTAT – Statistical Journal 6, pp. 21–32.
EEA. (2008). Impacts of Europe’s Changing Climate — 2008 Indicator-Based Assessment. eeA report no 4/2008, european environment Agency, copenhagen, Denmark.
KLEIN TANK, A. M., KONNEN, G. P. (2003). trends in indices of Daily temperature and preci-pitation extremes in europe, 1946–99. In: American Meteorological Society, november 2003, pp. 3665-3680.
LIMA, M.I., MARQUES, A.C., LIMA, J.L. (2005). Análise de tendência da precipitação Anual e mensal no período 1900-2000, em portugal continental. In: Territorium, 12/2005, pp. 11-18. MOBERG, A., JONES, P.D.(2005). trends in indices for extremes in Daily temperature and precipitation in central and Western europe, 1901–99. In: Int. J. Climatol, 25, pp. 1149–1171. NASTOS, P.T., ZEREFOS, C.S. (2009). spatial and temporal Variability of consecutive Dry and Wet Days in greece. In: Atmospheric Research. in press. doi: 10.1016/j.atmosres.2009.03.009 NICHOLLS, N., TREWIN, B., HAYLOCK, M. (2000). Climate Extremes - Indicators for State of the Environment Monitoring Bureau of Meteorology Research Centre. Department of the environ-ment and heritage, melbourne.
NORRANT, C.,DOUGUéDROIT, A. (2006). monthly and Daily precipitation trends in the me-diterranean (1950–2000). In:Theor. Appl. Climatol., 83, 89–106.