The use of GPR for characterizing underground weathered
profiles in the sub-humid tropics
Paulo Roberto Antunes Aranha
a,*, Cristina Helena Ribeiro Rocha Augustin
b,1,
Frederico Garcia Sobreira
c,2aPrograma de Po´s-graduacßa˜o, Departamento de Geologia, Escola de Minas, Universidade Federal de Ouro Preto, Ouro Preto, MG, Brazil
b
Centro de Pesquisa Manoel Teixeira da Costa, Instituto de Geocieˆncias, Universidade Federal de Minas Gerais, Belo Horizonte, MG, Brazil c
Departamento de Geologia, Escola de Minas, Universidade Federal de Ouro Preto, Ouro Preto, MG, Brazil
Received 19 October 2000; accepted 30 January 2002
Abstract
Ground penetrating radar (GPR) has been used as a tool to access information about ground subsurface features. Such information is very important for different types of studies, varying from those related to archeological research to those studying geological elements of bedrock. More recently, however, GPR has been increasingly applied to environmental studies, especially for soil research. This paper presents the results of an application of GPR for the study of weathered profiles. GPR was used to discover the degree of trustworthiness of the information on the ground subsurface through the interpretation of the results of the radar sections as well as the data collected from boreholes, which reached until 21 m. The results show a relatively high degree of details obtained by GPR, indicating the possibility of speeding up ground subsurface surveys related to
geomorphological, geological, and pedological studies.D2002 Elsevier Science B.V. All rights reserved.
Keywords:Geophysics; GPR; Hollow; Geomorphology; Weathered profile
1. Introduction
The use of geophysical methods has increased in the last 3 decades, following the advances of digitized technology. One of the geophysical methods used to
investigate the ground subsurface with good resolu-tion is ground penetrating radar (GPR). GPR profiling is similar to seismic reflection surveying but is based on the propagation and reflection of electromagnetic wave. Reflections on GPR wave are produced by changes in the dielectric properties of the strata, providing high-resolution data of the subsurface. Its use varies from mineral prospecting to problems related to underground water contamination (Davis and Annan, 1989). The use of GPR for different pur-poses is well documented by a wide range of applica-tions, such as stratigraphic mapping (Davis and Annan, 1989; Fisher et al., 1992; Young and Sun, 1999), archeology (Vaughn, 1986; Imai et al., 1987; Stove
0926-9851/02/$ - see front matterD2002 Elsevier Science B.V. All rights reserved.
PII: S 0 9 2 6 - 9 8 5 1 ( 0 2 ) 0 0 1 2 3 - 4
* Corresponding author. Department of Geology, IGC-UFMG,
Av. Antoˆnio Carlos 6627, Campus da Pampulha, cep: 31.270-90, Belo Horizonte, MG, Brazil. Fax +55-31-34995410.
E-mail addresses:[email protected] (P.R.A. Aranha),
[email protected] (C.H.R.R. Augustin), sobreira@degeo. ufop.br (F.G. Sobreira).
1
Fax: + 55-31-34995410.
2
Fax: + 55-31-35514539.
and Addyman, 1989; Sternberg and McGill, 1995; Nobes, 1999); environmental contamination (Davis and Annan, 1989; Lawton and Jol, 1994); the determination of permafrost thickness (Arcone and Delange, 1987; Fisher et al., 1989); groundwater (Harari, 1996); and the determination of soil aspects (Collins and Doolittle, 1987; Kung and Lu, 1993; Doolittle and Collins, 1995). However, the applica-tion of GPR to studies of the weathered profiles, including soil developed over colluvium or alluvium and saprolite, from the geomorphological point of view, has not been widely used until now. One of the aspects which makes this type of application difficult can be related to the fact that highly conductive materials are essentially radar-opaque which is what attenuates radar signal. This applies to the experimental GPR studies conducted by Cook (1973), Collins et al. (1990) and Bristow (1994), among others, with soils from temperate climates. For Doolittle and Collins (1998), the use of GPR has been most successful in areas of: (a) sandy soil materials, (b) highly weathered soils, and (c) soils underlain by crystalline bedrock. It applies especially to weathered mantle study of the sub-humid tropics, such as those found in about two-thirds of the Brazilian territory.
The use of GPR can, therefore, decrease the requirement of carrying out such an extensive tradi-tional geomorpho – pedological approach in which so many profiles of the ground subsurface need to be opened. Through a ‘‘control’’ pit, GPR can provide information that is important to improve the analysis of the subsurface features.
It is also important to call attention to the fact that data about the subsurface physical characteristics of the slope are, in general, scarce. One of the related problems is the fact that it is difficult to accurately obtain and access this type of information without opening a relatively dense sequence of boreholes. In the present study, the opening of such boreholes was carried out only as a means of supporting the geo-physical interpretation and of testing its degree and level of trustworthiness.
The purpose of this study is the identification of such subsurface structures in the ground material of a sub-humid tropical area by using GPR. The character-istics of this mantle play an important role in deter-mining the erosion process. To provide subsurface
data, in order to study erosive processes using a geophysical tool, an area with a hollow in which a gully has developed was selected.
2. Geological and geomorphological setting
The GPR sections were made along a spur and across a hollow of a slope in the study area, located in Gouveia, which is a sub-humid tropical region in Minas Gerais, Brazil (Fig. 1).
The hollow occurs in a zone of geological contact, where granite – gneiss rocks from the crystalline base-ment and schist from Rio Parau´na Supergroup are exposed due to the erosion of the quartzitic formations of the Espinhacßo Supergroup. Basic and metabasic rocks are also present as intrusions cutting all other lithologies. The region went through intense tectonic shearing during the Pre-Cambrian generating faulting systems with an E – W dip and N – S strike. Faulting with approximate E – W direction is very frequent, especially in the contact zone between schist of the Costa Sena Group (Rio Parau´na Supergroup) and the predominating quartzite of the Espinhacßo Supergroup (Almeida-Abreu, 1993; Dussin, 1994).
The gully, occurring at the bottom of the hollow (Fig. 2), is located on the ‘‘reworked erosional sur-face’’ (Augustin, 1995), dominated by granite – gneiss of the crystalline basement and schist of the Costa Sena Group. The area has an undulating relief char-acterized by convex slopes with an average gradient of 8j. Schist of the Rio Parau´na Supergroup, in some slopes, covers the granite – gneiss rocks of the base-ment. The occurrence of gullies in the area is restricted to slopes developed on the terrain over those two underlying rocks, or on the regolith developed over mylonite found in some of their contacts.
The process of gully development is intense in this region and it shows a close relationship with the soil use and occupation as well with the geological and geomorphological characteristics of the region (Augustin, 1995, 1999). Other studies carried out in the area, indicate however that other factors related to the slope evolution could be associated to the readiness of those soils to gully erosion too. Figueir-edo et al. (1999), for instance, showed that the presence of iron alters the behaviour of clay, induc-ing clay agglutination. In field conditions, these P.R.A. Aranha et al. / Journal of Applied Geophysics 49 (2002) 195–210
particles tend to behave as silt or fine sand, which seems to alter the hydrological capacity of the water to carry soil particles, triggering the formation of piping.
3. Methodology
A GPR survey was carried out along a 300 m long transection on a slope with an average declivity of 7j,
Fig. 1. Geologic map of the study area and the localization of the hollow (after Comig-Companhia Mineradora do Estado de Minas Gerais, 1997).
Fig. 2. View of the hollow, the survey lines, the position of the weathered profiles: borehole (P 1 – 5), and the contour of the gully (right side).
located in the Co´rrego do Chiqueiro Basin (Fig. 2). The directions and geometry of the survey are showed in Fig. 2. Survey 1, named radar section 1 (RS-1), was done from top to lower slope, not including the terraces. Surveys 2 and 3 were carried out perpendic-ular to the first one, but parallel to each other, and were named RS-2 and RS-3, respectively. RS-2 was located on the top of the slope and it begins 50 m before RS-1. RS-3 was done across the hollow; it crosses RS-1 at 10 and 90 m from the beginning of RS-1.
Slope profile and the altimetric levels of the other two survey lines were obtained by using an engineer’s level at regular 5-m interval.
The GPR survey was accompanied by the sam-pling of five ground profiles, including soil and the weathered material, four of them located on the top, upper, middle, and lower slope following the true slope. The other was placed perpendicular to the former one, accompanying the hollow depression. The profiles were opened with a mechanical gauge reaching till 21 m in depth, and samples were col-lected at regular intervals of 30 cm of depth. The color of the material was determined using a Munsell color chart, while texture and pH were determined in the laboratory using standardized procedures of the ‘‘Empresa Brasileira de Pesquisa Agropecua´ria’’ (EMBRAPA).
A Ramac system, of MalaGeoscience, with 50- and 100-MHz antennae was used. The depth of penetra-tion and the resolupenetra-tion are related to the central an-tenna frequency (Davis and Annan, 1989; Jol, 1995; and others). In this survey the penetration reached approximately 12 m with 100-MHz antennae and 25 m with 50-MHz antennae. Common midpoint (CMP) split-spread profiles were recorded to obtain subsur-face EM-wave velocities. The calculated average velocity was used to convert the two-way travel time into depth section. The radar profiles were acquired using the common offset mode, that is, keeping the antennae at constant source – receiver separation by using the same interval between successive measure-ment points. The antennae were oriented parallel to each other with the E-plane of the dipoles perpendic-ular to the survey line. For these surveys, a 0.50-m step size for 50-MHz antennae was used with a Trans-mitter – Receiver (T – R) separation of the 2.0-m and 0.25-m step size for 100-MHz antennae with T – R separation of 1.0 m. In order to increase the signal to
noise ratio, the returns of 32 separate pulses were stacked to produce each trace recorded.
The GPR raw data were processed using the software Gradix (Interpex), a DOS/Windows-based program. The finite sampling frequency of the receiver can introduce low-frequency noise into the signal, as well as inductive effects of the electronic devices. The filter ‘‘dewow’’ removes this noise. The data were also filtered with Gaussian amplitude spec-trum with constant phase specspec-trum. The automatic gain control (AGC) was used and the window was dependent on the time gap between the target reflec-tors. The elevation correction and depth conversion were applied using the subsurface velocity obtained from the CMP profile, which was averaged from four CMP profiles — 85 m/As. All sections were migrated
through the Gradix software, with the method avail-able:F–Kmigration, using the velocity field obtained with the CMP’s profiles. All radar sections have ‘‘elevation’’ at left border and a ‘‘reference time’’ at right border as vertical scales. This reference time was used because of the great changes in topographic levels. The two-way travel time of any desired level for specific position can be obtained, with the help of the reference time scale, subtracting the value of the time, at that level, from the value of the time of this same position at top of radar section.
4. Results
The information obtained from the holes of ground profiles (sample description and laboratory analysis) opened along the RS-1 (P1 to P4) allowed to establish a straight correlation with GPR’s section. The RS-1 section was done following the true slope with anten-nae of 50 MHz (Fig. 3), which has enabled us to interpret several subsurface structures in the slope.
The reflector ‘‘A’’ in this section corresponds to the colluvium/saprolite contact. The identification of this contact is better showed in Fig. 4, represented by the RS-1 surveyed with the 100-MHz antennae. The reflector ‘‘B’’ (Figs. 3 and 4) indicates the internal changes in the texture of the weathered profile, con-firmed by the results of laboratory analysis, which showed that the upper part is a loam and the lower part a sandy loam material, while the reflector ‘‘C’’ shows the internal changes in the saprolite texture P.R.A. Aranha et al. / Journal of Applied Geophysics 49 (2002) 195–210
Fig. 3. Radar section 1 (RS-1), along the slope, obtained with 50-MHz antennae; gain: AGC window 60 ns, vertical exaggeration: 2:1.
P.R.A. Aranha et al. / Journal of Applied Geophysics 49 (2002) 195–210
202 – 204
from sandy loam to silt loam. These features can even be better identified in Fig. 4. Region ‘‘D’’ (Fig. 3) corresponds to the reflections from the silty loam material, where the reflectors, nearly horizontal, are interrupted by the two main fracture systems. Several fractures/faults occur between the distances of 40 and 120 m. In this region, the reflector ‘‘E’’ is interpreted as the contact between the silty loam and the sandy loam materials. The continuity of this section, as can be seen in Fig. 3, is interrupted near the region ‘‘G’’, where the reflectors are more continuous and inclined than in the previous one. The change of slope decliv-ity, measured during the field work, occurring at about 150 m downslope, can be remarkably well detected by internal changes in the subsurface structures repre-sented mainly by the presence of fractures and the flexion of the reflector ‘‘F’’. Beneath the surface at this point, the reflectors are horizontal and are inter-preted as indicating the presence of colluvium. Imme-diately under the colluvium, the reflectors are truncated and inclined, and the fractures are interrup-ted by the contact between the colluvium and the saprolite, which has also been confirmed by data obtained with the opening of the borehole (P2). Around the distance of 162 m, ringing reflectors are detectable (‘‘N’’ region) due to the reflection of the EM-wave on the fence located perpendicularly to the transect. From 180 to 300 m, the RS-1 shows, on the upper part, reflectors that are inclined and underlayed by (sub)horizontally reflectors ‘‘O’’ and ‘‘P’’. The (sub)horizontally reflectors seem to be either
associ-ated to internal changes of the weathered mantle structure, or to the occurrence of an imbricate slice due to regional shear stress pattern of the Espinhacßo Pre-Cambrian tectonic (Almeida-Abreu, 1993). At about 300 and 320 m, a curved reflector occurs under a topographic breakdown, suggesting that the feature is a scar of a rotational slump. Below this region a (sub)horizontal reflector was observed, which can be interpreted as reflection due to internal changes of the weathered mantle structure, which narrows down-ward. Using the data interpreted from the radar sections and the data available from the boreholes 1 – 4, it was possible to compose the 2D geomorpho-logical model for the slope (Fig. 5).
Two aspects are important in this geomorpholog-ical model besides the model itself. First, the deter-mination of the contact between two internal characteristics of the weathered material, on the left side of the section. The dotted line represents the occurrence of a silt loam horizon in the upper part and a sandy loam sequences in the lower part, which indicates the possibility of detecting through GPR, major changes of texture within the weathered mate-rial sequence. This interpretation is based on the description of boreholes P1 and P2, and on the reflector pattern of the radar section in this zone. The second aspect is the occurrence of a much more sandy material, which is represented by the second dotted line, showing an abrupt internal change in the material characteristics, interpreted through the radar section and the description of boreholes P3 and P4.
Fig. 4. Radar section 1, 50-m downslope, obtained with 100-MHz antennae; gain: AGC window 50 ns, vertical exaggeration: 1.5:1.
Fig. 7. 2D geomorphological model, based on RS-2 surveyed with 100-MHz antennae.
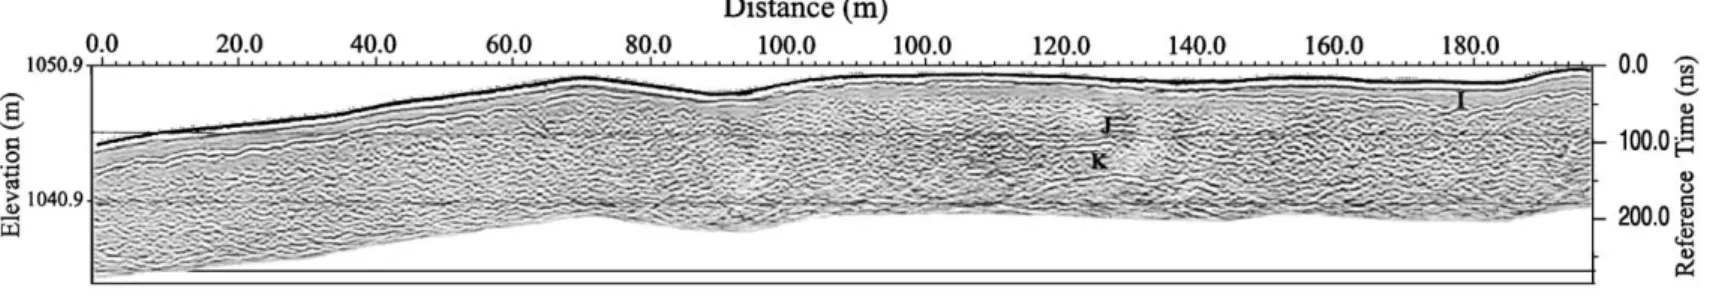
Fig. 6. Radar section 2 (RS-2), upper hollow, obtained with 100-MHz antennae; gain: AGC window 68 ns, vertical exaggeration: 2:1.
P
.R.A.
Aranha
et
al.
/
Journal
of
Applied
Geophys
ics
49
(2002)
195–210
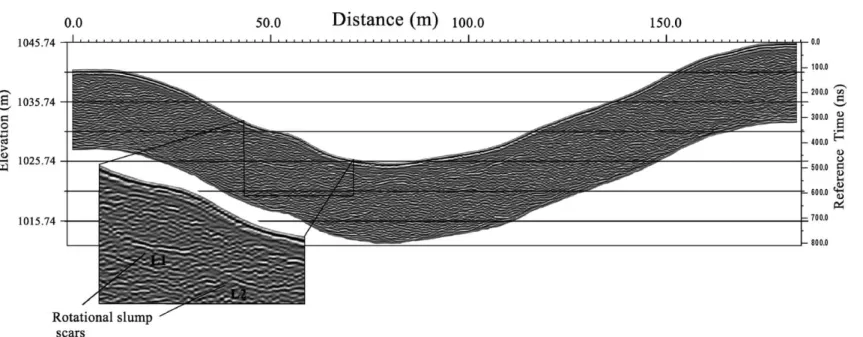
Fig. 8. Radar section 3 (RS-3), across the hollow, obtained with 100-MHz antennae; gain: AGC window 50 ns, vertical exaggeration: 1.5:1.
P
.R.A.
Aranha
et
al.
/
Journal
of
Applied
Geophysics
49
(2002)
195–210
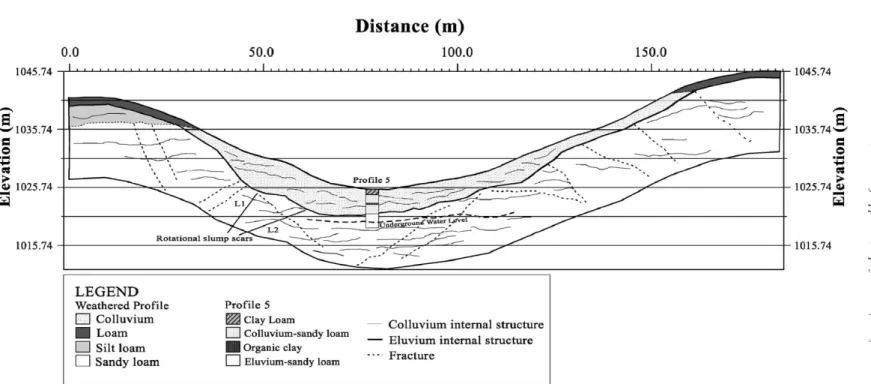
Fig. 9. 2D geomorphological model, based on RS-3 surveyed with 100-MHz antennae.
P
.R.A.
Aranha
et
al.
/
Journal
of
Applied
Geophys
ics
49
(2002)
195–210
The RS-2 (Fig. 6) was surveyed on the top of the slope with a 100-MHz antennae. This section shows a sharp reflector ‘‘H’’ which was identifiable as a stone-line that narrows upward. Close to the distance of 190 – 205 m (‘‘I’’ region), the radar section shows occurrence of an ancient depression filled by colluvium, underlaid by stoneline. The reflectors ‘‘H’’ and ‘‘J’’ are inter-preted as internal structures of the unweathered schist. Again, based on the interpreted data from the radar section, confirmed by data collected in the field through borehole, it was possible to compose the 2D geomorphological model for the upper part of the slope (Fig. 7).
The RS-3 (Fig. 8) was surveyed along the depres-sion of the hollow. It is perpendicular to RS-1, approx-imately 180 m long, beginning on the right side of the hollow axis, crossing the profile 1 at 10 m, and ending at the left convex border of the hollow. The slope at the right side of the hollow has declivity average of 18.6j, while that of the left side has one of 12j, indicating an asymmetry between the two sides of the depression.
The use of GPR in a transect perpendicular to the hollow axis has confirmed important information about the geomorphological/pedological setting in this section. One of them is the clear differentiation of the contact between the weathered mantle and the bed-rock, which is very important information for soil and geomorphological research. Furthermore, by combin-ing information of GPR and those obtained through the direct observation of declivity and of soil pits such as thickness, soil sequences along the slope, it was possible to recognize areas which have been under-going intense erosion and mass movement.
An observation of the major signs of the RS-3 (Fig. 8) at the bottom of the hollow provides an identifica-tion of irregularities, which can be better detected on the deeper curve of the concavity. They are associated, in accordance with the field observation made in P5, with the presence of colluvium accumulated over an alluvial deposit formed by organically rich clay and a sequence of a gley mottled material (Fig. 9). The colluvium is the combined result of soil erosion and mass movements, whose scars can be identified on the border of the hollow. The irregularities visualized in the RS-3 are related to mass movements, which have taken place at the right side of the hollow. This can be observed through the irregular structures of the reflec-tors up to reflector ‘‘L1’’, and was proved from data of
P5, which showed a great mixture of soil colors along its first 3 m of depth. The hollow altimetric profile, measured with the use of an engineer’s level, also identified a break of slope, indicating the occurrence of a surface scar from a major mass movement. The evidences of a convexity corresponding to the slide foot can be identified on the right of the reflector L1 (Fig. 8). It is interesting to observe the presence of the surfaces of ruptures (main shear plane) of the rotational slumps, which can be well identified as L1 and L2 surfaces. Above it, inside the GPR profile, the pres-ence of minor scars due to the slump movement is recognizable. Besides the occurrence of mass move-ment on the right side of the hollow, it was possible to detect the intense humidity of the lower alluvial deposit, due to the direct contact with underground water, what facilitates and triggers downward move-ments, accentuating the irregularities, as can be seen in the shape shown by the reflectors just above the L1 surface. Based on these observations, it was possible to compose the 2D geomorphological model for the line across the hollow (Fig. 9).
5. Conclusions
On the basis of the results, it can be said that the use of GPR has helped to analyze and to obtain indirectly geological, geomorphological and pedological infor-mation about the study area, including identification of the occurrence of past slope processes, such as rota-tional slumps. The identification of the bedrock, weath-ered mantle, colluvium/alluvium material and contacts between them, as well as the occurrence of past slope processes are possible, depending on the characteristics of the subsurface. The scale of that information is very good considering the accuracy of data acquired with the radar section, when compared with field data.
However, it is important to point out that as shown in Fig. 3, the intense geological fracturing and contacts due to the occurrence of a shear zone, make it difficult to have a straightforward interpretation of the reflectors and its correlation with the internal characteristics of the weathered mantle. The occurrence of a very thin quartz vein or thin layers of sediments, at very shallow depth is, as well, a limiting factor on the GPR response with the antennae used, since they were unable to enhance and provide definitions for these features.
The data obtained allowed to compose a 2D geo-morphological model for each line, which is an important tool in the study of the surface dynamics and in the erosion process.
As was expected, the survey with 50-MHz antennae achieved a deeper response than the survey with 100-MHz antennae, although it showed less vertical reso-lution. Indeed, it is easier to interpret important reflec-tors on the 50-MHz radar section than on the 100-MHz radar section, due to the continuity of the reflectors influenced by the EM-wave wideband. On the other hand, the 100-MHz section allowed the better identi-fication of the reflectors due to the length of the EM-wave, narrower in the 100-MHz wave than in the 50-MHz wave. This is exemplified in Fig. 3, observing that the reflector ‘‘A’’, which is not well visualized in it, because it is mixed with the surface wave. The opposite can be observed in Fig. 4, where the reflector ‘‘A’’ is sharply distinguished from the surface wave.
Acknowledgements
We whish to thank the Fundacßa˜o de Amparo a` Pesquisa do Estado de Minas Gerais (FAPEMIG), Brazil, for the financial support (Cex-1669-95), and also the comments of the reviewers.
References
Almeida-Abreu, P.A., 1993. Evolucßa˜o geodinaˆmica da Serra do Espinhacßo Meridional, Minas Gerais, Brasil. PhD thesis, Uni-versity of Freiburg, Freiburg, Germany, 150 pp.
Arcone, S.A., Delange, A.J., 1987. Airborne river-ice thickness profiling with helicopter-borne UHF short-pulse radar. J. Gla-ciol. 33, 330 – 340.
Augustin, C.H.R.R., 1995. Geoo¨kologische Studien im Su¨dlichen Espinhacßogebirge bei Gouveia, Minas Gerais Brasilien unter besonderer Beru¨cksichtigung der Landschaftsentwicklung. PhD thesis, University of Frankfurt a.m., Germany, 149 pp. Augustin, C.H.R.R., 1999. The relationship between gully erosion
and land use in Gouveia, Minas Gerais, Brazil. Regional Confer-ence on Geomorphology, IAG-UGB, July, Rio de Janeiro. Bristow, C., 1994. A new look at the Lower Greensand using
ground-penetrating radar. Geol. Today, 24 – 27.
Collins, M.E., Doolittle, J.A., 1987. Using ground penetrating radar to study soil microvariability. Soil Sci. Soc. Am. J. 51, 491 – 493. Collins, M.E., Puckett, W.E., Schellentrager, G.W., Yust, N.A., 1990. Using GPR for micro analyses of soils and karst features on the chiefland limestone plain in Florida. Geoderma 47, 159 – 170.
Comig-Companhia Mineradora do Estado de Minas Gerais, 1997. Projeto Espinhacßo, Mapas Geolo´gicos, Folha de Diamantina; Es-cala 1:100,000. Belo Horizonte, Minas Gerais, Brasil; CD ROM.
Cook, J.C., 1973. Radar exploration through rock in advance of mining. Trans. Soc. Min. Eng. AIME 254, 140 – 146. Davis, J.L., Annan, A.P., 1989. Ground penetrating radar for
high-resolution mapping of soil and rock stratigraphy. Geophys. Pros-pect. 37, 531 – 551.
Doolittle, J.A., Collins, M.E., 1995. Use of soil information to determine application of ground penetrating radar. Appl. Geo-phys. 33, 101 – 108.
Doolittle, J.A., Collins, M.E., 1998. A comparison of EM induction and GPR methods in areas of karst. Geoderma 85, 83 – 102. Dussin, I.A., 1994. Evolution structurale de la region de
L’Espin-hacßo meridional, bordure sud-Est du Craton Sa˜o Francisco, Bre´sil. Tese de Doutoramento, Universite´ d’Orleans, Francßa. Figueiredo, M.A., Augustin, C.H.R.R., Fabris, J.D., 1999.
Mineral-ogy, size, morphology and porosity of aggregates and their re-lationship with soil susceptibility to water erosion. Hyperfine Interact. 122, 177 – 184.
Fisher, E., McMechan, G.A., Gorman, M.R., Cooper, A.P.R., Aik-en, C.L.V., Ander, M.E., Zumberge, M.A., 1989. Determination of bedrock topography beneath the Greenland ice sheet by three dimension imaging of radar sounding data. J. Geophys. Res. 4, 2874 – 2882.
Fisher, E., McMechan, G.A., Annan, P.A., 1992. Acquisition and processing of wide-aperture ground penetrating radar data. Geo-physics 57 (3), 495 – 504.
Harari, Z., 1996. Ground penetrating radar (GPR) for imaging strati-graphic features and groundwater in sand dunes. J. Appl. Geo-phys. 36, 43 – 52.
Imai, T., Sakayama, T., Kanemori, T., 1987. Use of ground pene-trating radar and resistivity for archeological investigations. Geophysics 55 (1), 137 – 150.
Jol, H.M., 1995. Ground penetrating radar antennae frequencies and transmitter powers compared for penetrating depth, resolution and reflections continuity. Geophys. Prospect. 43, 693 – 709. Kung, K.-J.S., Lu, Z.-B., 1993. Using ground penetrating radar to
detect layers of discontinuity dielectric constant. Soil Sci. Soc. Am. J. 57, 335 – 340.
Lawton, D., Jol, H.M., 1994. Ground penetrating radar investiga-tions of the Canada Creosote Site, Calgary. Can. Soc. Explor. Geophys. Rec., 13 – 18April.
Nobes, D.C., 1999. Geophysical survey of burial sites: a case study of the Oaro Ururoa. Geophysics 64 (2), 357 – 367.
Sternberg, B.K., McGill, J.W., 1995. Archeology studies in southern Arizona using ground-penetrating radar. J. Appl. Geophys. 33 (1), 209 – 255.
Stove, G.C., Addyman, P.V., 1989. Ground probing impulse radar: an experiment in archeological remote sensing at York. Antiq-uity 63, 337 – 342.
Vaughn, C.J., 1986. Ground penetrating radar survey used in ar-cheological investigations. Geophysics 51 (3), 595 – 604. Young, R.A., Sun, J., 1999. Revealing stratigraphy in ground
pene-trating radar data using domain filtering. Geophysics 64 (2), 435 – 442.
P.R.A. Aranha et al. / Journal of Applied Geophysics 49 (2002) 195–210