doi: 10.1590/0101-7438.2015.035.02.0353
ANALYTIC NETWORK PROCESS AND BALANCED SCORECARD APPLIED TO THE PERFORMANCE EVALUATION OF PUBLIC HEALTH SYSTEMS
Marco Aur´elio Reis dos Santos, Val´erio Antonio Pamplona Salomon*
and Fernando Augusto Silva Marins
Received August 8, 2014 / Accepted December 9, 2014
ABSTRACT.The performance of public health systems is an issue of great concern. After all, to assure people’s quality of life, public health systems need different kinds of resources. Balanced Scorecard pro-vides a multi-dimensional evaluation framework. This paper presents the application of the Analytic Net-work Process and Balanced Scorecard in the performance evaluation of a public health system in a typical medium-sized Southeastern town in Brazil.
Keywords: analytic network process, balanced scorecard, performance evaluation, public health systems.
1 INTRODUCTION
The performance of public health systems is an issue of great concern (Harrison et al., 2004). After all, to assure or to improve people’s quality of life, huge and increasing amounts of public resourcesare needed (Caballer-Tarazona et al., 2010). However, traditional performance evalua-tion models are solely based on subjective and, in some cases, paternalistic aspects (Gomes & Andrade, 2012).
Balanced Scorecard (BSC) provides a multiple-dimensional evaluation framework integrating concerns from four different perspectives: Financial, Customer, Internal Business Process, and Learning and Growth (Kaplan & Norton, 1992). Since some of these perspectives may conflict with one another (Wu et al., 2009), the BSC framework compromises a multi-criteria decision analysis (MCDA).
Although the Analytic Hierarchy Process (AHP) is the MCDA method with the highest number of scientific publications (Wallenius et al., 2008), the Analytic Network Process (ANP) is a generalization of the AHP that deals with dependencies (Ishizaka & Nemery, 2013). Once there
*Corresponding author.
Universidade Estadual Paulista – UNESP, Guaratinguet´a, SP, Brazil.
are interactions among the BSC’s perspectives, the ANP seems to be a proper MCDA method for a BSC-based model to evaluate performance.
This paper presents the application of the ANP and the BSC in the performance evaluation of public health systemsin a typical medium-sized Southeastern town in Brazil. Mathematical Modeling (Morabito & Pureza, 2012) is the research method adopted in this work. The model-ing of a decision problem with the application of the AHP, ANP, or most of the MCDA methods, consists of three steps: Structuring, Measuring, and Synthesizing (Salgado et al., 2012). Section 2 presents the theory background. Section 3 brings the ANP and the BSC application. Section 4 presents the conclusions and a proposal for further researches.
2 THEORETICAL BACKGROUND
2.1 The Analytic Network Process
The structuring in the AHP results in hierarchies, as can be seen in Figure 1. The general hier-archy has three main levels: decision is at the top, criteria in the middle, and alternatives at the bottom. Complex decision may involve a number of criteria, which justifies grouping them in sub-criteria or alternatives.
C
Criterion 1
Alternative
Alternative
...
Alternative n
1
2
n
Criterion
Alterna
Alterna
..
Alterna
Objective
2
ative 1
ative 2
.
ative n
... Criterion m
Alternativ
Alternativ
...
Alternativ ve 1
ve 2
ven
Figure 1– Generic hierarchical structure.
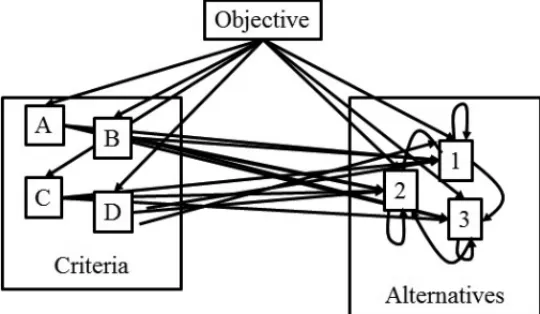
provide a better opportunity for capturing more of the influences on the outcome by including tangibles and intangibles (Saaty, 2005). A group of alternatives or criteria in a network is known as a “cluster” (Saaty, 2001). Many decision problems cannot be structured hierarchically due to dependencies between and within such clusters (Gencer & Gurpinar, 2007). Notwithstanding, the ANP is a very useful tool to solve this kind of problems.
Figure 2– Example of a network structure.
The AHP and the ANP are successive pairwise comparison processes among criteria and al-ternatives, rather than simultaneous processes, as the weighted sum model (Ishizaka, 2012). These comparisons are based on the Fundamental Scale of Absolute Numbers (Saaty, 2010), a linear 1-9 scale where 1 is of equal importance (two activities contribute equally to the objec-tive) and 9 is of extreme importance (the evidence favoring one activity over another is of the highest possible order of affirmation).
As in the AHP, the priority vector in the ANP,w, is the right eigenvector of the comparison matrix,A, withλmaxcorresponding to the maximum eigenvalue (Equation 1).
Aw=λmaxw (1)
In the AHP, the alternative priorities corresponding to each criterion are referred to as local priorities and compose the decision matrix. The overall priorities for the alternatives are obtained through an average of the local priorities, weighted by criteria priorities.
In the ANP, all local priorities compose the Supermatrix,S(Equation 2).
S=
Ca Cb
. . .
Cn
Ca Cb . . . Cn W aa W ab
. . . W an
W ba W bb W bn
. .
. . .. ...
W na W nb . . . W nn
When the Clusterihas no influence on the Cluster j, thenWi j =0. However, if a relationship is present, then the entry would be nonzero, suggesting an outer dependence. An inner dependence would exist ifWiihad nonzero components. This way, network structures allow decision-making with interaction and feedback (Niemira & Saaty, 2004).
The overall priorities in the ANP are computed raisingSto the Limit Supermatrix,L. The process of raising the power of stochastic matrices was first studied by Andrey Markov (Norris, 1997). The resulting L is also a stochastic matrix; however, all columns have equal value. A Final Matrix,F, can be obtained unweighting the components ofL inside their clusters. This way,F
comprises the overall priorities of the network elements, as illustrated in Section 3.
2.2 Balanced Scorecard
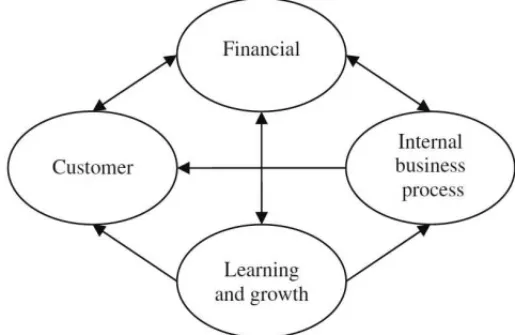
Frustrated due to the inadequacies of traditional performance measurement systems, some top managers have quit financial measures (Kaplan & Norton, 1992). BSC was developed as a new performance measurement system that gives a fast, but comprehensive, view of the business. Figure 3 presents the BSC framework, which is, in fact, a network structure.
Figure 3– Balanced scorecard (Yuksel & Dagdeviren, 2010).
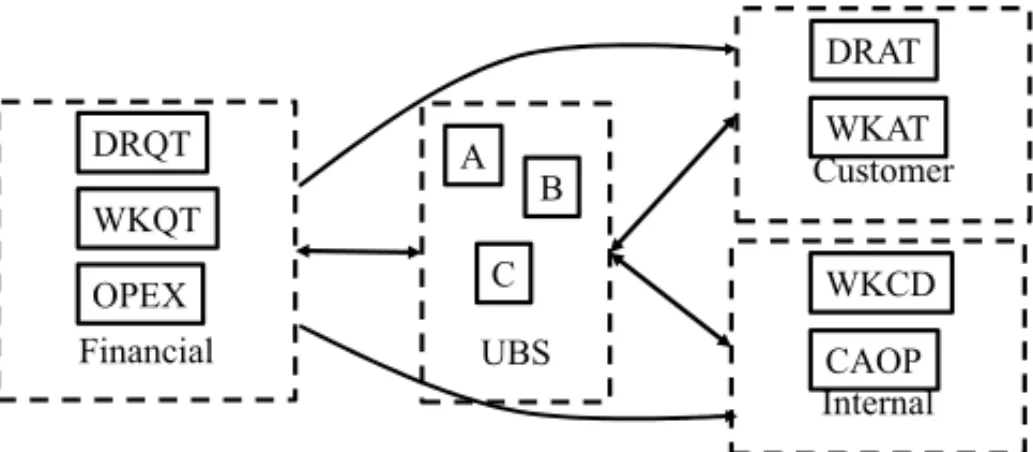
A result of the BSC application is the strategy map, a representation of the cause-effect rela-tionships among strategic objectives (Quezada et al., 2013). Figure 4 brings an example of a strategy map.
3 PERFORMANCE EVALUATION OF PUBLIC HEALTH SYSTEMS
The mayor of a typical medium-sized Southeastern town in Brazil has decided to evaluate the performance of their three Basic Health Units (UBS, acronym in Brazilian Portuguese for
Figure 4– Example of strategy map (Salomon & Whitaker, 2007).
Financial UBS
DRQT
WKQT
A
C OPEX
B Customer
DRAT
WKAT
Internal WKCD
CAOP
Figure 5– Strategy map for the evaluation of public health systems.
Three perspectives were considered: Customer (C), Financial (F) and Internal (I). From the financial point of view, in addition to the operating expenses (OPEX), we evaluated the quantity of doctors (DRQT) and workers (WKQT). From the perspective of customers, we evaluated the quality of medical attention (DRAT) and reception attention (WKAT). From the internal perspective, working conditions (WKCD) and career and opportunities (CAOP) were evaluated. Table 1 presents data from UBS A, B and C. The OPEX original data were classified in Brazilian Real [BRL], although proportions between these values were maintained in another currency.
Table 1– Operation expenses, doctors and workers quantity.
UBS DRQT WKQT OPEX
A 12 120 3,600,000
B 10 40 3,100,000
Table 2 presents comparisons of performance levels, conducted by the city’s Health Secretary, for the evaluation of subjective criteria. The scores were obtained normalizing the comparison matrix’s right eigenvector (Equation 1). This matrix has a good consistency level, sinceλmax≈ 5.24, is close ton.
Table 2– Performance levels to evaluate subjective criteria.
Evaluation VS ST LS LD NS Score
Very satisfied (VS) 1 3 5 7 9 .51
Satisfied (ST) 1/3 1 3 5 7 .27
A little satisfied (LS) 1/5 1/3 1 3 5 .13 A little dissatisfied (LD) 1/7 1/5 1/3 1 3 .06 Not satisfied (NS) 1/9 1/7 1/5 1/3 1 .03
Table 3 presents results of the performance evaluation of public health systems conducted by patients (AA and AM) or doctors and workers (CT and D2). As can be seen, most patients, doctors, and workers are dissatisfied.
Table 3– Performance of UBS in subjective criteria.
UBS DRAT WKAT WKCD CAOP
A LS ST LD NS
B LD ST NS NS
C NS NS NS LD
Table 4 presents the Supermatrix for the evaluation of public health systems. The criteria had equal local priorities inside their clusters. Performances for UBS were considered independent from each other.
Table 4– Supermatrix for the evaluation of public health systems.
DRQT WKQT OPEX DRAT WKAT WKCD CAOP A B C
DRQT 1/3 1/3 1/3 1/3 1/3 1/3 1/3
WKQT 1/3 1/3 1/3 1/3 1/3 1/3 1/3
OPEX 1/3 1/3 1/3 1/3 1/3 1/3 1/2
DRAT 1/2 1/2 1/2
WKAT 1/2 1/2 1/2
WKCD 1/2 1/2 1/2
CAOP 1/2 1/2 1/2
A 1/12 1/120 1/3.6 .13 .27 .06 .03
B 1/10 1/40 1/3.1 .06 .27 .03 .03
Table 5 presents the weighted Supermatrix for the evaluation of public health systems. The clusters had equal overall priorities.
Table 5– Weighted Supermatrix for the evaluation of public health systems.
DRQT WKQT OPEX DRAT WKAT WKCD CAOP A B C
DRQT 0 0 0 .17 .17 .17 .17 .11 .11 .11
WKQT 0 0 0 .17 .17 .17 .17 .11 .11 .11
OPEX 0 0 0 .17 .17 .17 .17 .11 .11 .11
DRAT 0 0 0 0 0 0 0 .17 .17 .17
WKAT 0 0 0 0 0 0 0 .17 .17 .17
WKCD 0 0 0 0 0 0 0 .17 .17 .17
CAOP 0 0 0 0 0 0 0 .17 .17 .17
A .26 .15 .24 .29 .24 .25 .13 0 0 0
B .31 .46 .28 .14 .24 .13 .13 0 0 0
C .44 .38 .48 .07 .03 .13 .25 0 0 0
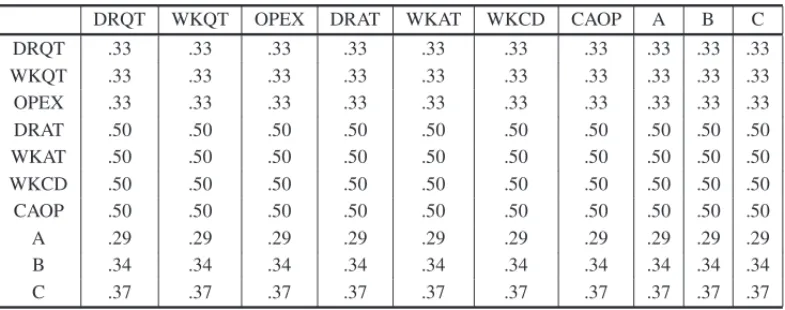
The Limit Supermatrix converged, at the hundredths, with the 16thpower of the weighted Super-matrix. Table 6 presents the Final Supermatrix for the evaluation of public health systems. This Supermatrix was obtained reweighting components from the Supermatrix cluster by their sum.
Table 6– Final Supermatrix for the evaluation of public health systems.
DRQT WKQT OPEX DRAT WKAT WKCD CAOP A B C
DRQT .33 .33 .33 .33 .33 .33 .33 .33 .33 .33
WKQT .33 .33 .33 .33 .33 .33 .33 .33 .33 .33
OPEX .33 .33 .33 .33 .33 .33 .33 .33 .33 .33
DRAT .50 .50 .50 .50 .50 .50 .50 .50 .50 .50
WKAT .50 .50 .50 .50 .50 .50 .50 .50 .50 .50
WKCD .50 .50 .50 .50 .50 .50 .50 .50 .50 .50
CAOP .50 .50 .50 .50 .50 .50 .50 .50 .50 .50
A .29 .29 .29 .29 .29 .29 .29 .29 .29 .29
B .34 .34 .34 .34 .34 .34 .34 .34 .34 .34
C .37 .37 .37 .37 .37 .37 .37 .37 .37 .37
UBS A had the lowest overall priority, while UBS C had the highest. However, UBS C had the worst evaluation in three (DRAT, WKAT and WKCD) of the four subjective criteria. Neverthe-less, this UBS had the best performance in the financial perspective, since it had less doctors and workers and spent less with surgeries.
4 CONCLUSIONS
The ANP and the BSC were applied to the evaluation of public health systems in a typical medium-sized Southeastern town in Brazil. Three UBS were evaluated according to seven crite-ria, four of them subjective. Data available, as number of doctors allocated to each UBS, were utilized. Nevertheless, opinion of patients, doctors and workers were also regarded as inputs to the evaluation.
The BSC theory was considered suitable for the evaluation of public health systems by the city administration and the ANP an adequate multi-criteria method, once the BSC deals with net-works: strategy maps. However, the resulting network is almost a hierarchy, which means that, with the application of another multi-criteria method, the results achieved could be similar. In addition, the great advantage of using another method is the availability of software, as it is higher for the AHP or the MAUP if compared with the ANP. Nevertheless, the difficulty to run the ANP was not a problem, since the proposed model could be processed with spreadsheets only. Financial was the most influent cluster, and its influence may explain the highest priority for the alternative (UBS C) with the best performance. Sensitivity analysis is very simple and widely performed in other multi-criteria decision methods. However, in the ANP, this analysis is subject to ongoing researches. After all, in the ANP, the continuous variation of criteria weights may be insignificant comparing with alterations in the model, as the identification of higher dependence among and inside clusters.
ACKNOWLEDGMENTS
Three Brazilian agencies supported this research: CAPES (MSc and PhD scholarships), CNPQ (Grant No. 303362/2012-0), and FAPESP (Grant No. 2013/03525-7).
REFERENCES
[1] CABALLER-TARAZONAM, MOYA-CLEMENTEI, VIVAS-CONSUELOD & BARRACHINA-MAR
-TINEZI. 2010. A model to measure the efficiency of hospital performance.Mathematical and Com-puter Modelling,52(7-8): 1095–1102.
[2] GENCERC & GURPINARD. 2007. Analytic network process in supplier selection: A case study in an electronic firm.Applied Mathematical Modelling,31(11): 2475–2486.
[3] GOMES LFAM & ANDRADERM. 2012. Performance evaluation in assets management with the AHP.Pesquisa Operacional,32(1): 31–53.
[4] HARRISONJP, COPPOLAMN & WAKEFIELDM. 2004. Efficiency of federal hospitals in the United States.Journal of Medical Systems,28(5): 411–422.
[5] ISHIZAKA A. 2012. Clusters and pivots for evaluating a large number of alternatives in AHP.
Pesquisa Operacional,32(1): 87–101.
[6] ISHIZAKAA & NEMERYP. 2013. Multi-criteria decision analysis. Chichester, UK: Wiley.
[7] KAPLAN RS & NORTONDP. 1992. The Balanced Scorecard: measures that drive performance.
[8] MORABITO NR & PUREZA VMM. 2012. Modelagem e simulac¸˜ao. Em: MIGUEL PAC. (ed.). Metodologia de pesquisa em engenharia de produc¸˜ao e gest˜ao de operac¸˜oes. Rio de Janeiro: Else-vier, pp. 169–198.
[9] NIEMIRAMP & SAATYTL. 2004. An Analytic Network Process model for financial-crisis forecast-ing.International Journal of Forecasting,20(4): 573–587.
[10] NORRISJR. 1997. Markov chains. Cambridge, UK: Cambridge University Press.
[11] QUEZADALE, PALOMINOSPI & GONZALEZMA. 2013. Application of AHP in the design of a strategy map.Business,5: 133–137.
[12] SAATYTL. 2001. The Analytic Network Process. 2 ed. Pittsburgh: RWS.
[13] SAATY TL. 2005. Making and validating complex decisions with the AHP/ANP. Journal of Systems Science and Systems Engineering,14(1): 1–36.
[14] SAATY TL. 2010. Who won the Winter 2010 Olympics? A quest into priorities and rankings.
Journal of Multi-Criteria Decision Analysis,17(1-2): 25–36.
[15] SALGADOEG, SALOMONVAP & MELLO CHP. 2012. Analytic hierarchy prioritisation of new product development activities for electronics manufacturing.International Journal of Production Research,50(17): 4860–4866.
[16] SALOMONVAP & WHITAKERR. 2007. Decision-making considering dependence relations for the improvement of production management.Brazilian Journal of Operations & Production Manage-ment,4: 47–60.
[17] WALLENIUSJ, DYERJS, FISHBURNPC, STEUERRE, ZIONTSS & DEB K. 2008. Multiple cri-teria decision making, multiattribute utility theory: Recent accomplishments and what lies ahead.
Management Science,54(7): 1336–1349.
[18] WUH-Y, TZENGG-H & CHENY-H. 2009. A fuzzy MCDM approach for evaluating banking per-formance based on Balanced Scorecard.Expert Systems with Applications,36(6): 10135–10147.
[19] YUKSELI & DAGDEVIRENM. 2010. Using the fuzzy analytic network process (ANP) for Balanced Scorecard (BSC): a case study for a manufacturing firm.Expert Systems with Applications,37(2):