OFF Segregation in the Lateral Geniculate Nucleus
Julijana Gjorgjieva1*, Taro Toyoizumi2, Stephen J. Eglen1
1Department of Applied Mathematics and Theoretical Physics, University of Cambridge, Cambridge, United Kingdom, 2Department of Neuroscience, Columbia University, New York, New York, United States of America
Abstract
Spontaneous retinal activity (known as ‘‘waves’’) remodels synaptic connectivity to the lateral geniculate nucleus (LGN) during development. Analysis of retinal waves recorded with multielectrode arrays in mouse suggested that a cue for the segregation of functionally distinct (ON and OFF) retinal ganglion cells (RGCs) in the LGN may be a desynchronization in their firing, where ON cells precede OFF cells by one second. Using the recorded retinal waves as input, with two different modeling approaches we explore timing-based plasticity rules for the evolution of synaptic weights to identify key features underlying ON/OFF segregation. First, we analytically derive a linear model for the evolution of ON and OFF weights, to understand how synaptic plasticity rules extract input firing properties to guide segregation. Second, we simulate postsynaptic activity with a nonlinear integrate-and-fire model to compare findings with the linear model. We find that spike-time-dependent plasticity, which modifies synaptic weights based on millisecond-long timing and order of pre- and postsynaptic spikes, fails to segregate ON and OFF retinal inputs in the absence of normalization. Implementing homeostatic mechanisms results in segregation, but only with carefully-tuned parameters. Furthermore, extending spike integration timescales to match the second-long input correlation timescales always leads to ON segregation because ON cells fire before OFF cells. We show that burst-time-dependent plasticity can robustly guide ON/OFF segregation in the LGN without normalization, by integrating pre- and postsynaptic bursts irrespective of their firing order and over second-long timescales. We predict that an LGN neuron will become ON- or OFF-responsive based on a local competition of the firing patterns of neighboring RGCs connecting to it. Finally, we demonstrate consistency with ON/OFF segregation in ferret, despite differences in the firing properties of retinal waves. Our model suggests that diverse input statistics of retinal waves can be robustly interpreted by a burst-based rule, which underlies retinogeniculate plasticity across different species.
Citation:Gjorgjieva J, Toyoizumi T, Eglen SJ (2009) Burst-Time-Dependent Plasticity Robustly Guides ON/OFF Segregation in the Lateral Geniculate Nucleus. PLoS Comput Biol 5(12): e1000618. doi:10.1371/journal.pcbi.1000618
Editor:Lyle J. Graham, Universite´ Paris Descartes, Centre National de la Recherche Scientifique, France
ReceivedJuly 23, 2009;AcceptedNovember 17, 2009;PublishedDecember 24, 2009
Copyright:ß2009 Gjorgjieva et al. This is an open-access article distributed under the terms of the Creative Commons Attribution License, which permits unrestricted use, distribution, and reproduction in any medium, provided the original author and source are credited.
Funding:This work was funded by a Cambridge Overseas Research Studentship and Trinity College Internal Graduate Studentship (JG), and the Robert Leet and Clara Guthrie Patterson Trust Postdoctoral Fellowship, and Bank of America Trustee (TT). The funders had no role in study design, data collection and analysis, decision to publish, or preparation of the manuscript.
Competing Interests:The authors have declared that no competing interests exist. * E-mail: jg447@cam.ac.uk
Introduction
During the development of the visual system, connections between neurons form and refine in a self-organized manner governed by various mechanisms. Initially, target neurons are contacted by multiple RGCs following gradients of molecular cues [1–3]. As circuits mature, visually-evoked activity maintains these connections; however, in early development when photoreceptors are functionally inactive, activity is spontaneously generated within the retina. This spontaneous activity spreads across the retina in the form of waves, and is believed to encode different cues for synapse maturation in the visual system [4]: as inappropriate connections are eliminated, appropriate connections are strength-ened following Hebbian-like coincidence detection mechanisms [5,6]. There is a long-standing, and still active, debate about the relative importance of activity-dependent mechanisms in develop-ment [7,8]. Theoretical models can help inform this debate by evaluating hypotheses about the role of neural activity in the remodeling of connections.
One possible mechanism of coincidence detection of pre- and postsynaptic activity is that of spike-time-dependent plasticity
(STDP): synaptic change is induced from pairing multiple pre- and postsynaptic spikes, firing within tens of milliseconds of each other [9,10]. Various extensions which include triplets, quadruplets and other nonlinearities in spike integration have also been studied [11–13], but they commonly predict synaptic potentiation if presynaptic activity shortly precedes postsynaptic activity, and synaptic depression otherwise. One may argue that in developing systems, immature synapses are incapable of encoding information using precisely-timed spikes, but use bursts over coarser timescales [14,15]. Butts et al. [16] recently proposed burst-time-dependent plasticity (BTDP), based on recordings at the developing retinogeniculate synapse, as an alternative to STDP. In BTDP, synaptic change is induced according to the timing of bursts over longer timescales of a second, and irrespective of the firing order of pre- and postsynaptic bursts.
OFF RGCs; these inputs segregate such that eventually LGN neurons receive inputs from 1–3 RGCs of the same type (ON or OFF) [6,17]. Blocking spontaneous activity inhibits this segrega-tion [18,19]. Recent experiments in mouse identified a difference in the firing patterns of RGCs that might instruct ON/OFF segregation: at P12, cells of the same type fire together, but OFF RGCs fire about a second after ON RGCs [20]. This asynchrony differs from that found in ferret, where OFF cells fire more often than ON cells [21,22].
Here, we report results from a modeling study of the properties of experimentally-proposed synaptic plasticity rules and modifica-tions to these rules necessary to capture the segregation of ON and OFF retinal inputs to a postsynaptic LGN neuron driven by recorded RGC spike trains [20]. We take two approaches to investigate this problem: (i) by making various assumptions, we reduce the system to one that is analytically tractable, to allow us to use eigenvalue theory to predict synaptic weight development [22–24]; (ii) computational simulations allow us to test a larger system with less-restrictive assumptions. Combining these ap-proaches gives us insight into why the models perform as they do. Unsurprisingly, we find that a naively-implemented (additive) pair-based STDP [25] cannot segregate ON and OFF inputs using experimental values for the balance between synaptic potentiation and depression [9,10,26]. Since STDP integrates spikes over tens of milliseconds, on this timescale ON/OFF correlations are much smaller than ON/ON and OFF/OFF correlations, and both ON and OFF RGCs successfully drive the postsynaptic neuron leading to potentiation of both cell types. Therefore, homeostatic mechanisms must be implemented to induce synaptic weight competition [27,28]. However, for biological ratios of depression to potentiation close to unity, the segregation outcome is highly sensitive to the choice of parameters. This sensitivity aries since STDP with approximately balanced potentiation and depression does not utilize the correlations between cells but rather the cells’ time-averaged firing rates. Within the millisecond-long integration timescales, the second-long RGC correlations appear noisy and essentially constant. Due to the asymmetry of STDP potentiation and depression effects cancel each other, such that the signaling component of STDP for segregation is diminished. Since longer integration timescales are more appropriate for capturing the
firing patterns of the two input types, when we extend these timescales of STDP to half a second, segregation is always biased towards the cell that fires first, ON. We find that BTDP can robustly drive ON/OFF segregation in the LGN without requiring normalization, because in addition to the second-long timescales, it integrates pre- and postsynaptic activity irrespective of temporal order. The segregation outcome results from a trade-off between the shorter high-frequency bursts of ON cells, and the more strongly correlated OFF cells. Despite differences in firing patterns, our model can also reproduce ON/OFF segregation in ferret [22], suggesting a universality of the rule which governs ON/OFF segregation across species.
Results
In Figure 1A we illustrate the model used in this study, consisting of multiple ON and OFF RGC inputs projecting in a feedforward manner to a postsynaptic neuron in the LGN. Inputs to the model were experimentally-recorded activity patterns in the form of spike trains from P12 mouse retina by Kerschensteiner and Wong [20], with0:1ms precision and duration of*1 hour. Six experimental data sets were used (all recordings available online as Dataset S1), each consisting of 5–8 mixed (ON and OFF) RGC inputs recorded by one field of the multielectrode array used by Kerschensteiner and Wong [20]. Due to the high density of electrodes within one recording field (30mmbetween electrodes), differences in distance-dependent correlation among RGCs within the same data set were not relevant at this age [29]. RGCs were previously identified by Kerschensteiner and Wong as ON or OFF by light modulation; at the age studied,93%of the total recorded RGCs showed a response exclusively to light onset or offset [20]. This suggests that relatively few RGCs at this stage display mixed ON and OFF responses. We report input statistics (firing rates, numbers of ON and OFF inputs in each data set) in Table 1. Given these inputs, the activity of the postsynaptic LGN neuron was generated using two different models (Materials and Methods): in a biologically-realistic model we simulated the postsynaptic neuron with nonlinear integrate-and-fire dynamics and used as inputs the spike trains of all ON and OFF RGCs in each data set; in a reduced model we based postsynaptic activity on a linear Poisson neuron, and derived a linear equation for the dynamics of two synaptic weights, one ON and one OFF, using input statistics fits of the most correlated ON/ON and OFF/OFF cell pairs (Figure 1B). Change in synaptic strength was governed by STDP (Figure 2A) or BTDP (Figure 2B), where Figure 2C illustrates how bursts were detected. The two modeling approaches (linear Poisson and nonlinear integrate-and-fire models) complement each other in identifying which plasticity rule can read out key retinal wave properties for ON/OFF segregation.
Standard STDP with 20 ms timescales for spike
integration fails to guide ON/OFF segregation in realistic parameter regimes
First, we studied a standard pair-based STDP rule with additive synaptic change (Figure 2A) [25] under the reduced linear model framework (Materials and Methods) [24]. Comparing typical input correlation timescales used by the linear model (for example, data set 1 in Figure 1B) with the timescales of spike integration in STDP (Figure 2A), suggested that the resulting weight dynamics would be determined by the relative strength of the correlation between ON/ON and OFF/OFF pairs for a small time lag around 0 ms (Figure 1B, top and middle panels), because the millisecond-long correlation window of STDP would ignore the+1 second offset in the ON/OFF and OFF/ON correlation pairs (Figure 1B, Author Summary
bottom panel). We explored segregation outcome as a function of the balance between depression and potentiation effects in the plasticity rule, denoted by the ratio of the negative and positive
integrals of STDP,A{t{=Aztz(Figure 2A). Most experimental data have reported similar integration timescales for depression and potentiation, and approximately equal amplitudes [30], or
Figure 1. Model description and input correlation functions.(A, left) An LGN neuron receives feedforward weak synaptic input from neighboring ON (red) and OFF (blue) RGC inputs early in development. (A, right) Spontaneous retinal waves selectively refine RGC inputs, such that synaptic weights of one RGC type (ON) strengthen, while weights of the other RGC type (OFF) decay to 0, resulting in an ON-responsive LGN neuron. Sample P12 spike rasters in the middle demonstrate that ON cells fire shorter bursts of higher spike frequency, while OFF cells fire longer bursts of lower spike frequency,*1 second after ON [20]. Also shown are spike rasters for a developing LGN neuron receiving weak mixed ON and OFF inputs, and for a refined LGN neuron, receiving selective input solely from ON RGCs. LGN spiking activity was generated using the integrate-and-fire model in Equations 12–13. (B) Correlation functions for the input spike trains shown in (A) (mouse data set 1). The input correlation function for RGCs of the same type (ON/ON and OFF/OFF) peaks at*0 seconds, while for RGCs of different type peaks at*{1second for ON/OFF and*z1second for OFF/ON pairs. Symmetric decaying exponentials were fit to the pairwise input correlations using Equation 11. Peak amplitudes and decay time constants for pairs with maximal peaks are reported in Table 1.
doi:10.1371/journal.pcbi.1000618.g001
Table 1.Peak amplitudes and decay time constants of the symmetric fall-off exponential fits to the correlation functions of the most-correlated input pair from spontaneous retinal wave recordings by Kerschensteiner and Wong [20] (values given as estimate+standard error).SSON=ONT(t)andSSOFF=OFFT(t)denote the average firing rates of the two most correlated ON and OFF cells in each data set; other parameters are illustrated in Figure 1B.
Set 1 2 3 4 5 6
#ON cells 3 6 3 5 4 3
#OFF cells 3 2 2 2 2 5
SSON=ONT(t) (Hz) 1.51 0.40 0.70 1.01 0.34 1.04
AON=ON (Hz2) 14:025+0:104 1:723+0:014 3:633+0:050 4:306+0:053 1:950+0:016 6:791+0:051
tON=ON (s) 0:235+0:002 0:492+0:006 0:440+0:009 0:327+0:006 0:354+0:004 0:475+0:005
dON=ON (s) {0:016+0:001 0:046+0:003 {0:022+0:004 0:073+0:003 0:026+0:002 0:008+0:002
SSOFF=OFFT(t) (Hz) 2.94 0.63 0.80 2.44 2.06 2.48
AOFF=OFF (Hz2) 14:409+0:172 1:808+0:021 3:082+0:050 14:154+0:158 8:641+0:081 21:463+0:138
tOFF=OFF (s) 0:726+0:012 0:729+0:012 0:501+0:011 0:491+0:008 0:798+0:010 0:452+0:004
dOFF=OFF (s) {0:353+0:006 0:069+0:006 {0:362+0:006 0:162+0:004 {0:136+0:005 0:052+0:002
AON=OFF (Hz2) 11:620+0:140 1:561+0:022 6:106+0:091 9:767+0:156 2:638+0:033 10:185+0:084
tON=OFF (s) 0:489+0:008 0:747+0:015 0:428+0:009 0:456+0:010 0:578+0:010 0:556+0:006
dON=OFF (s) {1:200+0:004 {1:405+0:007 {0:765+0:004 {1:238+0:005 {1:143+0:005 {0:890+0:003
The number of ON and OFF cells used in the simulated integrate-and-fire model are also listed for each data set. The OFF/ON correlation function is a reflection about 0 of the ON/OFF correlation function, such thatAOFF=ON~AON=OFF,tOFF=ON~tON=OFFanddOFF=ON~{dON=OFF.
even a slight dominance of potentiation, thus, suggesting a depression-to-potentiation ratio less than or equal to 1 (for example, 0:80 [10], and 0:38 [9]). Under these limitations, we studied STDP with equal potentiation and depression timescales of
tz~t{~20 ms, which simplifies the depression-to-potentiation ratio to the ratio between amplitudes, R~A{=Az. Fixing the maximum potentiation amplitudeAz, we varied Rthrough the maximum depression amplitudeA{.
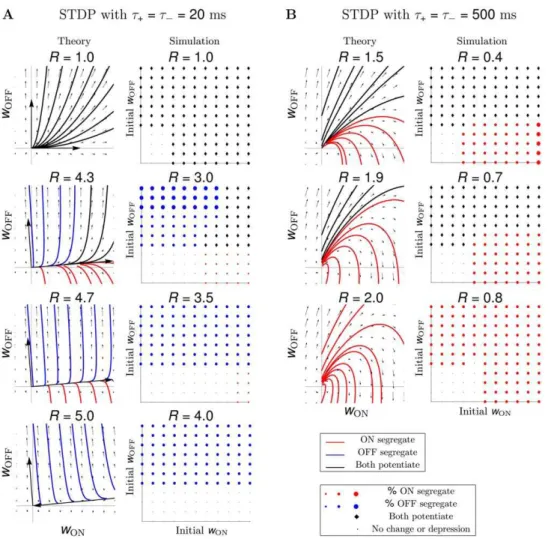
In Figure 3A (theory) we show the weight dynamics for data set 1 for different values of R. The vector fields and example trajectories demonstrate the segregation outcome for any initial condition in the range½0,wmaxfor the ON and OFF weights. For experimentally-observed ratios ofR&1:0, any initial condition led to the maximal weight potentiation of both cell types (top panel). Increasing R replaced the region where all weights grow, with regions where depending on initial conditions either ON or OFF segregation occurred (two middle panels). Many initial condition combinations (even those giving a prominent bias to ON) resulted in OFF segregation (bottom panel). We confirmed segregation results from the reduced linear model by simulating spikes for the postsynaptic LGN neuron with an integrate-and-fire model in Figure 3A (simulation), where all ON (3) and OFF (3) spike trains from data set 1 were used as inputs. The space of all initial conditions for the ON and OFF weights in½0,wmaxwas explored in discrete steps, such that a separate simulation was run for each combination of initial conditions. Both theory and simulation demonstrated a similar trend for increasing R (corresponding panels in Figure 3A, theory and simulation), though not surprisingly the ratios did not closely match.
Comparing results from the reduced linear Poisson model and the simulated integrate-and-fire model for the other data sets (data not shown), however, did not produce consistent results as for data set 1. To simultaneously demonstrate the difference in outcomes between the two models, and the absence of segregation across all
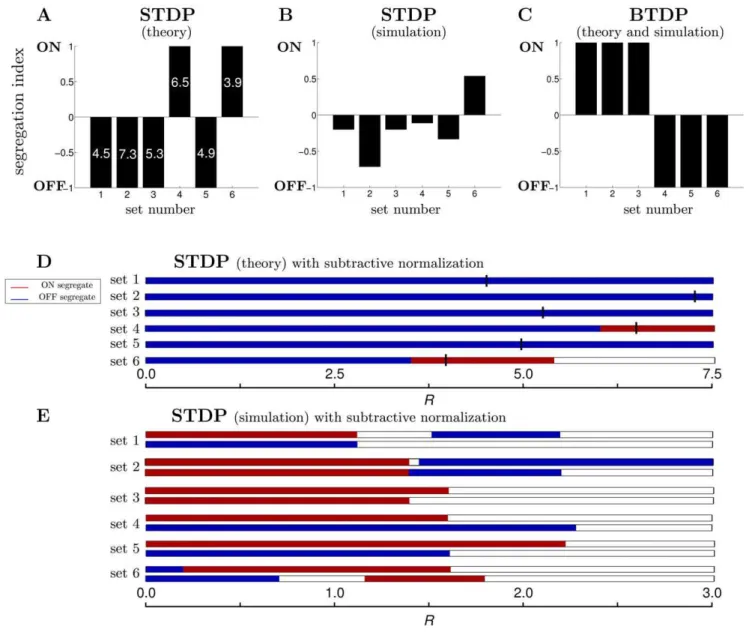
data sets, we computed a segregation index (Equation 16, Materials and Methods). While a detailed presentation of the segregation results using each modeling approach and for the whole range of initial conditions in½0,wmaxcan be made for all data sets as for data set 1 in Figure 3A, for the sake of brevity we present only the segregation index with fixed unbiased initial weights of 4:0 for both ON and OFF in Figure 4A,B. The segregation index was, in fact, the same for all unbiased initial conditions (uniformly distributed along the main diagonal of the two-dimensional weight space) for all data sets as for data set 1 in Figure 3A. The reduced linear model is two-dimensional, thus, by design segregation occurs when one weight wins and the other loses; this always happens ifRis sufficiently large. Figure 4A shows the segregation index under the reduced linear model framework, where the numbers in each bar denote the minimumRrequired for the selected unbiased initial conditions to give segregation. A common requirement for segregation across all the data sets was a depression-to-potentiation ratio R much larger than observed experimentally [9,10], and in theoretical work with synthetically-generated Poisson inputs [24,25]. This was needed to account for the large pairwise correlations of the real spike recordings, in contrast to the small cross-correlations between independent Poisson inputs which needRslightly larger than one (for example, R~1:05) [25].
Unlike the reduced linear model, segregation in simulations with the integrate-and-fire model is harder to achieve, since it requires a subset of all weights of one cell type to potentiate maximally, while all weights of the other cell type to depress. Only in data sets 1 (Figure 3A) and 2 (data not shown) we found that increasingR beyond 3.0 resulted in segregation for a range of initial conditions, consistent with the reduced linear model in Figure 4A. Segregation was not achieved in the other data sets for any studiedR. Though it is possible that we did not sample the range of R finely enough, a value of R which could lead to
Figure 2. STDP versus BTDP and burst detection.(A) STDP modifies synaptic strength based on the timing,Dt~tpost{tpre (indicated by horizontal arrows), and firing order of pairs of pre- and postsynaptic spikes [10]. Synaptic change occurs in a time window on the order of tens of milliseconds determined bytzandt{, with maximum change atDt&0given byAzandA{(%)in EPSC (evoked postsynaptic current) size. (B)
BTDP governs synaptic change based on the timing (but not order) of pre- and postsynaptic bursts over a second-long time window,tz[16]. We fit
the blue symmetric exponential curve to the linear experimental fit, whereAzandIdenote the amounts of maximum synaptic potentiation and
depression in%of EPSC size, respectively. (C) We detected ON (top) and OFF (bottom) bursts by accumulating burst detection variablesDON pre and DOFF
pre . At the arrival of a spike,Dincreases by 1, and otherwise decays exponentially with a time constant100ms. A burst was detected onceD reached a fixed threshold (here 1.5) denoted with an asterisk;Dwas not allowed to exceed the threshold value. The location of the asterisk (instead of the start time of the burst) was used to evaluate the burst latency for synaptic change. Parameters for STDP and BTDP are listed in Table 3. Figure modified from [68] with permission from the HFSP journal.
segregation would require careful tuning because of two observations: (i) increasing Rbeyond some value eventually led to depression of all weights, and (ii) for smaller values of Rfor which we did observe potentiation of some weights, the result was always potentiation of both ON and OFF weights as these tightly correlated RGCs of different cell type reliably drove postsynaptic spikes within 5–10 ms. A summary of the segregation index simultaneously showing the absence of segregation for all data sets is given in Figure 4B for a sample ratio ofR~2:0and unbiased initial conditions of4:0for both ON and OFF weights.
We also explored an STDP rule with a longer temporal window for synaptic depression than for potentiation corresponding to experiments from somatosensory cortex, tz~10ms and
t{~60ms [26]. Now the ratio of the negative to positive areas of
the STDP integral,A{t{=Aztz, took larger values by considering smaller ratios of the depression and potentiation amplitudes, R~A{=Az. However, only data set 1 resulted in OFF segregation for this choice of STDP parameters (data not shown).
In conclusion, our modeling showed that a temporally-asymmetric plasticity rule like STDP, integrating pre- and postsynaptic spikes over short timescales on the order of tens of milliseconds which ignore the correlation timescales between inputs of different cell type, failed to segregate these ON and OFF RGC inputs in a model of a developing LGN over a wide range of parameters and in the absence of synaptic competition. Under STDP, the growth of synaptic weights of one cell type did not prevent the growth of weights of the other cell type, because ON and OFF cells fire independently within the timescale of STDP.
Figure 3. STDP without normalization does not result in segregation.(A) STDP with spike integration time windows of 20 ms results in ON/ OFF segregation only for two data sets out of six (data set 1 shown here; data set 2 not shown), assuming a depression-to-potentiation ratio, R~A{=Az, much larger than experimentally-observed. Theory and simulation show similar trends, although actual values ofRdiffer. (Theory)
Vector fields and example trajectories of the ON-OFF weight dynamics illustrate results from the linear model. The direction of two eigenvectors of the plasticity matrixQ(pointing out of the origin for a positive eigenvalue, and into the origin for a negative eigenvalue) determine howRaffects segregation: asRincreases, regions of initial conditions where both weights potentiate (trajectories in black) become areas where segregation occurs (trajectories in red for ON and blue for OFF). (Simulation) In the simulated integrate-and-fire model (here, data set 1 with 3 ON and 3 OFF inputs), a separate simulation was run for each initial condition uniformly sampled between 0 and the maximum weight value,wmax, for the ON and the OFF weights. Herewmax~5:0and the discrete steps for the initial weights were0:5. The colored symbol indicates the segregation outcome according to the legend, matching the color of the trajectories in the linear model. The size of the colored circles denotes the percentage of synaptic weights of a particular RGC type which potentiated maximally out of all RGCs of the same type initially wired to the LGN neuron (the three dots denote33,66and
100%, respectively), while all weights of the other RGC type depressed to 0. Initial weights too small to generate postsynaptic activity result in no synaptic change (dots in the bottom left region of each plot). (B) Extending the spike integration window to match the timescale of the input correlations to500ms, results in pure dominance of the ON cells, both under the theoretical and the simulated model and for any value of the ratioR (data set 1 shown here, but all others show the same behavior).
Therefore, tightly correlated groups of ON and OFF cells which effectively drive the postsynaptic neuron, required physiologically-unrealistic, carefully-tuned values of the depression-to-potentiation ratio,R, for segregation. In the integrate-and-fire model even large Rcould not rescue segregation, because multiple ON and OFF inputs caused reliable spiking of the LGN neuron, and large R resulted in nonselective competition between all ON and OFF cells, rather than between groups of ON and OFF cells. These
results are not too surprising given recent theoretical work on STDP [31]. Introducing dependence of weight change on the current weight, choosing a different spike-pairing scheme or implementing dendritic and axonal synaptic delays may differently affect the behavior of the modeled system [31]. Furthermore, existing correlation-based models of ocular dominance require some form of synaptic competition to segregate inputs from the left and the right eye [32], which we considered next.
Figure 4. A summary of segregation under STDP and BTDP.(A) Segregation indices using Equation 16 for all data sets following the linear modeling approach with STDP using unbiased initial conditions of 4.0 for both ON and OFF weights. By design the theoretical model always results in segregation for large enoughR; the minimumRfor segregation is written in each bar. (B) Segregation indices from numerically implementing STDP for all data sets illustrate the absence of segregation. A highR~2:0was used here; increasingRbeyond 3.0 results in segregation only for data sets 1 (Figure 2A) and 2 (data not shown), inconsistent with linear model predictions in (A). (C) Segregation indices from the theoretical and numerical implementation of BTDP show consistent segregation across all data sets using the experimentally-observed ratioR~I=Az~0:42[16]. (D) STDP
with subtractive normalization can induce weight competition and segregation in the linear model. For realistic depression-to-potentiation values of R, the outcome is always OFF segregation. IncreasingRto the values which generated segregation in (A) (denoted by the black vertical lines) results in ON segregation for sets 4 and 6, matching results from (A). Note that in the linear modelwmaxsimply scales the weights and thus, it does not affect segregation outcome. (E) STDP with subtractive normalization also results in segregation in the simulated integrate-and-fire model for realistic values ofR. However, results depend on parameters: for instance, changes inR(horizontal axis) sometimes result in a switch from ON to OFF segregation (data set 2), and sometimes from ON to no segregation (data set 3). Also, the amount of total synaptic weight maintained by the postsynaptic neuron (top bar for each set wmax~5 and bottom bar wmax~10) affects segregation outcome (for example, data sets 4 and 5). While subtractive normalization rescues segregation for the STDP rule, results are inconsistent across the two different modeling approaches (compare to D). Uncolored sections in each bar denote no segregation.
STDP with homeostatic mechanisms can rescue segregation in carefully-tuned regimes
It is likely that synaptic plasticity rules work together with homeostatic mechanisms during formation and refinement of developing circuits [33]. While most work has examined developing cortical neurons where synaptic scaling is induced in response to changes in global activity levels [34,35], there is recent evidence of response homeostasis at the developing retinocollicular system maintained at the level of synapses [36]. We considered the implications of this second type of homeostasis together with STDP on segregation. Chandrasekaran et al. [36] found that at the level of a single postsynaptic neuron in the superior colliculus, the total number and strength of individual synapses is preserved during development. We implemented this as subtractive normal-ization, because it has been shown to induce weight competition (in contrast to divisive normalization) in traditional forms of Hebbian learning [27,37]. For each data set, we chose a number of synaptic weights N that the postsynaptic LGN neuron would maintain at adulthood with maximal strengthwmax, such that the total synaptic input to the LGN neuron maintained at all time during the simulation wasNwmax. In addition to STDP, synaptic weights were modified by adding/subtracting the synaptic deficit/ excess towards maintaining the target synaptic strength (Materials and Methods). As in STDP with largeR(Figure 4A), STDP with subtractive normalization for the reduced linear model where a single ON and a single OFF weight competed, also resulted in segregation but for biologically-plausible values ofR(Figure 4D). However, the segregation outcome for R&1:0in Figure 4D did not match results from STDP without normalization in Figure 4A, and in particular the outcome was always OFF segregation (Table 2). While same cell type correlations are higher than opposite cell type correlations, when considered within the millisecond-long window of STDP these second-long correlations are noisy and essentially constant. Then for biologically-plausible ratios of depression-to-potentation near unity (R&1) the effect of the correlations is diminished, because the contributions from the potentiating and from the depressing part of temporally-asym-metric STDP cancel. In this case, the evolution of the weights is entirely determined by single neuron properties, and in particular, by the time-averaged firing rate of each cell. The OFF cells for all data sets have larger firing rates than the ON cells (Table 1), leading to a bias for OFF segregation in Figure 4D. AsRincreases, the correlations start to become more relevant. The product of the
correlations with STDP in Equation 8 (Materials and Methods) is significantly negative for largeRfor all cell pairs, and moreover, it is more negative for same cell types due to their larger correlations in comparison to opposite cell types. Therefore, for some data sets where the negative contribution of the correlations dominated the positive contribution of the average firing rates (data sets 4 and 6), the ON cell with lower firing rate won for sufficiently largeR. In particular, forRequal to the values which resulted in segregation without normalization in Figure 4A (indicated by the short vertical lines in Figure 4D), data sets 4 and 6 produced ON segregation consistent with Figure 4A.
In the nonlinear integrate-and-fire model where multiple ON and OFF inputs were used, implementation of homeostasis also rescued segregation for biologically-plausible values ofR(Figure 4E). However, even with subtractive normalization the final outcome in simulations depended on parameter choice (depression-to-potenti-ation ratioRand maximum synaptic strengthwmax) and differed from the outcome of the reduced linear model (Figure 4D,E and Table 2). To understand whether the dependence of the segregation outcome was the result of variable input statistics, or the nonlinearity of the integrate-and-fire model, we simulated the full linear model using all RGCs in each data set. In Table 2 we summarize the segregation outcome for a realistic depression-to-potentiation ratioRbetween 0.8 and 1.0, under the three different models: the reduced linear model (Figure 4D), the full linear model, and the integrate-and-fire model, for a range of different wmax values (Figure 4E). Both the reduced and the full linear model had a preference for OFF segregation for all data sets. Above, we explained that the reason for this OFF bias is due to the diminishing effect of the correlations under STDP and the dominance of firing rates (which are generally higher for the OFF cells) forR&1. As an exception, the full linear model for data set 3 failed to capture OFF segregation because the multiple ON and OFF cells had more variable firing rates than the consistently larger OFF firing rates in the other data sets. With the output nonlinearity of the integrate-and-fire model, we observed two regimes: (1) for a smallwmax, the ON cells won in all data sets (Table 2) unlike the linear model, probably because the short timescales of STDP captured the high instantaneous firing rates of ON cells within a burst (as indicated by the smaller decay timescales for ON/ON than OFF/OFF RGC pair correlations in Table 1). The OFF cells most likely failed to drive the postsynaptic neuron as efficiently as the ON cells, due their lower instantaneous firing rates within a burst; (2) for a largewmax, the OFF cells won in most data sets in agreement with the linear model. The exact transition point from (1) to (2) depended on the data set (Table 2). Thus, fine-tuning ofwmaxis necessary to develop similar numbers of ON-selective and OFF-selective LGN neurons. Again, the sensitivity towmaxarises because STDP does not exploit the correlations between cells, but rather the time-averaged firing rates. In the regime ofR&1, the contributions of the potentiation and depression regions of STDP cancel with each other yielding dominance of the time-averaged firing rates and OFF segregation. In the less-relevant regime ofRw2, STDP suppresses cooperation between same type cells. While in the reduced linear model this increase inRresulted in a switch from OFF to ON segregation for data sets 4 and 6, in the full linear model and in the simulated integrate-and-fire model, it introduced stronger competition between same type than between opposite type RGCs, eventually eliminating segregation (Figure 4E, large R).
In summary, we showed that adding subtractive normalization to STDP resulted in ON/OFF segregation but the outcome was highly sensitive to the choice of parameters. For biologically-realistic depression-to-potentiation values of R&1, temporally-asymmetric STDP with normalization consistently favored one cell Table 2.Parameter sensitivity of STDP with subtractive
normalization.
Model set 1 set 2 set 3 set 4 set 5 set 6
2D linear OFF OFF OFF OFF OFF OFF
full linear OFF OFF — OFF OFF OFF
I&F withwmax~5 ON ON ON ON ON ON
I&F withwmax~8 OFF ON ON ON OFF ON
I&F withwmax~10 OFF ON ON OFF OFF —
I&F withwmax~15 OFF OFF ON OFF OFF —
I&F withwmax~20 — OFF — OFF OFF —
Segregation results are shown for the reduced two-dimensional linear model, the full linear model with all RGC inputs, and the nonlinear integrate-and-fire model with all RGC inputs for a biologically-plausible range of the depression-to-potentiation ratioR[½0:8,1. ON denotes ON segregation, OFF denotes OFF
type over the other, depending on the model of the postsynaptic neuron. We determined a parameter range for wmax where the linear model can approximate the nonlinear model, but to obtain an equal preference for ON or OFF segregation, fine-tuning of wmaxwas critical. Even though it is plausible that the sensitivity of the model to various parameters may be implemented by a biological system during development, the model predicts that the system will produce very different outcomes for any small perturbation induced by environmental changes, stochastic events, unreliable vesicle release, and so on, which seems unlikely. The millisecond-long integration timescales of STDP are too short to reliably sample the noisy correlation functions which naturally extend over much longer timescales, thus making STDP unsuitable to study segregation in this system. Later in the paper we explore a more appropriate plasticity rule modulating synaptic change and during development, which resulted in segregation without the need for presynaptic homeostatic control or careful parameter tuning (results summarized in Figure 4C).
Temporally-asymmetric STDP with second-long timescales favors ON segregation
A spike-based rule like STDP cannot explain ON/OFF segregation in the LGN without synaptic competition because tightly correlated retinal inputs of different cell type reliably drive postsynaptic activity within 5–10 ms. Even with subtractive normalization, the short timescales of STDP are ineffective at robustly driving ON/OFF segregation. Butts and Rokhsar [14] found that most information content of spontaneous retinal waves is contained over timescales of 100–1000 ms. Furthermore, Butts et al. [16] recently proposed a burst-based rule for modifying synaptic strength over second-long timescales in the developing retinogeniculate system. We next asked if any plasticity rule integrating pre- and postsynaptic activity over the relevant input correlation timescales of ON and OFF RGCs can explain segregation. Thus, we investigated a second plasticity rule, a modified STDP with extended spike integration timescales.
Vector fields and example trajectories in Figure 3B (theory) illustrate segregation scenarios produced with the reduced linear model for data set 1 with tz~t{~500ms in STDP. We confirmed these in Figure 3B (simulation) with the integrate-and-fire model where all ON (3) and OFF (3) inputs in data set 1 were used with multiple (discretely-sampled) initial conditions in ½0,wmax for the ON and OFF weights. As the depression-to-potentiation ratioRincreased, the region of initial conditions for which weights of both cell types potentiated was gradually replaced with a region of ON segregation. Segregation results followed a similar qualitative trend for the other five data sets (data not shown). In conclusion, modifying synaptic weights based on STDP with second-long timescales for spike integration to match input correlation timescales resulted in ON segregation for all data sets and for any combination of initial conditions. This effect was not only produced by the reduced linear model, but also by the simulated integrate-and-fire model for the LGN neuron. Despite different numbers of ON and OFF retinal inputs in each data set (Table 1), a subset of ON synaptic weights always potentiated, while all OFF weights were eliminated. Since LGN neurons can be both either ON- or OFF-responsive [17,38,39], we conclude that such a rule is implausible as it never results in OFF-responsive LGN neurons.
These modeling studies demonstrate that a plasticity rule for segregation does not only have to integrate pre- and postsynaptic activity over timescales matching those of the input correlations, but that other constraints are also required. Since the firing of ON RGCs precedes that of OFF RGCs, any rule which integrates
activity over the second-long correlation timescales, must do so without giving a naı¨ve advantage to the cell which fires first. STDP, on the contrary, favors synaptic inputs that can serve as ‘earliest predictors’ of other spike events [25,40]. Now we turn to BTDP which integrates pre- and postsynaptic bursts irrespective of their firing order.
Temporally-symmetric BTDP with second-long timescales robustly guides ON/OFF segregation
Can a temporally-symmetric burst-based rule integrating pre-and postsynaptic bursts over second-long timescales guide ON/ OFF segregation in the LGN? Such a rule, BTDP, was experimentally-proposed for the developing retinogeniculate system and tested in a model for eye-specific segregation using simulated retinal waves [16]. We found that BTDP robustly guides ON/OFF segregation in all data sets (Figure 5), without requiring homeostatic control of presynaptic connectivity to introduce synaptic competition. BTDP resulted in segregation assuming a realistic, experimentally-observed ratio of depression-to-potentia-tionR~I=Az (Figure 2B). (Although R is defined differently for STDP and BTDP, it has the same meaning in both rules.) Segregation outcome fell under two qualitative trends: dominance of ON segregation (data sets 1–3 in Dataset S1, Figure 5A) and dominance of OFF segregation (data sets 4–6 in Dataset S1, Figure 5B), where ‘dominance’ was defined as which cell type normally won, averaged over all initial conditions.
In Figure 5A (theory) we show the segregation outcome under the reduced linear model which used as inputs the correlation functions (Table 1 and Figure 1B) for data set 1, as a representative of data sets 1–3. Fixing the symmetric timescale of integrationtz and the maximum amplitude of potentiation Az according to Table 3, we varied the depression-to-potentiation ratioR~I=Az by changing the amount of depressionI. AsRincreased towards the experimentally-observed value of 0.42 [16], initial conditions which originally led to the maximal potentiation of both weights (top panel), now resulted in ON or OFF segregation (two middle panels). ON segregation was the only outcome for largeR(bottom panel). Further increasingRled to overall depression of all weights (data not shown). The results with the reduced linear model driven by the correlation functions of the most correlated ON and OFF cell pairs were confirmed when simulating spiking activity using a nonlinear integrate-and-fire neuron for the LGN neuron driven by all ON (3) and all OFF (3) spikes trains in data set 1 (Figure 5A, simulation). For each combination of initial conditions of ON and OFF weights and experimentally-observed ratio R&0:42 [16], some weights of only one cell type potentiated, while all weights of the other type depressed, indicating successful segregation (Figure 5A, simulation, third panel). Since there were different numbers of ON and OFF inputs in each data set (Table 1), our results show that segregation is robust and is not biased by the initial numbers of ON and OFF RGCs connecting to the LGN neuron. Furthermore, the match between anyRof the reduced linear and the simulated integrate-and-fire model was remarkably good. We called the trend illustrated in Figure 5A dominance of ON segregation, because for the experimentally-observed ratioR [16], more initial condition combinations resulted in ON segregation than in OFF segregation (Figure 5A, third panels). In particular, unbiased initial conditions for the ON and OFF weights (located along the main diagonal), and even a small OFF bias in initial conditions, resulted in ON segregation. Data sets 2 and 3 showed qualitatively similar dominance of ON segregation (data not shown).
Figure 5B (theory). As before, we increased R towards the experimentally-observed value of 0:42 [16] and saw that initial conditions which led to the maximal potentiation of both weights for smallR(top panel), now resulted in ON or OFF segregation (two middle panels). To obtain OFF segregation as the only outcome forRlarger than experimentally-observed in the same way we obtained ON segregation for data sets 1–3 in Figure 5A (bottom panels), we had to extend the correlation timescale (tON=ON) of ON RGC pairs in Figure 5B (theory, bottom panel). Simulating spiking activity using a nonlinear integrate-and-fire model for the LGN neuron driven by all ON (5) and all OFF (2) spike trains in data set 4 matched the segregation results from the reduced linear model, with a close correspondence ofR(Figure 5B, simulation). Later we discuss why for largeRthe simulated model, but not the theoretical model, resulted in OFF segregation for all initial conditions. As before, segregation was robust and did not depend on the initial numbers of ON and OFF retinal inputs
(Table 1). Data sets 4–6 showed dominance of OFF segregation, for the experimentally-observed ratioR[16] shown in Figure 5B (third panels). Furthermore, unbiased initial conditions for the ON and OFF weights (located along the main diagonal), and even a small ON bias in initial conditions, resulted in OFF segregation. Data sets 5 and 6 showed qualitatively similar dominance of OFF segregation (data not shown).
To summarize, we found that not only the second-long timescales of bursts integration are needed for segregation, but also the temporally-symmetric feature of BTDP. In particular, the negative and symmetric BTDP window at long temporal delays in firing, mutually inhibited the simultaneous growth of ON and OFF synaptic weights, thus providing the necessary synaptic competition without implementing additional homeostatic mech-anisms, in contrast to STDP. In Figure 4C, we summarize the segregation results of BTDP for all the data sets using experimental values ofR[16], and unbiased initial conditions. Figures 4C and
Figure 5. BTDP results in robust segregation.(A) Segregation results using BTDP for data set 1, a representative spike train recording of data sets 1–3 which have similar peaks of the pairwise input correlation for ON/ON and OFF/OFF pairs. Drawing conventions and legend as in Figure 2, and as beforewmax~5:0with discrete steps for the initial weights of0:5. As the depression-to-potentiation ratio in BTDP,R~I=Az, increases towards
the experimentally-observed ratio,R&0:42[16], theory and simulation show the segregation of ON and OFF RGC inputs (red and blue trajectories), emerging from a state where the weights of both cell types potentiate maximally for smallR(black trajectories). The region of initial conditions resulting in ON segregation is larger than the region resulting in OFF segregation, indicative of ON dominance (see main text). Similarly, unbiased initial conditions located along the main diagonal in each plot show ON segregation. (B) Segregation results using BTDP for data set 4, a representative spike train recording of data sets 4–6, which have higher OFF/OFF input correlation peaks than ON/ON peaks. AsRincreases, the dominant segregation outcome for a larger set of initial conditions is OFF segregation, in contrast to (A). While the match between theory and simulation is consistent for data sets 4–6 and experimentally-observedR[16], for data sets 4 and 5 a narrow range of large ratios (denoted byR) resulted in OFF segregation only in simulations (bottom panels). To match predictions of the two models for this larger than experimentally-observed R,tOFFwas made larger thantONin the theoretical model (from 0.327 to 0.500, Table 1).
5A,B demonstrate that the structure of the inputs, in combination with initial conditions for the ON and OFF weights, determine the segregation outcome such that data sets 1–3 showed dominance of ON segregation, while data sets 4–6 dominance of OFF segregation. Mathematical interpretation of the result based on this simple model is explored later in this paper.
Upper bound for synaptic weights does not affect segregation under BTDP
The ratio of final (wmax) to initial synaptic strength of the winning cell type after segregation indicates the total amount of synaptic strengthening during this stage of development. Chen and Regehr [6] showed that in addition to the pruning of RGC inputs converging to a single LGN neuron (fromw20inputs at birth, to 1–3 after eye-opening), synaptic weights strengthen *50-fold. According to more recent estimates, 5–8 input RGCs before the onset of glutamatergic waves refine to a few after eye-opening, but these studies did not report the total amount of synaptic strengthening during glutamatergic waves [41,42]. So far we explored the segregation outcome with BTDP for initial conditions uniformly distributed in the range½0,wmaxforwmax~5. To study the sensitivity to the upper weight bound wmax, we compared
simulations with BTDP usingwmax~5(Figure 6A) andwmax~20 (Figure 6B). We observed no differences in the segregation outcome for initial conditions in the region½0,5when both ON and OFF segregation occur, in contrast to STDP with subtractive normalization (Figure 4E). The main effect of increasingwmaxwas that simulations took longer to show segregation. Therefore, segregation results with BTDP are robust under changes in the scaling of synaptic weights. Note that the linear model is by design independent ofwmax, which supports its usefulness in predicting segregation.
The one-second offset in the firing of ON and OFF RGCs is necessary for segregation
Kerschensteiner and Wong [20] hypothesized that ON and OFF RGCs segregate in the LGN because of the one-second temporal offset in their precisely-ordered firing. We performed simulations with BTDP with the integrate-and-fire model in which we shifted the firing of the ON cells by one second such that it was synchronous with the OFF cells, and found that this abolished segregation (Figure 6C). Analyzing the reduced linear model where the ON/OFF and OFF/ON correlation functions were shifted such that the peak occurred at *0ms, also eliminated segregation (data not shown). This confirms that the temporal asynchrony is a necessary activity cue for the segregation of RGCs of different type, but not a sufficient cue. As we demonstrate next, the correlation structure of the inputs also significantly affects the segregation outcome.
Insights from the linear model: eigenvalue analysis We showed that BTDP can explain ON/OFF segregation in the developing LGN of mouse by integrating activity (i) over timescales relevant to the inputs, and (ii) irrespective of the order of pre- and postsynaptic activity. Furthermore, half of the studied data sets (1–3) demonstrated dominance of ON segregation, and the other half (sets 4–6) demonstrated dominance of OFF segregation. To understand why BTDP successfully captured segregation without additional homeostatic mechanisms (but not standard STDP, nor STDP with extended timescales), and to determine which features of the inputs specified ON versus OFF dominance, we dissected the linear model of Equation 7 (Materials and Methods).
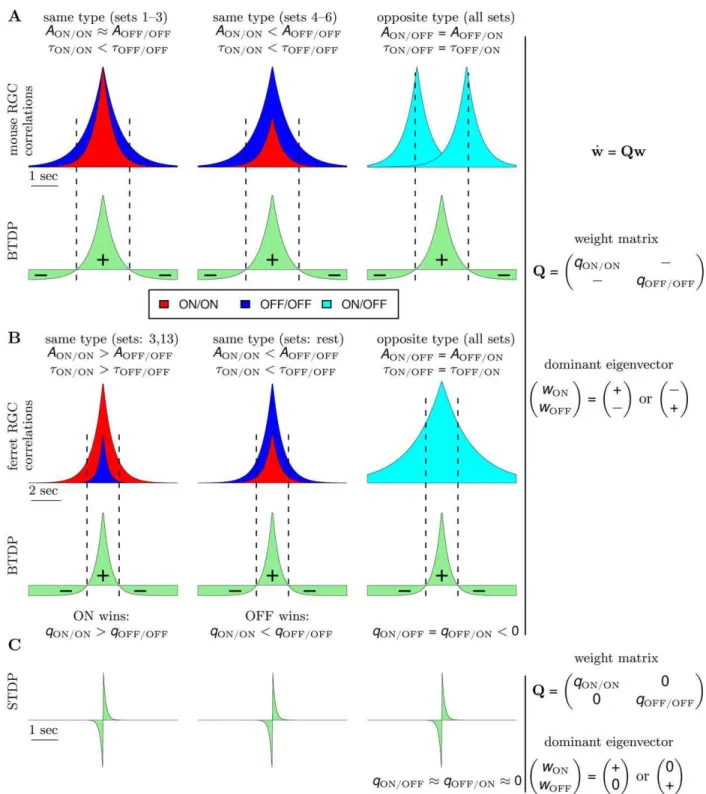
For comparison, in STDP with subtractive normalization the RGC firing rates dominated segregation due to the millisecond-long integration timescales, while the contribution from the correlations cancelled due to the temporal asymmetry of STDP. In BTDP, however, we show that the RGC correlations dominate segregation due to the matching second-long integration time-scales, and are further intensified by the temporal symmetry of BTDP. The entries in the plasticity matrix Q of Equation 8 (Materials and Methods) can be obtained by multiplying the area under the input correlation functions (Figure 1B) and the area under BTDP (Figure 2B). From the decaying exponential fits of the input correlations (Figure 1B and Table 1), we extracted a common feature among the six data sets to be a smaller decay timescale for ON/ON pairs than for OFF/OFF pairs (for data set 6 they are approximately equal), suggesting that ON cells fire shorter high-frequency bursts. On the other hand, after comparing correlation peaks for pairs of different cell types, we found that the six data sets form two groups, which coincide with the preference for ON or OFF dominance (Figure 4C). Data sets 1–3 have similar correlation peaks for ON/ON and OFF/OFF cell pairs (Figure 7A, left), while data sets 4–6 have a higher correlation peak for OFF/OFF pairs than for ON/ON pairs (Figure 7A, middle). Correlation functions for different type RGC pairs are Table 3.Model parameters for generation of LGN activity
using the linear model (theory) and the integrate-and-fire model (simulation), and for synaptic modification induced by STDP or BTDP.
Parameter Notation Value
Theory
EPSP kernel
t1(ms) 10
100
t2(ms) 5
50
STDP/BTDP Az 0.001
Simulation
Integrate-and-fire a 0.02
b 0.2
c 250
d 2
Vth 30
STDP/BTDP A
z 0.0005
0.0001
Common parameters
Upper synaptic bound wmax 5
10
20 STDP
tz (ms) 20
10
500
t{ (ms) 20
60
500 BTDP
tz (ms) 500
reflections of each other about 0 seconds and have a peak located at+1second (Figure 7A, right). Therefore, a significantly larger area of the correlation function of different type RGC pairs falls under the negative part (than under the positive part) of BTDP (Figure 7A, right). This results in negative off-diagonal entries in the plasticity matrix Qof Equation 8 (Materials and Methods), which are equal due to the reflection about 0 seconds, qON=OFF~qOFF=ON~xv0:
Q~ qON=ON x
x qOFF=OFF
" #
: ð1Þ
A matrix of this form has eigenvalues
l1,2~ 1
2 qON=ONzqOFF=OFF
+1
2
ffiffiffiffiffiffiffiffiffiffiffiffiffiffiffiffiffiffiffiffiffiffiffiffiffiffiffiffiffiffiffiffiffiffiffiffiffiffiffiffiffiffiffiffiffiffiffiffiffiffiffiffiffiffiffiffiffi qON=ON{qOFF=OFF
2
{4x2 q
[ R
ð2Þ
wherel1wl2(l1corresponds to the expression with ‘z’ andl2 with ‘{’ sign). The eigenvector, ½z,{T, corresponding to the larger eigenvaluel1and segregation of the weights, is dominant;
the other eigenvector, ½z,zT, corresponding to l2 and potentiation of both weights, is suppressed (here, z and { indicate positive and negative entries in each eigenvector, and T denotes transpose). Segregation outcome depends on the relative size of the main diagonal terms inQ. For data sets 1–3 where the peaks for ON/ON and OFF/OFF cell pairs are similar, a larger area of the OFF/OFF correlation (than of the ON/ON correlation) falls under the negative part of BTDP (Figure 7A, left). This givesqOFF=OFFvqON=ONand resulted in dominance of ON segregation in our simulations (Figure 4C). For data sets 4–6, with larger OFF/OFF correlation peaks compared to ON/ON correlation peaks, a larger area of the OFF/OFF correlation (than of the ON/ON correlation) falls under the positive part of BTDP (Figure 7A, middle). This givesqOFF=OFFwqON=ONand resulted in dominance of OFF segregation in our simulations (Figure 4C).
Even though this interpretation of the reduced linear model does not directly use the recorded spike trains in each data set (whereas the simulated integrate-and-fire model does), but instead uses fitted estimates of the correlations computed from the most correlated cell pairs, results from the linear and integrate-and-fire models agree (Figure 5). We observed an inconsistency only in data sets 4 and 5 forRlarger than experimentally-observed, where the original correlation peaks and timescales from Table 1 resulted in dominance of ON segregation (data not shown). In this case, the
Figure 6. Features which guide segregation under BTDP.(A) Temporal evolution of synaptic weights withR~I=Az~0:30for data set 1 (3
ON and 3 OFF cells), as in Figure 4A, for initial conditions when the ON (first column) or the OFF cells (second column) segregate. Similarly, sample trajectories for data set 4 (5 ON and 2 OFF cells), as in Figure 4B, for initial conditions where the ON (third column) or the OFF cells (fourth column) segregate. Upper bound on the weightswmax~5. Even though there are more ON than OFF inputs in data set 4, the outcome does not depend on the number of ON and OFF inputs, but on the initial conditions of the synaptic weights. Furthermore, a simple bias in the initial conditions does not always result in segregation towards the biased cell (see Figure 4 for the segregation outcome for all initial condition combinations). (B) Increasing the upper bound of the weights towmax~20does not affect the segregation outcome; weights simply take longer to segregate. (C) Delaying the time of the spikes of ON cells by 1 second, such that they are synchronous with OFF cells, eliminates segregation.
Figure 7. Insights into ON/OFF segregation from the linear model.(A) (left) ON dominance. Factors which determine segregation for data sets 1–3 (data set 1 in Figure 4A) with similar correlation peaks of ON/ON and OFF/OFF pairs. Segregation is the result of a trade-off between the relative areas of the input correlation functions for ON/ON (red) and OFF/OFF (dark blue) pairs integrated by the positive and negative parts of BTDP (green). BTDP favors ON segregation because the smaller area of the ON/ON correlation under the negative part of BTDP (denoted by{) dominates the larger area of the OFF/OFF correlation under the positive part of BTDP (denoted byz). Therefore,qON=ONwqOFF=OFFin the plasticity matrixQ (Equation 1). (middle) OFF dominance. Factors which determine segregation for data sets 4–6 (data set 4 in Figure 4B) with larger correlation peaks of OFF/OFF than ON/ON pairs. BTDP favors OFF segregation because the larger area of the OFF/OFF correlation under the positive part of BTDP dominates the smaller area of the ON-ON correlation under the negative part of BTDP, such thatqON=ONvqOFF=OFFin the plasticity matrixQ (Equation 1). (right) The reflected (about 0 seconds) input correlations between cells of different type (light blue) have a larger part of their areas under the negative part of BTDP, ensuring negative off-diagonal termsxinQ(Equation 1) and introducing competition. (B) (left) Input correlation functions for two of the 15 ferret data sets illustrate dominance of ON segregation. (middle) Input correlation functions for the remaining 13 ferret data sets illustrate dominance of OFF segregation. (right) The input correlation function between cells of different type peaks at 0 seconds for ferret, however, the wide correlation timescale (wider than in mouse) still produces negative off-diagonal termsxinQ(Equation 1), and correspondingly, competition between the ON and OFF weights. (C) STDP drawn to scale to compare its spike integration time window with the timescale of input correlations shown in (A) and (B). The near-0 off-diagonal terms inQ(Equation 3) inhibit segregation.
larger area of the OFF/OFF correlation (than of the ON/ON correlation) falling under the positive part of BTDP, is not large enough to counteract the larger area of the OFF/OFF correlation (than of the ON/ON correlation) falling under the negative part of BTDP. To achieve the expected dominance of OFF segregation, we had to increase the decay timescale of the ON/ON correlation (Figure 5B, theory, bottom panel). The simulated integrate-and-fire model using the recorded spike trains (instead of the ON/ON correlations) successfully captured segregation with OFF domi-nance (Figure 5B, simulation, bottom panel). This suggests that real spike trains may contain higher-order moments which are not always captured by the pairwise correlations of Figure 1B, or that some nonlinear effects of the integrate-and-fire model dominate segregation outcome. Note that this mismatch between the reduced linear and the integrate-and-fire model occurred only for a small range ofRlarger than experimentally-observed, and for only two of the six data sets.
In Figure 7C we show a sketch of standard STDP to illustrate the contrast in timescales of spike integration and input correlations. STDP ignores the peaks of the ON/OFF and OFF/ON correlation functions located at +1second, and the resulting plasticity matrix has off-diagonal entries close to 0 (for R&1)
Q~ qON=ON 0
0 qOFF=OFF
" #
: ð3Þ
With eigenvectors equal to½z,0Tand½0,zT, the reduced linear model offers a simple explanation about why STDP failed to capture segregation for R&1 and without normalization con-straints. Note that the main diagonal entries are large and positive, due to the contribution from the autocorrelations in Equation 8 for Q(Materials and Methods), as discussed previously. IncreasingR introduced the required asymmetry for competition between the two weights. This follows from the current analysis because large Rmakes the off-diagonal entries inQnegative as in Equation 1. Extending integration timescales of STDP to the relevant input correlation timescales results in the plasticity matrix
Q~ qON=ON z
{ qOFF=OFF
" #
, ð4Þ
where qON=OFFw0 since the ON/OFF correlation peaks at
z1second, while qOFF=ONv0 since the OFF/ON correlation peaks at {1second. This analysis of the modified STDP rule explains why it always resulted in ON segregation in our simulations.
In summary, we have shown that BTDP can explain ON/OFF segregation in the developing mouse LGN driven by spontaneous retinal waves. BTDP promoted cooperation between weights of same type cells and competition between weights of different type cells without additional homeostatic control. We predicted that the LGN neuron will become ON- or OFF-responsive based on a local competition of the firing patterns of neighboring RGCs connecting to it, whose most relevant features for segregation are contained in the pairwise temporal correlations. As ON bursts are shorter than OFF bursts as suggested by the smaller correlation timescales, under BTDP this would suggest dominance of ON segregation. However, if OFF bursts are more highly correlated as suggested by the higher correlation peaks, then the result is dominance of OFF segregation. In particular, we saw that ON and OFF RGCs with sufficiently-different firing properties to compete
for the wiring of the LGN neuron, are located close to each other (within 50mm). Thus, it is possible that RGC axons which lose the competition at one LGN neuron because of stronger competitors, win at another. This developmental mechanism is similar to that seen in mouse neuromuscular junction where the fate of axonal branches is dependent on the identity of the axons with which they compete [43].
ON/OFF segregation in ferret
The BTDP model we just described suggests how spontaneous retinal waves can instruct ON/OFF segregation in individual LGN neurons in mouse. Is this result specific to mouse RGCs, or might this model explain segregation in other systems? The firing properties during retinal waves in ferret significantly differ from those in mouse [22]. During the period of ON/OFF segregation in ferret, RGCs of different type fire synchronously, with OFF cells having a significantly higher firing rate than ON cells [21,22]. In addition, we found that pairs of different type in ferret are correlated over longer timescales than pairs of different type in mouse. In a Hebbian covariance-based model with presynaptic threshold, Lee et al. [22] showed how these patterns can instruct ON/OFF segregation in ferret LGN. We demonstrate that our model with BTDP can also explain ON/OFF segregation in ferret and that it is consistent with the model of Lee et al. [22] (Text S1). Using the recorded spike trains from the Lee at al. study (15 sets in Dataset S1, each consisting of one ON and one OFF RGC spike train recorded with single electrodes) [22], we simulated the spikes of a postsynaptic LGN neuron using an integrate-and-fire model. As before, synaptic modification was subject to STDP or BTDP, and synaptic weights were bounded between 0 andwmax. In Table S1, we list the segregation outcome using each plasticity rule. Segregation was more easily achieved than in the mouse model as we only used one ON and one OFF RGC. Thus, as in the reduced linear model, we saw that standard STDP required large ratios of depression-to-potentiation to capture segregation. In contrast, BTDP successfully interpreted firing patterns into segregation for experimental parameters ranges [16].
model similarly predicted dominance of OFF segregation in 13 of the 15 data sets (and of ON segregation in the other two data sets). To achieve ON segregation in the majority of the sets with OFF dominance, Lee et al. [22] introduced an inhibition termC. As our model of BTDP using realistic retinal input patterns succeeded in capturing segregation in both mouse and ferret, we suggest that the rules that govern ON/OFF segregation are likely shared between species.
Discussion
We have used analytical methods and computational simula-tions to test the hypothesis that spontaneous retinal activity guides the segregation of ON and OFF RGCs in the developing mouse LGN. We have compared two plasticity rules for the development of synaptic weights: STDP and BTDP. Modifications to these rules adapted to the characteristics of the input firing patterns have also been considered. Our results show that STDP alone fails to segregate ON and OFF inputs under realistic ratios of depression-to-potentiation. STDP can segregate mixed inputs when combined with a homeostatic mechanism such as subtractive normalization, however the results are highly sensitive to parameters. By comparison, the recently-proposed BTDP rule [16] robustly segregates ON and OFF inputs in a model LGN neuron by a local comparison of the firing properties of neighboring RGC inputs without requiring normalization. Although ON cells are normally favored to win the competition because they fire before OFF cells, our analytical work indicates that the relative magnitude of the peak correlation of inputs influences which population (ON or OFF) wins the competition. Hence, if OFF RGCs are more strongly correlated than the ON RGCs, they can win the competition. Further, our model with BTDP can also account for segregation of inputs in the developing ferret LGN. Our work also highlights the importance of working with experimentally-recorded spike trains, rather than using syntheti-cally-generated Poisson inputs, as the nature of these correlations can strongly influence developmental outcome.
Twenty years after the initial discovery of retinal waves, there is still an ongoing debate on if, and how, spontaneous activity influences the development of neural connections [7,8]. The experimental report by Kerschensteiner and Wong [20], on which we have based our modeling, suggests that retinal waves provide an instructive signal during the developmental age addressed. The specific firing patterns of functionally-distinct RGCs they observed are only present during glutamatergic waves and coincide with the period of ON/OFF segregation [44]. Before the switch to glutamatergic waves which occurs as circuits in the developing retina mature, cholinergic waves with different spatio-temporal propagation properties are believed to instruct eye-specific (left-eye/right-eye) segregation [7] (though see [8]). Theoretical models have mostly studied the influence of cholinergic retinal waves upon the development of neuronal connectivity in the context of the eye-specific segregation [16,45]. As far as we know, our model is the first to address refinements driven by the later-stage glutamatergic waves. While eye-specific segregation in the LGN has been suggested to be driven by summed activity over local regions in the retina [16], our prediction is that more relevant for ON/OFF segregation in the LGN is activity between RGC pairs (as in the reduced linear model). This is likely due to the continued decreased convergence of retinal afferents per LGN neuron during development [6,41,42], and receptive field development [39,46].
In this paper we have taken two complementary approaches to studying segregation of ON and OFF inputs. With simulations, we
were able to use the experimentally observed RGC spike trains to generate spiking behavior in a nonlinear integrate-and-fire model; by contrast with a reduced linear model we used only the input correlations of the most correlated cells. The broad similarity in our results between simulation and theory under the more relevant BTDP plasticity rule suggests that the mechanisms for synaptic change guided by spontaneous retinal waves are robust and do not require the precision of individual spikes. Thus, the effect of future manipulations of activity on segregation would not need to be tested with complex spiking models, but predictions can be made with simpler models which use spike-spike correlations over the relevant timescales. Detailed models of retinal wave activity could also help investigate this question, however currently they only model the early cholinergic waves [47–49].
Unsurprisingly, we found that a synaptic plasticity rule like STDP, which integrates spikes on much shorter millisecond-long timescales than the relevant timescales of the input correlations, failed to segregate ON and OFF inputs. STDP usually resulted in the strengthening of synaptic weights of both cell types, suggesting a lack of competition. STDP induces competition among synaptic weights when the depression area of the STDP window is slightly larger than the potentiation area (Rslightly larger than one) under independent Poisson input statistics [25]. Compared to Poisson statistics, real RGC spike trains are highly correlated and can more efficiently drive a postsynaptic neuron. Hence, our model showed that physiologically unrealistic, large depression-to-poten-tiation ratios were necessary for segregation. When multiple retinal spike trains were used as inputs to an integrate-and-fire model LGN neuron, often even large ratios could not rescue segregation. This was due to the independence in the firing of multiple ON and OFF RGCs over the short timescales of STDP, which resulted in nonselective (same cell type) competition. As an alternative to large depression-to-potentiation ratios, subtractive normalization can induce competition [27,45]. While this rescued segregation, it was highly sensitive to parameter variation (Figure 4D,E and Table 2). This sensitivity arises as the short integration timescales of STDP fail to reliably sample the noisy (but approximately constant) correlation functions which extend over much longer timescales. Due to the temporal asymmetry of STDP and the mismatch of timescales, potentiation and depression effects cancel, reducing the signaling component of STDP for segregation. Thus, STDP does not utilize the correlations between cells for segregation, but rather the cells’ time-averaged firing rates.
In addition to normalization constraints, it is possible that segregation might result from an alternative implementation of a spike-based plasticity rule which involves higher-order spike integration [11–13,50]. While an exhaustive exploration of all forms of STDP is unfeasible, one spiking plasticity rule stands out as promising: a simple spike-coincidence rule which modifies synaptic strength based on the number of coincident pre- and postsynaptic spikes in a 50-millisecond time window, proposed by Butts et al. [16]. Butts et al. [16] showed that in their highly constrained experimental protocol of pairing one-second-long bursts to examine induced plasticity, this rule was equivalent to the proposed BTDP. Implementing such a spike-coincidence rule in our model with the recorded RGC spike trains, however, did not produce segregation results consistent with BTDP (data not shown), suggesting that real spike trains contain higher-order spike dependencies that cannot be captured within a simple spike-coincidence rule.
![Table 1. Peak amplitudes and decay time constants of the symmetric fall-off exponential fits to the correlation functions of the most-correlated input pair from spontaneous retinal wave recordings by Kerschensteiner and Wong [20] (values given as estimate+](https://thumb-eu.123doks.com/thumbv2/123dok_br/18302312.347813/3.918.93.831.90.422/amplitudes-constants-exponential-correlation-correlated-spontaneous-recordings-kerschensteiner.webp)