Neurophysiological correlates of color vision: a model
Arne Valberg
1and Thorstein Seim
21- Norwegian University of Science and Technology, Trondheim, ST, Norway 2- MikroSens, Slependen, AK, Norway
Abstract
The tree-receptor theory of human color vision accounts for color matching. A bottom-up, non-linear model combining cone signals in six types of cone-opponent cells in the lateral geniculate nucleus (LGN) of primates describes the phenomenological dimensions hue, color strength, and lightness/brightness. Hue shifts with light intensity (the Bezold-Brücke phenomenon), and saturation (the Abney effect) are also accounted for by the opponent model. At the threshold level, sensitivities of the more sensitive primate cells correspond well with human psychophysical thresholds. Conventional Fourier analysis serves well in dealing with the discrimination data, but here we want to take a look at non-linearity, i.e., the neural correlates to perception of color phenomena for small and large fields that span several decades of relative light intensity. We are particularly interested in the mathematical description of spectral opponency, receptive fields, the balance of excitation and inhibition when stimulus size changes, and retina-to-LGN thresholds. Keywords: human color vision, opponent theory, three-color theory, three-receptor theory, perception, neuroscience.
Received 1 February 2012; received in revised form 2 July 2012; accepted 16 July 2012. Available online 18 November 2013.
Arne Valberg, Norwegian University of Science and Technology, Section of Biophysics and Medical Technology, N-7491 Trondheim, Norway. Thorstein Seim, MikroSens, Nedre Ås vei 63, N-1341 Slependen, Norway. Correspondence regarding this article should be directed to: Arne Valberg, NTNU, Institute of Physics, N-7491 Trondheim, Norway. Phone: +4773900754. E-mail: [email protected]
Introduction
Current neuroscience has a good understanding of the three-receptor theory of color vision, but the opponent-color theory (Hering, 1920) still lacks important neural correlates. Even though one still searches for neural processes that underlie the perception of the elementary colors (yellow, blue, red, green, white and black), the opponent color theory is as relevant as before. The chromatic unique hues help us orient ourselves in color space more or less like four compass directions
help orientation on the map. Scientiic investigations
imply that the elementary colors are associated with measurable physiological processes or states of the brain. How this comes about is unknown and poses a fundamental philosophical question, e.g., how can a perceived quality like a certain color be related to a physical-chemical state or process? Color qualities are
different from such processes, and clariication of their
status within natural science must deal with the physical conditions for perception as well as thorough knowledge of correlations between the qualitative properties and neural activity in the visual pathway.
By the 1960s, visual neuroscience had made great advances. Thorsten Wiesel and David Hubel (1966),
and Russell De Valois (1965) in the U.S. started recording the activity of single neurons in the primate
visual pathway. These recordings largely conirmed
the idea behind zone theories (e.g., Müller, 1930) and Schrödinger’s (1925) transformations, although it later
became clear that some modiications were necessary.
Further quantitative data were gathered at the end of the millennium in Otto Creutzfeldt and Barry B. Lee’s laboratories at the Max Planck Institute for Biophysical Chemistry in Göttingen, Germany. Around 1980, one of us (A.V.) was invited to join this team. Our recordings from opponent cells in the retina and lateral geniculate nucleus (LGN) of the macaque monkey (Macaca fascicularis) led to a physiological model of color vision that accounts for several color phenomena and psychophysical data (Valberg et al., 1986a; Lee et al. 1987).
In this paper we provide an overview of the model by listing its main features and their relation to the phenomenology and neurophysiology of color vision. The main purpose is to point at some factors that need incorporation in this and all similar physiological color vision models. In addition to spectral opponency, relations that must be considered in a revised version are as follows:
• receptive ields and the response of opponent
neurons to changing size of the stimulus
• the excitatory/inhibitory balance within the
opponent receptive ield that must be independent
of stimulus size (Seim and Valberg, 2013)
A physiological model of color vision
Recent studies of color vision (see Shapley and Hawken, 2011 for a review) have mainly dealt with the properties of the neural channels that lead from the retina via the lateral geniculate nucleus to the higher visual centers of the brain. Anatomical and morphological studies have been complemented with neurophysiological recordings, the latter often using system-theoretical methods like mathematical Fourier analysis of sensitivity and response (Lee et al., 1990; Smith et al., 1992). Within this mechanistic
framework the nerve cells are treated as ilters of optical
information. Cells are characterized by their behavior to threshold contrasts and frequencies within the temporal and spatial domains. This approach is, ideally, limited to linear systems. Therefore, in visual science such analysis is adequate for neural activities at or near the threshold of visibility. It gives a rapid and useful overview of functional importance. This method is a useful supplement but is perhaps less intuitive than more traditional studies of neural correlates to perception of color phenomena that spans several decades of relative light intensity. Under normal conditions on a sunny day, for a given adaptation, the activity of receptors
and nerve cells must cope with at least ive logarithmic
units of intensity, that is a ratio of more than 1:100,000 between the lowest and the highest luminance, and non-linear behavior is the rule.
Experiments have shown that psychophysical detection of color thresholds of humans, e.g., spectral sensitivity to small spots projected upon a white background, corresponds well with the threshold sensitivity of the most sensitive opponent LGN cells of the macaque monkey (Lee et al., 1987). Also, the achromatic interval between detection and the discrimination of hue corresponds nicely with the sensitivity difference of non-opponent magnocellular cells (MC cells) and of opponent cells (of either the parvocellular (PC cells) or the koniocellular types (KC cells)) (Valberg and Lee, 1989). Moreover, at the suprathreshold level, the same size color differences and color scaling was found to correlate with relative
iring rates in a network model combining six different
types of opponent cells. The same applies to the change of hue with intensity (the Bezold-Brücke phenomenon) and saturation (the Abney effect) (Valberg et al., 1991). In these experiments, large and small chromatic and achromatic stimuli of different relative intensities were alternated with a 4 x 5 deg2 white adaptation ield of
constant luminance.
However, after the recent inding of a substantial
threshold in the afferent prepotential activity that elicits
a LGN response (particularly for small test ields; Seim
et al., 2012), improvements can be expected in the modelling of LGN cell responses. Below we shall take
a closer look at the consequences of this new inding for
the modelling approach.
The irst step is the excitation of cones by light
absorption. For cone absorption spectra we use used
the Stockman-Sharpe cone fundamentals L, M and S (Stockman & Sharpe, 2000, generally accepted by CIE). The receptor hyperpolarization, VM, evoked by light can be described by the hyperbolic Naka-Rushton formula of receptor excitations M:
VM = Mn/(Mn + σn
M) Eq. (1)
for the M-cone and similarly for responses VL and VS
of the two other cone types. The exponent n is allowed to vary between 0.7 and 1.0 (Valeton & van Norren, 1983). σ is the half-saturation constant (a parameter that is interpreted as a sensitivity measure) with a different value for each cone type. It was allowed to vary freely during simulation. This formula is sometimes called the Michaelis-Menton function but can also be traced back to Archibald Hill (1910). The exponent n is often
called the Hill coeficient (Hsien-Che Lee, 2005). When
plotted on a logarithmic luminance x-axis, this equation gives the characteristic sigmoid I-R curve for the cone response.
Let us use an ‘L-M’ opponent PC cell to illustrate the simulation procedure. The cell receives its (prepotential)
input from a retinal ganglion cell G. To model the iring
rate NG of the retinal ganglion cell in imp/s, we use the equation
NG = NL - NM, Eq. (2)
where NL = ALVL and NM = AMVM and AL and AM are amplitude scalars for the L and M cone contributions, respectively. The eye was adapted to a large achromatic
ield A that was shortly replaced by the test stimulus.
The recorded ganglion cell input (the prepotential NP)
was the difference between the response to the test ield
NG and the adaptation value NGA. The response is then:
NP = NG - NGA = NL - NM - N0, Eq. (3)
where the L and M responses to the adaptation ield are
included in a single constant N0. The response of the ‘L-M’, LGN cell is then described by the equation
NLGN (L-M) = ALVL - AMVM - N0 Eq. (4)
where ALand AM are amplitude weighting constants. In the early version of the model (Valberg et. al., 1987), N0
represented the anticipated activity of the LGN cell for
zero luminance (when the adaptation ield was replaced by a black ield). Later, due to the discovery of a relatively
high prepotential threshold spike frequency (a relative high frequency of the retinal ganglion cell response was
required before the LGN cell started to ire, see Seim
et al., 2012), it became necessary to give N0 the new interpretation that it represents the anticipated activity
of the prepotential (from the retinal ganglion cell) for a
zero luminance test ield. In the optimization routine, N0
improved response simulations with values of n usually larger than 0.7.
The general version of Eq. (4) is given in Eq. (5) below with opponent combinations (differences) of cone output signals, VS, VMand VL:
NLGN = ± ALVL ± AMVM ± ASVS - N0 Eq. (5)
For each cell, the optimization of the parameters in Eq. (5) was achieved by minimizing the root mean square differences (rms) in iring rates between the measured
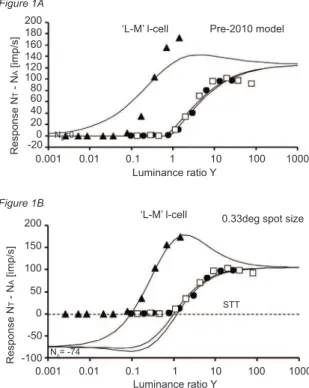
responses in an I-R series and those predicted by the model. Figure 1A shows an example of the simulation according to the “Pre-2010” version of the model (that
did not work well for small test ield sizes as seen here for the 699 nm stimulus (illed triangles)). Figure 1B
displays the much improved results when N0 is allowed to go negative (relative to the LGN cell response).
Figure 1. (A) The data points show the recorded response to a 0.33 deg stimulus for three wavelengths. The cell was
a parvocellular (PC) LGN cell with ‘L-M’ opponency (illed triangles: 699 nm; open squares 529 nm; illed circles: 500
nm). The curves show the best simulation of the responses by the “Pre-2010 model” using N0 = 0 imp/s, and the exponent n = 0.7 in the response equation. The result is worse for the 699 nm stimulus. (B) Simulation of the same data as in (A) but using the revised model described in the text, with a negative N0 = -74 and an exponent n = 1.0. STT is a signal transfer
threshold (of the prepotential iring) that must be reached by the retinal input before the LGN cell starts to ire. The root
mean square (rms) deviation between data and model is 2.5% of maximum response.
When the adaptation state of the cells was changed by projecting a steady white surround of different luminance around the test spot, the I-R curves were
shifted horizontally without changing their shape (Valberg et al., 1985). This is consistent with the half-saturation constants σ in Eq. (1) being multiplied by the same constant factor for both the L- and M-cones. Increasing the test stimulus size to exceed
that of the receptive ield center usually reduced the
responsiveness (amplitude) of the LGN cell, but equally for excitatory and inhibitory processes. This attenuation of the modelled I-R curve is achieved by reducing the amplitudes AL and AM by the same factor (see Eq. (4)).
Interpretations
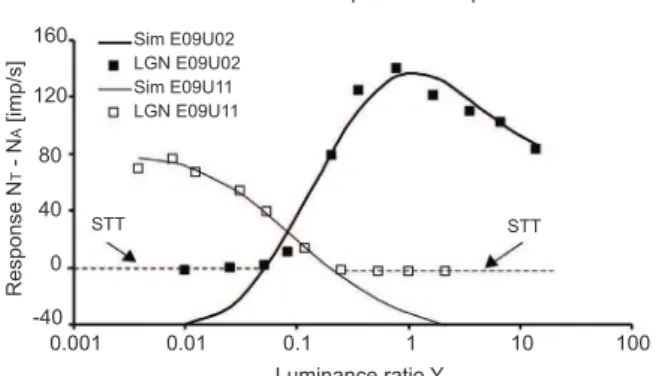
As a result of this extended and improved model, new insight was gained as to the role of each cell type in processing color information (Valberg & Seim, 2008; Valberg, 2005). For instance, Increment (I cell) and Decrement (D cell) cells (the ON- and OFF-types) can be shown to have opposite roles in discriminating graded luminance and chrominance (see Figure 2). Let us summarize:
• There are mainly four LGN parvocellular cone-opponent cell types that combine L- and M-cones; the ‘L-M’, I cells and the ‘L-M’, D cells, the ‘M-L,’ I cells and the ‘M-L’, D cells (Kaplan & Shapley, 1982). S-cones are connected to the ‘M (+L) –S’ cells and ‘S-L (+M)’ cells in the konicellular pathway (Martin et al., 1997).
• After an initial threshold, the iring frequency
of most opponent parvocellular LGN cell types
to large ields can be mathematically simulated
by means of opponent inputs of excitatory and inhibitory cone signals (proportional to receptor potentials).
• Whereas for a given adaptation, linearity between stimulus strength and response magnitudes applies only over a relatively narrow stimulus range, non-linear hyperbolic functions (Eq. (1)) work well for the cones over 5-6 logarithmic units of stimulus intensity.
• For opponent cells or a combination of opponent
cells, the iring rate in response to a chromatic
stimulusrelative to that for a white stimulus of the same luminancecorresponds to color strength or chroma (as, for instance, in the Munsell system).
• The magnitude of the responses (iring rates) of
these cells can be regarded as vector-lengths in an opponent color diagram.
• None of the color-space axes deined by the responses
of these six cell types (see above) corresponds to the
directions deined by the unique hues.
• A constant ratio of iring rates (responses) between
cells with different opponencies corresponds closely to a perception of constant hue. This also accounts for the Abney effect (the change of hue with saturation).
• As the luminance of a chromatic stimulus
increases, the magnitude and ratio of iring rates
of orthogonal opponent cells change as expected 200
180 160 140 120 100 80 60 40 20 0 -20
200
150
100
50
0
-50
-100
0.001 0.01 0.1 1 10 100 1000
0.001 0.01 0.1 1 10 100 1000
Response
N
t
-
N
a
[imp/s]
Response
N
t
-
N
a
[imp/s]
‘L-M’ l-cell
‘L-M’ l-cell
STT
0.33deg spot size Luminance ratio Y
Luminance ratio Y
Pre-2010 model
N0=0
N0= -74
Figure 1A
for the Bezold-Brücke phenomenon (when hue and chroma are combined) (Valberg et al., 1991).
• Brightness is well accounted for by the combined responses of L/M, I cell types. Similarly, blackness (the opposite of lightness and brightness) is well accounted for by the combined responses of L/M, D cell types (Figure 2; Valberg and Seim, 2008).
• The balance of cone inputs to an opponent cell
is stable and does not change with test ield size
(Seim et al., 2012; Seim and Valberg, 2013).
Figure 2. The distribution of information about light increments and light decrements on two opponent parvocellular cell types; the Increment and the Decrement cells (ON and OFF cells). The signal transfer threshold STT is somewhat higher than -40 imp/s in both cases. As in Figure 1, only a model with a high threshold value is able to account for the recorded data.
Comments
Obviously, conscious perception of color qualities arises neither in the photoreceptors nor in the opponent cells of the retina and the LGN. However, constancy of several color percepts (such as a constant hue, constant chroma (color strength), constant chromaticity, etc.) seem to correlate with constancy in the relative responses of opponent neurons. Newton said that “the rays are not
coloured.” With due respect to Helmholtz, we must add
that “colours neither reside in the receptors nor in the
cone-opponent cells of the retina and LGN” (see Valberg,
2001). However, the same perceptual attribute (as, for example, a certain orange hue independent of purity) seems to correlate with a constant ratio of response magnitudes between cone-opponent neurons. Constant
color strength (chroma) in an equiluminous chrominance diagram correlates well with a constant vector length from the white point in a vector space based on neural responses.
PC- and KC-cone opponent channels have important roles in color vision, whereas the retinal parasol cells that projects to the LGN magnocellular cells, sum L- and M-cone inputs and do not contribute directly to
color vision. Their second harmonic |L-M| rectiied
opponent response correlates with border distinctness between equiluminant chromatic stimuli (Valberg et al., 1992). These transiently responding magnocellular cells have an unusually high luminance contrast sensitivity and a spectral sensitivity that corresponds closely to the
human CIE luminous eficiency function V(λ) (Lee et
al., 1988). Because stimuli that have a luminance above the magnocellular threshold, but below the chromatic threshold of PC and KC cells, have a colorless, achromatic appearance, it has been speculated that magnocellular cells contribute to the surface perception of white (Hofer et al., 2005). However, their transient
iring of impulses speaks against such a possibility.
As indicated by the word “bistratiied,” S-cone activated cells have peculiar dendritic ields different
from those of the midget ganglion cells. Their dendritic
ield branches in two layers corresponding to the ON
and OFF layers of other retinal cells (Dacey and Lee,
1994). Until recently there were so few indings of cells
with excitatory L/M input combined with inhibitory S-cone input that there were reasonable doubts that they could play a role in color coding, but today this doubt has been removed (Valberg et al., 1986; Dacey and Packer, 2003; Tailby et al., 2008). Cells with excitatory L/M cone input and inhibitory S-cone input discriminate well between stimuli along a white-yellow dimension in color space (but not in the white-blue direction), contrary to PC-cells. Cells with an excitatory S-cone input discriminate well between blue and white stimuli.
LGN and beyond
The discovery of a substantial prepotential threshold spike frequency (the STT; Seim et al., 2012) has lead to an improved simulation of LGN cell responses. This threshold leads to I-R curves that span a larger stimulus
range, resulting in a larger Hill coeficient, n, in Eq. (1). The important fact that color vision is stable and largely independent of stimulus size and adaptation
inds its theoretical support in the simulations where
the ratio of half saturation constants, σL/σM, and of the opponent response components, NL/NM, are independent of stimulus size and light level (Seim et al., 2012; Seim and Valberg, 2013).
The primate receptive and perceptive ields (Spillmann, 1971) associated with the dendritic ields
of opponent cells are still discussed. The current debate is concerned with the organization of cone opponency in simple concentric and double opponent cells. For the retina and LGN, the classical view is one of a center and surround organization that for I-center cells form
a “Mexican hat” spatial sensitivity proile with an
excitatory cone type in the center and another inhibitory cone type in the surrounding annulus. This spatial
sensitivity proile has commonly been modelled as a
Difference of Gaussian (DoG) function. However, due to some inconsistencies in the DoG modelling of the response of an opponent cell as a function of stimulus size, it appears that power functions would be better (Seim et al. 2011; 2012). The relative size of center and surround seems to vary among cell types, and cells with S-cone inputs seem to have coextensive or overlapping
excitatory and inhibitory receptive ields. Higher up, in area V1 of the brain, one frequently inds so-called double opponent receptive ields with one cone
opponency in the center (e.g., L–M) and the opposite l-and D-cell response overlap
Sim E09U02 LGN E09U02 Sim E09U11 LGN E09U11
Response
N
t
-
N
a
[imp/s]
160
120
80
40
0
-40
STT STT
(M–L) in the classical surround (Shapley and Hawken, 2011).
The receptive ields of cells in V1 seem to be
different from those in the LGN. Most cells in V1 respond to achromatic contours and contrasts and to movement and orientation and are relatively insensitive to changes in color. However, there seems to be a higher concentration of color selective cells in the so-called “blobs” that make the center of orientation selective columns in V1. In agreement with Livingston and
Hubel’s early indings (1984), these blob cells project
to the thin stripes in area V2 (Sincich et al., 2007). The color selective cells of V1 have many preferred hue directions compared to the few cardinal directions of the six cell types in the LGN (Wachtler et al., 2003; Solomon and Lennie, 2007; Conway, 2009; Valberg et al., 1986).
This is not easily explained if cortical receptive ields
are constructed by convergence from the LGN.
A few studies claim to have proven correspondence between, for example, the sequence of hues in a color circle and a spatial organization of what appears to be
color-speciic neurons in the thin stripes of area V2
(Xiao et al., 2003). Zemir Zeki (1983) claimed that area V4 is specialized for color perception, whereas
newer investigations ind color-speciic cells in an
area somewhat larger than V4. Here the color-sensitive cells are arranged in “globs”, i.e., in areas with a high
density of color-speciic cells that can be viewed using
cytochrome oxidase marking, in analogy to the
color-speciic cells in the blobs of V1 (Conway, 2009).
These glob cells seem to project further on to the inferotemporal cortex (IT), and this area is regarded by some as pivotal in the development of perceived color categories (Komatsu, 1997; see also Gegenfurtner and Kiper, 2003).
Conclusion
Color matches, color thresholds, and the laws of additive color mixture are empirical facts that can be satisfactorily summarized by the three-receptor hypothesis. Together with chromatic adaptation, these relations belong to G. S. Brindley’s class A experiments (Brindley, 1960). Class A experiments deal with the identity or non-identity of two sense impressions and, in our case, the physical and physiological conditions that give rise to the same color.
Beyond color matching, we need to deal with color appearance including the ordering and scaling of colors within different categories and in color systems (Hering’s approach). Attributes like hue, saturation, and lightness/brightness, chromatic strength, white and black, are the properties of color that are in focus here as well as scaling of these attributes in color systems (e.g., Ostwald, Natural Colour System NCS, Munsell, etc.). Scaling belongs to Brindley’s class B experiments as does the search for correlations between phenomenological properties of light and color and neural processes.
In our investigation of neural correlates to color perception, i.e., of the relationship between brain activity and the uniqueness of qualia (e.g., unique hues, the redness of red, etc.), we have replaced perceptive qualities by symbols in a mathematical language. In doing so, we attempt to bridge class A and class B experiments in a unifying, quantitative model. More directly, we attempt to bridge the gap between matching in the three-receptor theory and perception in the opponent colors theory (see also Valberg, 2013).
References
Brindley, G. S. (1960). Physiology of the retina and the visual pathway. London: Edward Arnold.
Conway, B.R. (2009). Color vision, cones, and color-coding in the cortex. The Neuroscientist, 15, 274-290.
Dacey, M. D. & Lee B. B. (1994). The blue-ON opponent pathway in
primate retina originates from a distinct bistratiied ganglion cell
type. Nature, 367, 731-735.
Dacey, M. D. & Packer, O. S. (2003). Color coding in the primate
retina: Diverse cell types and cone-speciic circuitry. Current Opinion in Neurobiology, 13, 421-427.
De Valois, R. (1965). Analysis and coding of color vision in the primate visual system. Cold Spring Harbour Symposia on Quantitative Biology, 30, 567-579.
Gegenfurtner, K. R. & Kiper, D. C. (2003). Color Vision. Annual Review of Neuroscience, 26, 181-206.
Hering, E. (1920). Grundzüge der Lehre vom Lichtsinn. Berlin: Springer.
Hill, A. V. (1910). The possible effect of the aggregation of the molecules of haemoglobin on its dissocation curves. Journal of Physiology, 40 (Suppl) iv-vii.
Hsien-Che Lee (2005). Introduction to color imaging science. Cambridge: Cambridge University Press.
Hofer, H., Singer, B. & Williams, D. R. (2005). Different sensations from cones with the same photopigment. Journal of Vision, 5, 444-454. Kaplan, E., & Shapley, R. (1982). X and Y cells in the lateral
geniculate nucleus of the macaque monkey. Journal of Physiology, 330, 125 -143.
Komatsu, H. (1997). Neural representation of color in the inferior temporal cortex of the macaque monkey. In: The associative cortex–Structure and function (ed. H. Sakata, A. Mikami, J. Fuster) Amsterdam: Harwood Acad.
Lee, B. B., Valberg, A., Tigwell D. A. & Tryti, J. (1987). An account of responses of spectrally opponent neurones in macaque lateral geniculate nucleus to successive contrast. Proceedings of the Royal Society of London, Series B, 230, 293-314.
Lee, B. B., Martin, P. R. & Valberg, A. (1988). The physiological basis
of heterochromatic licker photometry demonstrated in the ganglion
cells of the macaque retina. Journal of Physiology, 404, 323-347. Lee, B. B., Pokorny, J., Smith, V. C., Martin, P. R. & Valberg, A.
(1990). Luminance and chromatic modulation sensitivity of macaque ganglion cells and human observers. Journal of the Optical Society of America, 7, 2223-2236.
Martin, P. R., White, A. J. R., Goodchild A. K., Wilder, H. D. & Sefton, A. E. (1997). Evidence that the blue-on cells are part of the third geniculocortical pathway in primates. European Journal of Neuroscience, 9, 1536-1541.
Müller, G. E. (1930). Ueber die Farbempindungen. Psychophysische Untersuchungen. Leipzig: Barth.
Schrödinger, E. (1925). Ueber das Verhältnis der Vierfarbenzur Dreifarbentheorie. Sitzungsberichte der Akademie der Wissenschaften, Wien IIa (134), 471-490.
Seim, T. O., Valberg, A. & Lee, B. B. (2011). Can power functionsnot DoGsdescribe receptive ields of cone-opponent cells? Meeting of International Colour Vision Society (ICVS), Buskerud College, Kongsberg, Norway. Abstract book p. 79.
Seim, T. O., & Valberg, A. (2013). Spatial sensitivity, responsivity, and surround suppression of LGN cell responses in the macaque. Visual Neuroscience, 30, 153-167.
Shapley, R. & Hawken, M. J. (2011). Color in the cortex: Single and double-opponent cells. Vision Research, 51, 701- 717.
Sincich, L. C., Jocson, C. M. & Horton, J. C. (2007). Neurons in V1 patch columns project to V2 thin stripes. Cerebral Cortex, 17, 935-941.
Smith, V. C., Lee, B. B., Pokorny, J. Martin, P. R. & Valberg, A. (1992). Responses of macaque ganglion cells to the relative phase of heterochromatically modulated lights. Journal of Physiology, 458, 191-221.
Solomon, S. G. & Lennie, P. (2007). The machinery of colour vision. National Review in Neuroscience, 8, 276-286.
Spillmann, L. (1971). Foveal receptive ields in the human visual
system measured with simultaneous contrast in grids and bars.
Plügers Archiv für die gesamte Physiologie, 326, 281-299.
Stockman, A & Sharpe, L. T. (2000). The spectral sensitivities of the middle- and long-wavelength sensitive cones derived from measurements in observers of known genotype. Vision Research, 40, 1711-1737.
Tailby, C., Solomon, S. G. & Lennie, P. (2008). Functional asymmetries in visual pathways carrying S-cone signals in macaque, Journal of Neuroscience, 28, 4078-4087.
Valeton, J.M. & Van Norren, D. (1983). Light adaptation of primate cones: an analysis based on extracellular data. Vision Research, 23, 1539-1547.
Valberg, A., Seim, T., Lee, B. B. & Tryti, J. (1986a). Reconstruction of equidistant color space from responses of visual neurons of macaques. Journal of the Optical Society of America, A3, 1726-1734.
Valberg, A., Lee, B. B. & Tigwell, D. A. (1986b). Neurones with strong inhibitory S-cone inputs in the macaque lateral geniculate nucleus. Vision Research, 26, 1061-1064.
Valberg, A., Seim, T.,.Lee, B. B. & Tryti, J. (1987). Simulation of responses of spectrally-opponent neurones in the macaque lateral
geniculate nucleus to chromatic and achromatic light stimuli. Vision Research, 27, 867-882.
Valberg, A. & Lee, B. B. (1989). Detection and discrimination of colour, a comparison of physiological and psychophysical data. Physica Scripta, 39, 178-186.
Valberg, A, Lange-Malecki, B. & Seim, T. (1991). Colour changes as a function of luminance contrast. Perception, 20, 655-668.
Valberg, A., Lee, B. B., Kaiser, P. K. & Kremers, J. (1992). Responses of macaque ganglion cells to movement of chromatic borders. Journal of Physiology, 458, 579-602.
Valberg, A. (2001). Unique hues: An old problem for a new generation. Vision Research,41, 1645-1657.
Valberg, A. (2005). Light vision color. Chichester: Wiley & Sons. Valberg, A. & Seim, T. (2008). Neural mechanisms of chromatic
and achromatic vision. Color Research & Application, 33, 433-443.
Valberg, A. (2009). Colour vision: Different roads from perception to neuroscience. Dean B. Judd lecture. Proceedings of the Association Internationale de la Colour (AIC), Sydney, Australia.
Valberg, A. (2013). In search for neurophysiological correlates to color vision. New York: Taylor and Francis. Festschrift devoted to Lothar Spillmann (in press).
Wachtler, T., Sejnowski, T. J. & Albright, T. D. (2003). Representation of color stimuli in awake macaque primary visual cortex. Neuron, 37, 681-691.
Wiesel, T. N. & Hubel, D. H. (1966). Spatial and chromatic interactions in the lateral geniculate body of the rhesus monkey. Journal of Neuroscience,29, 1115-1156.
Xiao, Y. Wang, Y. I. & Fellman, D. J. (2003). A spatially organized representation of colour in macaque cortical area V2. Nature, 42, 535-539.