Changing Patterns of Disease and Mortality
at the Children
’
s Hospital, Accra: Are
Infections Rising?
Edem M. A. Tette1,2*, Margaret Neizer2☯, Maame Yaa Nyarko2☯, Eric K. Sifah2☯, Edmund
T. Nartey3,4☯, Eric S. Donkor5
1Department of Community Health, School of Public Health, University of Ghana, Legon, Ghana,
2Princess Marie Louis Children’s Hospital, Accra, Ghana,3Centre for Tropical Clinical Pharmacology and Therapeutics, School of Medicine and Dentistry, University of Ghana, Legon, Ghana,4Department of Epidemiology and Disease Control, School of Public Health, University of Ghana, Legon, Ghana, 5Department of Medical Microbiology, College of Health Sciences, University of Ghana, Legon, Ghana
☯These authors contributed equally to this work. *[email protected]
Abstract
Background
The Millennium Development Goals (MDGs) have led to reductions in child mortality world-wide. This has, invariably, led to the changes in the epidemiology of diseases associated with child mortality. Although facility based data do not capture all deaths, they provide an opportunity to confirm diagnoses and insight into these changes which are relevant for fur-ther disease control.
Objective
To identify changes in the disease pattern of children who died at the Princess Marie Louise Children’s Hospital (PML) in Ghana from 2003–2013.
Methods
A cross sectional review of mortality data was carried out at PML. The age, sex, duration of admission and diagnosis of consecutive patients who died at the hospital between 2003 and 2013 were reviewed. This information was entered into an Access database and ana-lysed using Stata 11.0 software.
Results
Altogether, 1314 deaths (3.6%) occurred out of a total of 37,012 admissions. The majority of the deaths, 1187 (90.3%), occurred in children under the age of 5 years. While deaths caused by malaria, malnutrition, HIV infection and diarrhoea decreased, deaths caused by pneumonia were rising. Suspected septicaemia and meningitis showed a fluctuating trend with only a modest decrease between 2012 and 2013. The ten leading causes of mortality among under-fives were malnutrition, 363 (30.6%); septicaemia, 301 (25.4%); pneumonia, 218 (18.4%); HIV infection, 183 (15.4%); malaria, 155 (13.1%); anaemia, 135 (11.4%);
OPEN ACCESS
Citation:Tette EMA, Neizer M, Nyarko MY, Sifah EK, Nartey ET, Donkor ES (2016) Changing Patterns of Disease and Mortality at the Children’s Hospital, Accra: Are Infections Rising? PLoS ONE 11(4): e0150387. doi:10.1371/journal.pone.0150387
Editor:Ana Paula Arez, Instituto de Higiene e Medicina Tropical, PORTUGAL
Received:September 9, 2015
Accepted:February 12, 2016
Published:April 5, 2016
Copyright:© 2016 Tette et al. This is an open access article distributed under the terms of the Creative Commons Attribution License, which permits unrestricted use, distribution, and reproduction in any medium, provided the original author and source are credited.
gastroenteritis/dehydration, 110 (9.3%); meningitis, 58 (4.9%); tuberculosis, 34 (2.9%) and hypoglycaemia, 27 (2.3%). For children aged 5–9 years, the leading causes of mortality were malaria, 42 (42.9%); HIV infection, 27 (27.6%); anaemia, 14 (14.3%); septicaemia, 12 (12.2%); meningitis, 10 (10.2%); malnutrition, 9 (9.2%); tuberculosis, 5 (5.1%); pneumonia, 4 (4.1%); encephalopathy, 3 (3.1%); typhoid fever, 3 (3.1%) and lymphoma, 3 (3.1%). In the adolescent age group, malaria, 8 (27.6%); anaemia, 6 (20.7%); HIV infection, 5 (17.2%); sickle cell disease, 3 (10.3%) and meningitis, 3 (10.3%) were most common.
Conclusion
There has been a decline in the under-five mortality at PML over the years; however, deaths caused by pneumonia appear to be rising. This highlights the need for better diagnostic ser-vices, wider HIV screening and clinical audits to improve outcomes in order to achieve fur-ther reductions in child mortality and maintain the gains.
Introduction
The Millennium Development Goals have succeeded in reducing child mortality by almost half globally [1]. This has led to changes in the patterns of diseases which cause mortality in under-fives [2]. According to the Ghana Demographic and Health Survey, 2008, the major causes of child mortality in Ghana were neonatal disorders (27%), malaria (25%), pneumonia (20%), diarrhoeal diseases (17%), HIV/AIDS (8%) and measles (3%) [3]. However, by 2012, the major causes of child mortality in Ghana had changed to neonatal disorders (40%), malaria (19%), pneumonia (11%), diarrhoeal diseases (7%), HIV/AIDS (1%), injuries 4%, measles (1%) and others (17%) [1]. It is not clear how the pattern of disease and mortality has changed in school-aged children and adolescents.
Child mortality from Korle Bu Teaching Hospital, the country’s premier hospital, using data from the 1980s, showed that overall, neonatal deaths accounted for almost half (49.2%) of the total deaths with prematurity being the leading cause and accounting for 21% of the deaths [4]. This was followed by protein energy malnutrition (6.9%) and gastroenteritis (6.5%). Cere-bral malaria was the seventh most common cause of death accounting for 5.4%. Unfortunately, although hospital-based studies provide a means of capturing these changes, published studies on current data from Ghana and other developing countries are largely unavailable.
We examined the causes of deaths in children admitted to the Princess Marie Louise Chil-dren’s Hospital over an 11 year period from 2003–2013 to determine changing trends and their implications for further disease control.
Materials and Methods
Ethical clearance
We obtained ethical clearance from the Ghana Health Service Ethical Review Committee (ID NO: GHS-ERC: 05/07/12). We could not obtain consent from the patient’s caregivers. How-ever, patient information was anonymized and de-identified prior to the analysis.
Study area
Princess Marie Louise Children’s Hospital (PML) was the site for the study. It is a 74 bed hospi-tal and the second largest paediatric facility in Accra, located at the commercial centre of the
Funding:The study was supported by Building Stronger Universities Initiative Platform on Human Health (BSU-PHH). BSU-PHH had no role in the design, analysis or writing of this article
capital city. It has the largest Nutritional Rehabilitation Unit in the country. Princess Marie Louise Children’s Hospital provides both primary and secondary care for paediatric patients under the age of 18 years, in accordance with the definition of a child in the Children’s ACT Ghana, 1998 [5]. Thus, parents can bring their children to the hospital with or without a refer-ral at any time. Paediatric referrefer-rals are received from health centres, private clinics, government polyclinics and hospitals located in and around Accra including Korle Bu Teaching Hospital. The latter is the largest tertiary referral unit in Ghana and it is 15–30 minutes’drive in normal traffic from PML. A small proportion of patients are referred to PML from outside Accra.
Mortality meetings are held regularly at PML to audit the deaths that occur at the hospital. Mortality data collected at the time are recorded and stored at the Records Department. X-ray services are available from 8am to 2pm daily. Full blood counts, blood film for malaria para-sites, sickling test, G6PD test, Hb Electrophoresis, urinalysis and stool examination are among the tests done by the laboratory on site. Rapid diagnostic tests for malaria parasites became reg-ularly available in 2013. There are no facilities for bacterial cultures and antibiotic susceptibility testing. Requests for these are normally sent to the Korle Bu Teaching Hospital or private labo-ratories in Accra.
Study design
This was a retrospective review of consecutive deaths occurring in children aged 0–17 years admitted to the Princess Marie Louise Hospital from 1stJanuary, 2003 to 31stDecember, 2013. This study was part of a broader child mortality study, which examined general trends in mor-tality, place of residence and mormor-tality, and compared under-five deaths and discharges in 2011. These are being presented elsewhere. We report here only the top ten causes of death in these children.
Study population
We included all patients under the age of 18 who died at the hospital from 1stJanuary, 2003 to 31stDecember, 2013. They were further categorized into<5 years, 5–9 years and 10–17 years.
The total admissions for each year were also obtained.
Data collection methods and instruments
Children who die at the hospital are first discussed at weekly and monthly mortality meetings. A paediatrician then fills in the death certificate and a data sheet for the data management unit of the hospital which include the clinical diagnosis at the time of death and some selected infor-mation. This is based on the cause of death agreed at the mortality meetings and it is usually supported by preliminary laboratory tests that have been done or the results of any other inves-tigations to confirm the diagnosis. This process became operational at PML in 2009. Thus, the causes of death presented from then are based on consensus from the mortality meetings.
Prior to this, the mortality meetings were held monthly and involved only medical staff. Collection of mortality data was driven by data management personnel of the Records Depart-ment, with less co-ordination between them and the paediatricians. The list of children who died was compiled by these data management personnel using information obtained from admissions, death/discharge books and death certificates. This list together with the case notes was then given to a doctor to confirm the diagnosis.
the top 10 diseases. Selected information is collected on each in-patient including causes of admission and death with some International Statistical Classification of Diseases and Related Health Problems-10th Revision (ICD 10) coded diagnosis from the DHIS 2 Tracker. The data presented here includes, mostly data from the manually collated data master sheets held by the data management unit of PML and some print-outs from the DHIMS.
Standard case definitions from the World Health organisation (WHO) are routinely used for the diagnosis of diarrhoea, pneumonia, malaria, anaemia and malnutrition [7,8]. In addi-tion to this, case definiaddi-tions for cholera and measles are provided by the Ghana Health Service when there is an outbreak and are based on WHO Integrated Disease Surveillance and Response Guidelines [9]. The rest comes from the physician’s clinical practice.
We obtained the records of all deaths occurring from 2003 to 2013 from the Records Department of the hospital and entered them into a computerised record form. This was done by trained data management personnel who were recruited by the investigators to enter infor-mation on the printouts and data sheets. We did not go back to review the case notes of the patients. The information collected included data on the age, sex, cause of death, duration of admission, status of registration with the National Health Insurance Scheme and place of resi-dence. The total admissions for each year were obtained to enable the deaths to be expressed as a percentage of the admissions.
All causes of death were recorded. Some patients had multiple diagnoses and each of these diagnoses was reported separately. This was done in order to provide a better impression of the burden of disease as some of these patients were treated for different diseases and billed for their treatments. In addition, since this was a retrospective study, we felt that this was the best way to capture the disease burden as mentioned by other researchers studying child mortality from the developing world [10].
Data analysis
The data was summarized using Microsoft Access (Microsoft Corporation, Edmond, Washing-ton) and analyzed using Stata SE 11.0 (Stata Corporation, College Station, Texas). We deter-mined the frequencies and proportion of the top ten diseases and presented them in tables according to the following age groups: 0–4 years (under-fives), 5–9 years and 10–17 years. Mortality ratios were calculated using data on the number of deaths per 1000 age-specific admissions. Each disease category was also presented as a percentage of total deaths.
Results
Out of a total of 37,012 admissions within the period of this study, 1,314 deaths occurred, giv-ing a death rate of 3.6% of total admissions (range 2.6% to 6.3%). This does not include data on child deaths that occurred in June 2003, February 2007 and March 2007 as they could not be found. The ages ranged between 1 day and 15 years and 52.2% (686) of the children who died were males. Under-fives formed 90.3%, (1187) of the children who died, while children aged five years and above formed 9.7% (127). Ninety-eight deaths occurred within the first month of life and they formed 7.5% of the under-five mortality.
Altogether, 676 (51.4%) of the children had one cause of death, while 435 (33.1%) had two causes of death and 203 (15.5%) children had three or more causes of death.
Table 1. Proportionate distribution (per 1000 admissions) of ten leading causes of death in patients under 5 years attending PML hospital in Accra, Ghana, 2003–2013.
Total 2003b 2004 2005 2006 2007c 2008 2009 2010 2011 2012 2013
Cause of deatha N = 32784 N = 1450 N = 1768 N = 1749 N = 1951 N = 2272 N = 2796 N = 3386 N = 3936 N = 4677 N = 4621 N = 4178
n, p n, p n, p n, p n, p n, p n, p n, p n, p n, p n, p n, p Malnutrition 363 (11.1) 47 (32.4) 48 (27.1) 31 (17.7) 20 (10.3) 16 (7.0) 20 (7.2) 32 (9.5) 40 (10.2) 40 (8.6) 40 (8.7) 29 (6.9) Septicaemia 301 (9.2) 2 (1.4) 19 (10.7) 9 (5.1) 4 (2.1) 9 (4.0) 25 (8.9) 39 (11.5) 53 (13.5) 50 (10.7) 55 (11.9) 36 (8.6) Pneumonia 218 (6.6) 5 (3.4) 17 (9.6) 5 (2.9) 7 (3.6) 14 (6.2) 13 (4.6) 23 (6.8) 37 (9.4) 37 (7.9) 26 (5.6) 34 (8.1) HIV (Positive/
Exposed)
183 (5.6) 9 (6.2) 14 (7.9) 18 (10.3) 18 (9.2) 30 (13.2) 24 (8.6) 12 (3.5) 20 (5.1) 15 (3.2) 9 (1.9) 14 (3.4)
Malaria 155 (4.7) 18 (12.4) 5 (2.8) 3 (1.7) 2 (1.0) 11 (4.8) 22 (7.9) 27 (8.0) 26 (6.6) 15 (3.2) 17 (3.7) 9 (2.2) Anaemia 135 (4.1) 10 (6.9) 6 (3.4) 4 (2.3) 1 (0.5) 9 (4.0) 15 (5.4) 15 (4.4) 25 (6.4) 16 (3.4) 20 (4.3) 14 (3.4) Gastroenteritis
with/without dehydration
110 (3.4) 5 (3.4) 10 (5.7) 6 (3.4) - 6 (2.6) 8 (2.9) 13 (3.8) 12 (3.0) 18 (3.8) 20 (4.3) 12 (2.9)
Meningitis 58 (1.8) 1 (0.7) 4 (2.3) 1 (0.6) - 1 (0.4) 5 (1.8) 4 (1.2) 14 (3.6) 12 (2.6) 10 (2.2) 6 (1.4) Tuberculosis 34 (1.0) - 3 (1.7) 3 (1.7) 1 (0.5) - 5 (1.8) 3 (0.9) 4 (1.0) 8 (1.7) 5 (1.1) 2 (0.5)
Hypoglycaemia 27 (0.8) - - - 6 (1.5) 6 (1.3) 9 (1.9) 6 (1.4)
a
Cause of death may be multiple in some cases b
Data on patients who died in June 2003 missing c
Data on patients who died in February and March 2007 missing; N = Total number of admissions in each year; n = number of deaths; p = proportionate death per 1000 year-specific admissions
doi:10.1371/journal.pone.0150387.t001
Table 2. Percentage distribution of ten leading causes of death in patients under 5 years attending PML hospital in Accra, Ghana, 2003–2013.
Total 2003b 2004 2005 2006 2007c 2008 2009 2010 2011 2012 2013
Cause of deatha N = 1187 N = 95 N = 112 N = 72 N = 55 N = 94 N = 119 N = 119 N = 137 N = 130 N = 141 N = 113
n, % n, % n, % n, % n, % n, % n, % n, % n, % n, % n, % n, %
Malnutrition 363 (30.6) 47 (49.5) 48 (42.9) 31 (43.1) 20 (36.4) 16 (17.0) 20 (16.8) 32 (26.9) 40 (29.2) 40 (30.8) 40 (28.4) 29 (25.7) Septicaemia 301 (25.4)
2 (2.1) 19 (17.0)
9 (12.5)
4 (7.3) 9 (9.6) 25 (21.0) 39 (32.8) 53 (38.7) 50 (38.5) 55 (39.0) 36 (31.9) Pneumonia 218 (18.4)
5 (5.3) 17 (15.2)
5 (6.9) 7
(12.7) 14 (14.9) 13 (10.9) 23 (19.3) 37 (27.0) 37 (28.5) 26 (18.4) 34 (30.1) HIV (Positive/Exposed) 183
(15.4)
9 (9.5) 14 (12.5) 18 (25.0) 18 (32.7) 30 (31.9) 24 (20.2) 12 (10.1) 20 (14.6) 15 (11.5)
9 (6.4) 14 (12.4)
Malaria 155
(13.1)
18 (18.9)
5 (4.5) 3 (4.2) 2 (3.6) 11 (11.7) 22 (18.5) 27 (22.7) 26 (19.0) 15 (11.5) 17 (12.1) 9 (8.0) Anaemia 135 (11.4) 10 (10.5)
6 (5.4) 4 (5.6) 1 (1.8) 9 (9.6) 15 (12.6) 15 (12.6) 25 (18.2) 16 (123.3) 20 (14.2) 14 (12.4) Gastroenteritis with/ without dehydration
110 (9.3) 5 (5.3) 10 (8.9) 6 (8.3) - 6 (6.4) 8 (6.7) 13 (10.9)
12 (8.8) 18 (13.8)
20 (14.2)
12 (10.6) Meningitis 58 (4.9) 1 (1.1) 4 (3.6) 1 (1.4) - 1 (1.1) 5 (4.2) 4 (3.4) 14
(10.2)
12 (9.2) 10 (7.1) 6 (5.3)
Tuberculosis 34 (2.9) - 3 (2.7) 3 (4.2) 1 (1.8) - 5 (4.2) 3 (2.5) 4 (2.9) 8 (6.2) 5 (3.5) 2 (1.8)
Hypoglycaemia 27 (2.3) - - - 6 (4.4) 6 (4.6) 9 (6.4) 6 (5.3)
aCause of death may be multiple in some cases, hence %s may add up to>100 bData on patients who died in June 2003 missing
cData on patients who died in February and March 2007 missing; N = Total number of deaths in each year; n = number of deaths
and HIV infection. The proportion of children under-five years who died from pneumonia increased during the review period. However, the proportion of under-fives who died from septi-caemia and meningitis fluctuated during the review period. The ten leading causes of mortality in children under the age of 5 years were malnutrition (30.6%), septicaemia (25.4%), pneumonia
Table 3. Proportionate distribution (per 1000 admissions) of ten leading causes of death in patients aged 5–9 years attending PML hospital in
Accra, Ghana, 2003–2013.
Total 2003b 2004 2005 2006 2007c 2008 2009 2010 2011 2012 2013
Cause of deatha N = 3337 N = 103 N = 164 N = 149 N = 168 N = 242 N = 357 N = 336 N = 468 N = 486 N = 441 N = 423
n, p n, p n, p n, p n, p n, p n, p n, p n, p n, p n, p n, p
Malaria 42 (12.6) 2 (19.4) - - 2 (11.9) 3 (12.4) 9 (25.2) 5 (14.9) 8 (17.1) 4 (8.2) 7 (15.9) 2 (4.7) HIV (Positive/Exposed) 27 (8.1) - 2 (12.2) 3 (20.1) - 1 (4.1) 4 (11.2) 5 (14.9) 5 (10.7) 1 (2.1) 3 (6.8) 3 (7.1)
Anaemia 14 (4.2) - - - 1 (6.0) 2 (8.3) 2 (5.6) 3 (8.9) 2 (4.3) 1 (2.1) 2 (4.5) 1 (2.4)
Septicaemia 12 (3.6) - - - 1 (2.8) 1 (3.0) 3 (6.4) 2 (4.1) 4 (9.1) 1 (2.4)
Meningitis 10 (3.0) - 1 (6.1) - - - 1 (2.8) 1 (3.0) 6 (12.8) 1 (2.1) -
-Malnutrition 9 (2.7) 1 (9.7) 1 (6.1) 1 (6.7) - - 1 (2.8) 1 (3.0) 1 (2.1) - - 3 (7.1)
Tuberculosis 5 (1.5) - 1 (6.1) - - - - 1 (3.0) 2 (4.3) - - 1 (2.4)
Pneumonia 4 (1.2) - - - 1 (6.0) - - 1 (3.0) - 1 (2.1) 1 (2.3)
-Encephalopathy 3 (0.9) - - - 1 (3.0) - - 2 (4.5)
-Typhoid fever 3 (0.9) - - - - 1 (4.1) - 1 (3.0) - 1 (2.1) -
-Lymphoma 3 (0.9) - 1 (6.1) - 1 (6.0) - 1 (2.8) - - - -
-a
Cause of death may be multiple in some cases b
Data on patients who died in June 2003 missing c
Data on patients who died in February and March 2007 missing; N = Total number of admissions in each year; n = number of deaths; p = proportionate death per 1000 year-specific admissions
doi:10.1371/journal.pone.0150387.t003
Table 4. Percentage distribution of ten leading causes of death in patients aged 5–9 years attending PML hospital in Accra, Ghana, 2003–2013.
Total 2003b 2004 2005 2006 2007c 2008 2009 2010 2011 2012 2013
Cause of deatha N = 98 N = 3 N = 7 N = 4 N = 5 N = 6 N = 16 N = 13 N = 14 N = 6 N = 14 N = 10
n, % n, % n, % n, % n, % n, % n, % n, % n, % n, % n, % n, %
Malaria 42 (42.9) 2 (66.7) - - 2 (40.0) 3 (50.0) 9 (56.3) 5 (38.5) 8 (57.1) 4 (66.7) 7 (50.0) 2 (20.0) HIV (Positive/Exposed) 27 (27.6) - 2 (28.6) 3 (75.0) - 1 (16.7) 4 (25.0) 5 (38.5) 5 (35.7) 1 (16.7) 3 (21.4) 3 (30.0) Anaemia 14 (14.3) - - - 1 (20.0) 2 (33.3) 2 (12.5) 3 (23.1) 2 (14.3) 1 (16.7) 2 (14.3) 1 (10.0)
Septicaemia 12 (12.2) - - - 1 (6.3) 1 (7.7) 3 (21.4) 2 (33.3) 4 (28.6) 1 (10.0)
Meningitis 10 (10.2) - 1 (14.3) - - - 1 (6.3) 1 (7.7) 6 (42.9) 1 (16.7) -
-Malnutrition 9 (9.2) 1 (33.3) 1 (14.3) 1 (25.0) - - 1 (6.3) 1 (7.7) 1 (7.1) - - 3 (30.0)
Tuberculosis 5 (5.1) - 1 (14.3) - - - - 1 (7.7) 2 (14.3) - - 1 (10.0)
Pneumonia 4 (4.1) - - - 1 (20.0) - - 1 (7.7) - 1 (16.7) 1 (7.1)
-Encephalopathy 3 (3.1) - - - 1 (7.7) - - 2 (14.3)
-Typhoid fever 3 (3.1) - - - - 1 (16.7) - 1 (7.7) - 1 (16.7) -
-Lymphoma 3 (3.1) - 1 (14.3) - 1 (20.0) - 1 (6.3) - - - -
-a
Cause of death may be multiple in some cases, hence %s may add up to>100
b
Data on patients who died in June 2003 missing c
Data on patients who died in February and March 2007 missing; N = Total number of deaths in each year; n = number of deaths
(18.4%), HIV Infection (15.4%), malaria (13.1%), anaemia (11.4%), gastroenteritis/dehydration (9.3%), meningitis (4.9%), tuberculosis (2.9%) and hypoglycaemia (2.3%) (Table 2).
Table 3shows the proportionate distribution (per 1000 admissions) of ten leading causes of death in patients aged 5–9 years whereasTable 4shows the percentage distribution of ten lead-ing causes of death in patients aged 5–9 years.Table 3indicates a drop in malaria mortality from 19.4 deaths per 1000 total admissions in 2003 to 4.7 deaths per 1000 total admissions in 2013. In 2013 only confirmed malaria cases were reported whereas in the previous years, data on suspected and confirmed cases were not separated. The top ten causes of death in children aged 5–9 years were malaria 42 (42.9%), HIV 27 (27.6%), anaemia 14 (14.3%), septicaemia 12 (12.2%), meningitis 10 (10.2%), malnutrition 9 (9.2%), tuberculosis 5 (5.1%), pneumonia 4 (4.1%), encephalopathy 3 (3.1%), typhoid fever 3 (3.1%) and three (3) cases of lymphoma (3.1%) (Table 4).
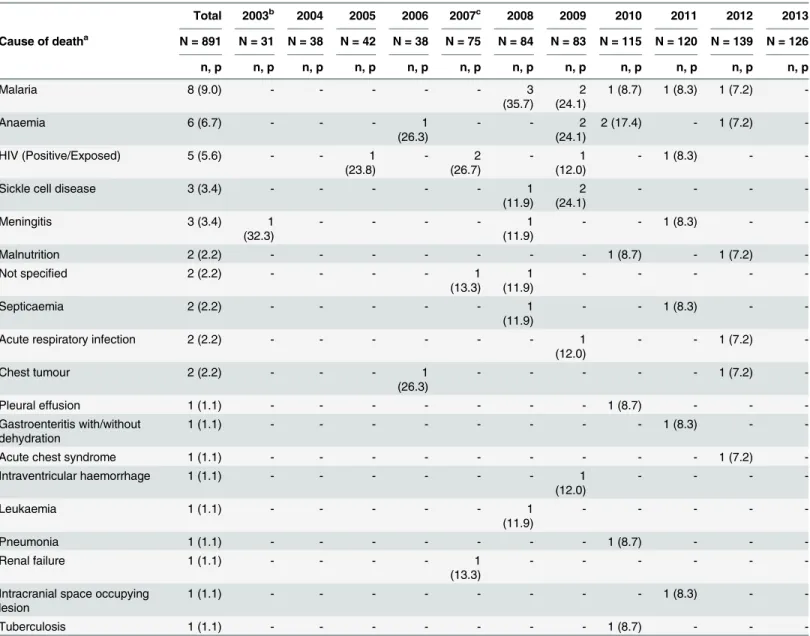
Table 5shows the proportionate distribution (per 1000 admissions) of all the causes of death in patients aged 10–17 years whereasTable 6shows the percentage distribution of all the causes of death in patients aged 10–17 years. There were no deaths recorded in this age cate-gory in 2013. Malaria was the leading cause of death accounting for 9 deaths per 1000 admis-sions (Table 5) which is 27.6% of all deaths recorded for the 10–17 year olds during the study period (Table 6). The other causes of death in the adolescent age group were anaemia, 6 (20.7%); HIV 5 (17.2%), sickle cell disease, 3 (10.3%) and meningitis, 3 (10.3%) (Table 6). There were two cases of malnutrition (6.9%) and two patients with unspecified diagnosis (6.9%) (Table 6). For the age group 10–17 years, we included all the causes of death because the number of deaths was small and not just the top ten leading causes of death.
Discussion
The leading causes of mortality in children under the age of five years in this study are similar to findings from mortality studies from Nigeria, Kenya, Mozambique and South Africa [11–
15]. It is also similar to studies on child deaths from Korle Bu Teaching Hospital (KBTH), Ghana in previous years [4,16]. What is different is the prominence of HIV, disappearance of measles as a major cause of death, the re-emergence of tuberculosis and reduction in typhoid fever deaths. The disappearance of measles as a major cause of disease attests to the effective-ness of the measles immunisation campaigns and efforts to meet the target for MDG 4 [17,18]. Neonatal deaths were not a prominent cause of the overall mortality unlike the national data and the study from KBTH which show a prominence of deaths from prematurity. This is mainly due to the service structure of the study hospital [4,16]. The Princess Marie Louise Chil-dren’s hospital is not attached to a maternity unit and it started a Special Care Babies Unit in 2009.
In this study, 127 deaths (9.7%) occurred in children aged five years and above. Nutritional disorders and Sickle cell disease were the main non-communicable diseases in adolescents. However, malaria, anaemia and HIV infection were the three most common diseases in the adolescent age group. This was also found in children aged 5–9 years but in addition septicae-mia, malnutrition, tuberculosis and pneumonia were common and there were only three cases of typhoid fever. The study at KBTH in the 1980’s found that the major causes of mortality in the age group 5–12 years were typhoid fever, sickle cell disease and Burkitt’s lymphoma [4]. It is important to note that at the time, KBTH was a regional centre for treating Burkitt’s lym-phoma. It is possible that currently, typhoid fever is being under-diagnosed, since the environ-mental conditions that foster the disease are still prevalent.
were an important cause of death too[19]. Our finding differs from this and it is probably because services for managing pregnancy-related complications and injuries at PML are lim-ited. HIV was, however, a prominent cause of death in adolescents in this study. The WHO reports that while there has been a reduction in HIV infection worldwide, the condition is increasing in adolescents [20]. Therefore, while the world’s focus is currently on reducing mor-tality in under-fives, care must be taken not to neglect the health needs of older children and young person’s but rather hospitals like PML must be encouraged to expand their adolescent health services to deal with health problems in this age group. In addition, since the hospital
Table 5. Proportionate distribution (per 1000 admissions) of causes of death in patients aged 10–17 years attending PML hospital in Accra,
Ghana, 2003–2013.
Total 2003b 2004 2005 2006 2007c 2008 2009 2010 2011 2012 2013
Cause of deatha N = 891 N = 31 N = 38 N = 42 N = 38 N = 75 N = 84 N = 83 N = 115 N = 120 N = 139 N = 126
n, p n, p n, p n, p n, p n, p n, p n, p n, p n, p n, p n, p
Malaria 8 (9.0) - - - 3
(35.7)
2 (24.1)
1 (8.7) 1 (8.3) 1 (7.2)
-Anaemia 6 (6.7) - - - 1
(26.3)
- - 2
(24.1)
2 (17.4) - 1 (7.2)
-HIV (Positive/Exposed) 5 (5.6) - - 1
(23.8)
- 2
(26.7)
- 1
(12.0)
- 1 (8.3) -
-Sickle cell disease 3 (3.4) - - - 1
(11.9)
2 (24.1)
- - -
-Meningitis 3 (3.4) 1
(32.3)
- - - - 1
(11.9)
- - 1 (8.3) -
-Malnutrition 2 (2.2) - - - 1 (8.7) - 1 (7.2)
-Not specified 2 (2.2) - - - - 1
(13.3)
1 (11.9)
- - - -
-Septicaemia 2 (2.2) - - - 1
(11.9)
- - 1 (8.3) -
-Acute respiratory infection 2 (2.2) - - - 1
(12.0)
- - 1 (7.2)
-Chest tumour 2 (2.2) - - - 1
(26.3)
- - - 1 (7.2)
-Pleural effusion 1 (1.1) - - - 1 (8.7) - -
-Gastroenteritis with/without dehydration
1 (1.1) - - - 1 (8.3) -
-Acute chest syndrome 1 (1.1) - - - 1 (7.2)
-Intraventricular haemorrhage 1 (1.1) - - - 1
(12.0)
- - -
-Leukaemia 1 (1.1) - - - 1
(11.9)
- - - -
-Pneumonia 1 (1.1) - - - 1 (8.7) - -
-Renal failure 1 (1.1) - - - - 1
(13.3)
- - -
-Intracranial space occupying lesion
1 (1.1) - - - 1 (8.3) -
-Tuberculosis 1 (1.1) - - - 1 (8.7) - -
-aCause of death may be multiple in some cases bData on patients who died in June 2003 missing
cData on patients who died in February and March 2007 missing; N = Total number of admissions in each year; n = number of deaths; p = proportionate death per 1000 year-specific admissions
runs a Sickle Cell Clinic, a more detailed audit of sickle cell deaths can help improve care and inform patient management at the clinic.
While malaria was the fifth major cause of deaths in the under-fives, it was the most com-mon cause of death acom-mong children aged 5 years and above. Malaria in this age group needs to be closely monitored because it is expected that this age group will be most vulnerable if there are lapses in malaria control [21]. This is because the preventive measures currently in place,
Table 6. Percentage distribution of causes of death in patients aged 10–17 years attending PML hospital in Accra, Ghana, 2003–2013.
Total 2003b 2004 2005 2006 2007c 2008 2009 2010 2011 2012 2013
Cause of deatha N = 29 N = 1 N = 0 N = 1 N = 2 N = 3 N = 7 N = 6 N = 3 N = 3 N = 3 N = 0
n, % n, % n, % n, % n, % n, % n, % n, % n, % n, % n, % n, %
Malaria 8
(27.6)
- - - 3
(42.9) 2 (33.3) 1 (33.3) 1 (33.3) 1 (33.3) -Anaemia 6 (20.7)
- - - 1
(50.0)
- - 2
(33.3) 2 (66.7) - 1 (33.3)
-HIV (Positive/Exposed) 5
(17.2)
- - 1
(100) - 2 (66.7) - 1 (16.7) - 1 (33.3) -
-Sickle cell disease 3
(10.3)
- - - 1
(14.3) 2 (33.3) - - - -Meningitis 3 (10.3) 1 (100)
- - - - 1
(14.3)
- - 1
(33.3)
-
-Malnutrition 2 (6.9) - - - 1
(33.3)
- 1
(33.3)
-Not specified 2 (6.9) - - - - 1
(33.3)
1 (14.3)
- - - -
-Septicaemia 2 (6.9) - - - 1
(14.3)
- - 1
(33.3)
-
-Acute respiratory infection 2 (6.9) - - - 1
(16.7)
- - 1
(33.3)
-Chest tumour 2 (6.9) - - - 1
(50.0)
- - - 1
(33.3)
-Pleural effusion 1 (3.4) - - - 1
(33.3)
- -
-Gastroenteritis with/without dehydration
1 (3.4) - - - 1
(33.3)
-
-Acute chest syndrome 1 (3.4) - - - 1
(33.3)
-Intraventricular haemorrhage 1 (3.4) - - - 1
(16.7)
- - -
-Leukaemia 1 (3.4) - - - 1
(14.3)
- - - -
-Pneumonia 1 (3.4) - - - 1
(33.3)
- -
-Renal failure 1 (3.4) - - - - 1
(13.3)
- - -
-Intracranial space occupying lesion 1 (3.4) - - - 1
(33.3)
-
-Tuberculosis 1 (3.4) - - - 1
(33.3)
- -
-aCause of death may be multiple in some cases, hence %s may add up to>100 bData on patients who died in June 2003 missing
cData on patients who died in February and March 2007 missing; N = Total number of deaths in each year; n = number of deaths
though effective, reduce exposure to the parasite in the early years which in turn reduces the immunity developed against the parasite. This becomes evident when the children are older. Thus data collection in hospital for surveillance purposes is essential.
The proportion of children dying from suspected septicaemia, pneumonia and meningitis rose during the period. The reason for this is unclear. It may well be that this is due to increased diagnosis as a result of a change in the labelling of unproven malaria or better recognition of the disease. The hospital also has the challenge of not being able to culture organisms on site and investigations for infection markers are largely unavailable. C-reactive protein is available from private laboratories but the cost is prohibitive for many patients. There have been studies to determine whether C-reactive protein and procalcitonin are effective biomarkers in the Afri-can region with mixed results particularly in malaria endemic regions [22,23].
The reliability of newer serological tests for the diagnosis of typhoid fever is more estab-lished but they are not available [24]. They may have improved the diagnosis of typhoid fever. Knowing the contribution of typhoid fever to mortality in this kind of setting is important because the disease can be prevented through vaccination programmes which have been estab-lished in some countries [25]. Therefore, strengthening laboratory services in the hospital will significantly improve the diagnosis of infections and determination of antimicrobial sensitivity. This is particularly relevant at this time when antimicrobial resistance and fake drugs are a matter of concern in Ghana.
It was also unclear whether the rise in these infections was due to the effect of undiagnosed HIV infection since the HIV status of all the children was not known. The 2013 HIV sentinel survey of pregnant women attending antenatal clinics at chosen sites within the country put the median HIV prevalence rate at 1.9% nation-wide and 2.7% in the Greater Accra Region [26]. However, the prevalence of HIV infection in hospital patients is often higher [27]. Testing all the children who will come to the hospital will be ideal as it will allow for early diagnosis of children with HIV infection. This will enable them to receive early treatment and prevent the disease from progressing. According to the hospitals protocol, all patients admitted to the ward with acute malnutrition should have HIV testing as well as a chest X-ray. This was started about 5 years ago. The study of children with Severe Acute Malnutrition (SAM) admitted to PML in 2010 found that 102 (75.6%) out of 135 children with SAM were tested for HIV and of those tested 21 (21%) had positive results for HIV infection [28]. The Ghana government is currently in the process of designing a programme to screen all children who attend health facilities for HIV infection.
Several population and hospital-based interventions ranging from immunisation pro-grammes to improvements in the health services have contributed to the reduction in mortality from these diseases [29–31]. Increasing paediatric presence, development and use of case man-agement protocols, training in the manman-agement of severe acute malnutrition and emergency triage may have also contributed to these changes [32]. However, additional effort should be put into preventing individual diseases and strengthening the health service to optimize care as other studies have shown [2,33–35].
Conclusions
There has been a decline in child mortality particularly from malaria, malnutrition and HIV in spite of a tripling of the admissions. However, the proportion of deaths from pneumonia in under-fives is rising. Deaths from diarrhoea, suspected septicaemia and meningitis have shown a fluctuating trend with only a modest decrease between 2012 and 2013 in spite of the intro-duction of pneumococcal and rotavirus vaccines. This stresses the need to strengthen the health system by providing better diagnostic services to aid the identification and proper man-agement of infections. It is also important to understand the determinants of diseases such as pneumonia in the paediatric population in Ghana. Furthermore, there is a need to audit case management, improve data collection and management and conduct further studies to assess the contribution of undiagnosed HIV infection in mortality particularly in adolescents and school age children.
Author Contributions
Conceived and designed the experiments: EMAT MN MYN EKS ETN. Performed the experi-ments: EMAT ETN. Analyzed the data: ETN EMAT. Contributed reagents/materials/analysis tools: EMAT ETN EKS ESD. Wrote the paper: EMAT MN MYN EKS ETN ESD.
References
1. Requejo J, Bryce J, Victora C, Deixel A, Wardlaw T, Dwivedi A, et al. (2013) Accountability for maternal, newborn and child survival: The 2013 Update. Countdown to 2015: Maternal, Newborn and Child Survival.
2. Bryce J, Victora CG, Black RE (2013) The unfinished agenda in child survival. Lancet 382: 1049–1059. doi:10.1016/S0140-6736(13)61753-5PMID:24054535
3. Gyamfi S, Peprah TP, Toboh L, Amedoe JA, Quansah-Asare GJ, Sepah E, et al. (2009 September) Ghana Demographic and Health Survey 2008. Calverton, Maryland, U.S.A.: Ghana Statistical Service & Ghana Health Service.
4. Commey JO (1991) Childhood Mortality at Korle Bu Teaching Hospital, Accra 1986–1987. Ghana Med-ical Journal 25: 334–341.
5. (1997) The Children’s Act. Ghana: GoG.
6. UiO DoI DHIS 2 pp. Health Information Systems Programme.
7. WHO (2000) Management of the child with a serious infection or severe malnutrition-Guidelines for care at the first-referral level in developing countries. Geneva: World Health organisation.
8. GHS (2010) Interim National Guidelines for Community-Based Management Of Severe Acute Malnutri-tion in Ghana. Accra: Ghana Health Service.
9. WHO, CDC (2010) Technical guideline for Integrated Disease Surveillance and Response in the Afri-can Region. Atlanta: World Health organisation, Centers for Disease Control and Prevention. 10. Krug A, Pattinson RC, Power DJ (2004) Saving children—an audit system to assess under-5 health
care. S Afr Med J 94: 198–202. PMID:15098280
11. Bamgboye EA, Familusi JB (1990) Mortality pattern at a children's emergency ward, University College Hospital, Ibadan, Nigeria. Afr J Med Med Sci 19: 127–132. PMID:2115728
12. Menge I, Esamai F, van Reken D, Anabwani G (1995) Paediatric morbidity and mortality at the Eldoret District Hospital, Kenya. East Afr Med J 72: 165–169. PMID:7796768
13. Julien M, Albuquerque O, Cliff J, Araujo A, Morais A (1995) Changing patterns in pediatric mortality, Maputo Central Hospital, Mozambique, 1980–1990. J Trop Pediatr 41: 366–368. PMID:8606447
14. Krug A, Pattinson RC, Power DJ (2004) Why children die: an under-5 health care survey in Mafikeng region. S Afr Med J 94: 202–206. PMID:15098281
15. Grandin W, Westwood T, Lagerdien K, King MS (2006) Deaths at Red Cross Children's Hospital, Cape Town 1999-2003—a study of death notification forms. S Afr Med J 96: 964–968. PMID:17077926
17. Black RE, Morris SS, Bryce J (2003) Where and why are 10 million children dying every year? Lancet 361: 2226–2234. PMID:12842379
18. Brown MM, [Foreworded] (2003) Indicators for Monitoring the Millennium Development Goals. New York: United Nations Development Group.
19. Ohene SA, Tettey Y, Kumoji R (2011) Cause of death among Ghanaian adolescents in Accra using autopsy data. BMC Res Notes 4: 353. doi:10.1186/1756-0500-4-353PMID:21910900
20. Bustreo F, [For WHO] (2014) WHO calls for stronger focus on adolescent health. Geneva Switzerland: World Health Organisation. 14th May 14th May.
21. Whitty CJM, Ansah EK (2013) Malaria. In: Mabey D, Gill G, Parry E, Webber MW, Whitty CJM, editors. Principles of Medicine in Africa. 4th ed. Cambridge: Cambridge University Press pp. 182–194. 22. Carrol ED, Mankhambo LA, Jeffers G, Parker D, Guiver M, Newland P, et al. (2009) The diagnostic and
prognostic accuracy of five markers of serious bacterial infection in Malawian children with signs of severe infection. PLoS One 4: e6621. doi:10.1371/journal.pone.0006621PMID:19675669
23. Diez-Padrisa N, Bassat Q, Machevo S, Quinto L, Morais L, Nhampossa T, et al. (2010) Procalcitonin and C-reactive protein for invasive bacterial pneumonia diagnosis among children in Mozambique, a malaria-endemic area. PLoS One 5: e13226. doi:10.1371/journal.pone.0013226PMID:20976241
24. Olsen SJ, Pruckler J, Bibb W, Nguyen TM, Tran MT, Sivapalasingam S, et al. (2004) Evaluation of rapid diagnostic tests for typhoid fever. J Clin Microbiol 42: 1885–1889. PMID:15131144
25. Maurice J (2012) A first step in bringing typhoid fever out of the closet. Lancet 379: 699–700. PMID:
22371964
26. Ghana National AIDS Control Programme (2011) HIV Sentinel Survey Report.
27. Rogerson SR, Gladstone M, Callaghan M, Erhart L, Rogerson SJ, Borgstein E, et al. (2004) HIV infec-tion among paediatric in-patients in Blantyre, Malawi. Trans R Soc Trop Med Hyg 98: 544–552. PMID:
15251404
28. Adjei END (2010) A study to determine the clinical features and outcome of severely Malnourished Chil-dren Admitted to Princess Marie Louise Hospital in Accra. A dissertation submitted to Community Health Department of the University of Ghana Medical School in partial fulfilment of the requirements for award of MBChB degree. University of Ghana Medical School: University of Ghana Medical School.
29. Campbell H, Duke T, Weber M, English M, Carai S, Tamburlini G (2008) Global initiatives for improving hospital care for children: state of the art and future prospects. Pediatrics 121: e984–992. doi:10.1542/ peds.2007-1395PMID:18381526
30. Bryce J, el Arifeen S, Pariyo G, Lanata C, Gwatkin D, Habicht JP (2003) Reducing child mortality: can public health deliver? Lancet 362: 159–164. PMID:12867119
31. Jackson AA, Ashworth A, Khanum S (2006) Improving child survival: Malnutrition Task Force and the paediatrician's responsibility. Arch Dis Child 91: 706–710. PMID:16861489
32. Tette EMA, Neizer M, Nyarko MY, Sifah EK, Sagoe-Moses IA, Nartey ET. Child Mortality Interventions & Trends at the Children’s Hospital, Accra, 2003–2013: Lessons learnt. Unpublished work.
33. Nolan T, Angos P, Cunha AJ, Muhe L, Qazi S, Simoes EA, et al. (2001) Quality of hospital care for seri-ously ill children in less-developed countries. Lancet 357: 106–110. PMID:11197397
34. Aluvaala J, Nyamai R, Were F, Wasunna A, Kosgei R, Karumbi J, et al. (2015) Assessment of neonatal care in clinical training facilities in Kenya. Arch Dis Child 100: 42–47. doi: 10.1136/archdischild-2014-306423PMID:25138104
35. Bhutta ZA, Das JK, Walker N, Rizvi A, Campbell H, Rudan I, et al. (2013) Interventions to address deaths from childhood pneumonia and diarrhoea equitably: what works and at what cost? Lancet 381: 1417–1429. doi:10.1016/S0140-6736(13)60648-0PMID:23582723