Transcriptome Analysis Reveals Key
Flavonoid 3
0
-Hydroxylase and Flavonoid 3
0
,5
0
-Hydroxylase Genes in Affecting the Ratio of
Dihydroxylated to Trihydroxylated Catechins
in
Camellia sinensis
Kang Wei1,2, Liyuan Wang1,2, Chengcai Zhang1,2, Liyun Wu1,2, Hailin Li1,2, Fen Zhang1,2, Hao Cheng1,2*
1National Center for Tea Improvement, Tea Research Institute Chinese Academy of Agricultural Sciences (TRICAAS), 9 Meiling South Road, Hangzhou, Zhejiang 310008, China,2Key Laboratory of Tea Plant Biology and Resources Utilization, Ministry of Agriculture, Hangzhou 310008, China
Abstract
The ratio of dihydroxylated to trihydroxylated catechins (RDTC) is an important indicator of tea quality and biochemical marker for the study of genetic diversity. It is reported to be
under genetic control but the underlying mechanism is not well understood. Flavonoid 30
-hydroxylase (F30H) and flavonoid 30,50-hydroxylase (F3050H) are key enzymes involved in
the formation of dihydroxylated and trihydroxylated catechins. The transcriptome and HPLC analysis of tea samples from Longjing43 and Zhonghuang2 under control and shading
treatment were performed to assess the F30H and F3050H genes that might affect RDTC. A
total of 74.7 million reads of mRNA seq (2×101bp) data were generated. Afterde novo
assembly, 109,909 unigenes were obtained, and 39,982 of them were annotated using 7
public databases. Four key F30H and F3050H genes (includingCsF3050H1,CsF30H1,
CsF30H2andCsF30H3) were identified to be closely correlated with RDTC. Shading
treat-ment had little effect on RDTC, which was attributed to the stable expression of these key
F30H and F3050H genes. The correlation of the coexpression of four key genes and RDTC
was further confirmed among 13 tea varieties by real time PCR and HPLC analysis. The
coexpression of three F30H genes and a F3050H gene may play a key role in affecting RDTC
inCamellia sinensis. The current results may establish valuable foundation for further research about the mechanism controlling catechin composition in tea.
Introduction
Tea (Camellia sinensisL.) is a popular drink worldwide, and it is purported to offer protection against cancer [1], cardiovascular diseases [2] and obesity-related disorders [3]. These benefit effects are mainly associated with the high accumulation of catechins, which possess strong radical scavenging and antioxidant effects [4]. In fact, tea catechins have ideal structural
OPEN ACCESS
Citation:Wei K, Wang L, Zhang C, Wu L, Li H, Zhang F, et al. (2015) Transcriptome Analysis Reveals Key Flavonoid 30-Hydroxylase and
Flavonoid 30,50-Hydroxylase Genes in Affecting the
Ratio of Dihydroxylated to Trihydroxylated Catechins inCamellia sinensis. PLoS ONE 10(9): e0137925. doi:10.1371/journal.pone.0137925
Editor:Tapan Kumar Mondal, NBPGR, INDIA
Received:June 24, 2015
Accepted:August 23, 2015
Published:September 14, 2015
Copyright:© 2015 Wei et al. This is an open access article distributed under the terms of theCreative Commons Attribution License, which permits unrestricted use, distribution, and reproduction in any medium, provided the original author and source are credited.
Data Availability Statement:All SRA files are available from the NCBI database (NCBI BioProject Accession: PRJNA261659,http://www.ncbi.nlm.nih. gov/bioproject/261659).
chemistry for free radical scavenging activities. They appear to be more effective antioxidants in vivothan vitamins E or C [5]. Major catechins in tea include (-)-epigallocatechin gallate
(EGCG), (-)-epigallocatechin (EGC), (-)-epicatechin gallate (ECG), (-)-epicatechin (EC), (-)-gallocatechin (GC) and (+)-catechin (C). Among them, EGCG was found to be the most abundant and effective scavenger of free radicals [6]. According to their structural differences at the 50position in the B ring, tea catechins can be divided into dihydroxylated (ECG, EC and
C) and trihydroxylated catechins (EGCG, EGC and GC) (Fig 1A). Structure-activity relation-ship studies have shown that the presence of the hydroxyl group at the 50position in the B ring
is crucial for scavenging activity. For example, the free radical scavenging effects of EGC and GC are stronger than those of EC and C [7,8]. Furthermore, the ratio of dihydroxylated to tri-hydroxylated catechins (RDTC) inC.sinensisis reported to be under genetic control and widely used as an indicator of tea quality and as a biochemical marker for studying genetic diversity [9–13]. It is therefore highly essential to understand the underlying mechanism con-trolling the RDTC inC.sinensis, which still remains unclear.
Tea catechins are biosynthesized by the phenylpropanoid and flavonoid pathways, in which dozens of enzymes are involved [14]. Flavonoid 30-hydroxylase (F30H) and flavonoid 30,50
-hydroxylase (F3050H) are two important enzymes controlling the hydroxylation of naringenin
and dihydrokaempferol at either the 30position or at both the 30and 50positions in the B ring
(Fig 1A) [15]. The resultant intermediates then flow through downstream enzymes to form
dihydroxylated and trihydroxylated flavonoids. In this way, F30Hs and F3050Hs play a key role
in affecting the composition of dihydroxylated and trihydroxylated flavonoids. For example, Castellarin et al. (2006) reported that the expression of F30H and F3050H genes directly affected
the accumulation of cyanidin-(dihydroxylated)/delphinidin-(trihydroxylated) based anthocya-nins in berry skin of grapevines, which determines the color variation among grape varieties [16]. However, to date, no correlation between the expression of F30H and F3050H genes and
RDTC has been established inC.sinensis. One of the reasons for this is that there may be many F30H and F3050H genes inC.sinensisand the key genes have not yet been characterized. Another reason is that RDTC might be dependent on the coexpression of both F30H and
F3050H genes rather than either type alone, which renders previous correlation analyses of
can-didate gene expressions and catechin contents difficult to unravel [17,18].
The RNA-Seq method, which was recently developed, largely overcomes these limitations [19–21]. RNA-Seq method can be used to identify genes that may encode F30H and F3050H
enzymes and so identify the key genes according to their expressions. Moreover, the combina-tion of metabolome and RNA-Seq analyses can provide precise informacombina-tion regarding gene-to-metabolite networks for identifying key genes. For example, Wu et al. (2014) reported six cate-chin biosynthetic genes closely associated with their corresponding catecate-chins inC.sinensis mainly by the combination of HPLC and RNA-Seq analyses [22]. Therefore, identification of the association between RDTC and RNA-Seq results can largely facilitate relative studies. On the other hand, a novel chlorophyll-deficient chlorina tea cultivar, Zhonghuang2 was recently bred by Tea Research Institute Chinese Academy of Agricultural Sciences (TRICAAS), which showed lower total catechin contents than the normal green tea cultivar Longjing43 [23]. Fur-ther characterization of the individual catechins showed the RDTC in Zhonghuang2 to be much lower than in Longjing43 (Fig 1B). Because shading treatment facilitates chlorophyll for-mation and largely affects catechin biosynthesis, it was also used to determine its effect on RDTC. Shading treatment largely decreased all catechin contents, but it had little effect on RDTC in either cultivar, which raises questions about how the RDTC was regulated. In this study, tea samples from both cultivars under control and shading treatment were used for RNA-seq analysis (NCBI BioProject Accession: PRJNA261659,http://www.ncbi.nlm.nih.gov/
bioproject/261659) and HPLC analysis of catechins. The purposes of this work were (1) to
study design, data collection and analysis. The National Natural Science Foundation of China (31470396) had a role in preparation of the manuscript and publication.
Competing Interests:The authors have declared that no competing interests exist.
Abbreviations:AE, Amplification efficiency; ANOVA, Analysis of variance; C, (+)-catechin; COG, Clusters of Orthologous Groups of proteins; EC,
(-)-epicatechin; ECG, (-)-epicatechingallate; EGC, (-)-epigallocatechin; EGCG,
(-)-Epigallocatechingallate; F30H, Flavonoid 30
-hydroxylase; F3050H, Flavonoid 30,50-hydroxylase;
identify key F30H and F3050H genes affecting RDTC inC.sinensis; (2) to investigate variety and shading effects on RDTC inC.sinensis.
Materials and Methods
Plant Material
Tea cultivars‘‘Longjing 43@and“Zhonghuang 2”were grown in the experimental tea garden of TRICAAS in Hangzhou, China (120°120E, 30°160N). Each tea field was separated into two
parts, one subjected to the shading treatment with sun shade net (2 m × 20 m, shading rate: 80 ± 5%) and the other one without shading (control). The shading experiment was conducted from July 1st to July 7th 2013. After that, fresh materials (one leaf and a bud) were collected from each treatment and stored at -70°C. Parts of tea samples were used for RNA-Seq experi-ment. The rest tea samples were dried by a freeze dryer (Labconco Stoppering Tray Dryer,
Fig 1. Catechin biosynthetic pathway and chromatogram of typical tea samples.a.Catechin biosynthetic pathways inCamellia sinensis.F30H and F3050H are two key enzymes controlling the hydroxylation of naringenin and dihydrokaempferol at either the 30position or at both the 30and 50positions in the B ring. Abbreviations of enzymes are as follows: CHS, chalcone synthase (EC 2.3.1.74); CHI, chalcone isomerase (EC 5.5.1.6); F3H, flavanone
3-hydroxylase (EC 1.14.11.9); F30,50H, flavonoid 30,50-hydroxylase (EC 1.14.13.88); F30H, flavonoid 30-hydroxylase (EC 1.14.13.21); FLS, flavonol synthase (EC 1.14.11.23); DFR, dihydroflavanol 4-reductase (EC 1.1.1.219); ANS, anthocyanidin synthase (EC 1.14.11.19); ANR, anthocyanidin reductase (EC 1.3.1.77); LAR, leucocyanidin reductase (EC 1.17.1.3); FGS, flavan-3-ol gallate synthase (EC number not assigned). b. Chromatogram of tea samples from Longjing43 and Zhonghuang2 under control. Peak 1, EGC; 2, C; 3, Caffeine; 4, EC; 5,EGCG; 6,ECG. Zhonghuang2 had higher EGCG content and Longjing43 had higher ECG content.
Labconco Inc., Kansas City, MO) at -5°C for 72 hours. The freeze-dried samples were then sub-ject to catechin analysis.
Furthermore, thirteen tea varieties, namely Longjing43, Zhonghuang2, Fudingdabaicha, Anjibaicha, Wuniuzao, Zhongcha108, XKW15, Qiqu3, Lj001, XKW8, Xinxuan7, XKW10, XKW5 grown in the experimental tea garden of TRICAAS were utilized for verification experi-ment. Fresh materials (one leaf and a bud) were collected on Sep 2, 2014 from each variety and stored at -70°C. Parts of tea samples were used for real time PCR analysis. The rest tea samples were dried by the freeze dryer and subject to catechin analysis.
RNA Sequencing Analysis
RNA sequencing of four tea samples (control of Longjing 43, shading treatment of Longjing 43, control of Zhonghuang2, shading treatment of Zhonghuang2),de novoassembly and func-tional annotation were performed exactly according to the method described by Wei et al. (2014) [20]. All genes annotated to F30H and F3050H were identified for further analysis.
Fur-thermore, amino acid sequences of key F30Hs (CsF30H1,CsF30H2,CsF30H3) andCsF3050H1 identified in this study as well as other F30H, F3050H genes obtained from NCBI website were
aligned using ClustalX. A Phylogenetic tree was constructed from the clustal alignment using the maximum-likelihood method in the MEGA5.05 package.
Expression Analysis of Candidate F3
0H and F3
05
0H Genes
For expression analysis of candidate F30H and F3050H genes, reads per kilobase per million
reads (RPKM) was used as a value of normalized gene expression [24]. Statistical comparison of RPKM values among four tea samples was conducted using a web tool IDEG6 (http://
telethon.bio.unipd.it/bioinfo/IDEG6_form/) [25].
Catechin Analysis
Standard Chemicals. The standard chemicals, including caffeine, C, EC, EGC, EGCG, GC and ECG were purchased from Sigma Chemical Company (St. Louis, MO, USA).
Extraction Method. Tea sample (0.2 g, dry weight) was extracted with 5 ml 70% methanol in a water bath at 70°C for 10 min with intermittent shaking. The supernatant was then centri-fuged at 3500 × g for 10 min at 4°C and transferred to a 10 ml volumetric flask. The extraction steps were repeated again to reach a final volume of 10 ml. The extracts were filtered through a 0.45-μm Millipore filter before the injection was made.
Chromatographic Analysis. The catechins contents of tea samples were analyzed through RP-HPLC according to the method described by Rio et al. (2004) [26]. The extracts were ana-lyzed using an Agilent 1100 HPLC system. A Phenomenex RP-MAX C12 reverse phase col-umn (4μm 250 mm×4.6 mm i.d.) was used for chromatographic separation, which was maintained at 40°C, eluted at 1 ml min-1with a 60 min gradient of 4–25% gradient of acetoni-trile in water containing 1% formic acid and monitored at 280 nm [26]. RDTC was calculated by the formula as follows: RDTC = (ECG+EC+C)/(EGCG+EGC+GC).
Real Time RT-PCR Analysis
To validate the correlation between the expressions of key F30H and F3050H genes and RDTC
inC.sinensis,CsF3050H1(comp149726_c0) and three key F30H genes (CsF30H1,
Primers were designed using Primer 3 software to amplify 200-241bp fragments for F30Hs and
169 bp forF3050H1selected from the RNA-Seq libraries (Table 1). Real time expression assays were performed as described by Wei et al. (2014) [20]. The amplification efficiency (AE) was calculated as described by Hellemans et al. (2007) [28]. Relative amounts were calculated and normalized with respect to the internal controlGAPDHtranscript levels. The transcript levels forCsF30H1andCsF3050H1in Longjing43 were taken as 1.0. Relative amounts ofCsF30H2and CsF30H3were calculated according to the transcript level ofCsF30H1in Longjing43 as the
method described by Tuteja et al. (2004) [29]. Expression ratios of F30Hs to F3050H were
calcu-lated by the formula as (CsF30H1+CsF30H2+CsF30H3)/CsF3050H1.
Data Analysis
Analysis of variance was performed with SPSS 16.0 statistical software. Differences among means were evaluated using the Duncan0s multiple range test [30]. Correlation coefficients
were calculated for RDTC and expression ratios of F30H genes toF3050H1gene in different varieties.
Results
Comparison of Catechin Contents in cv. Zhonghuang2 and Longjing43
Under Different Treatments
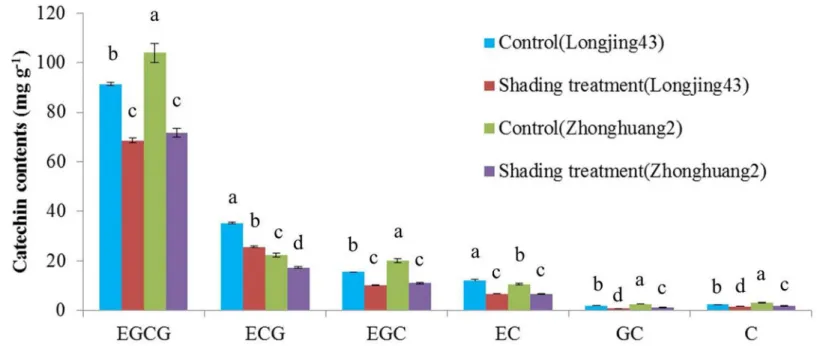
Typical chromatograms of catechins separated from controls ofcv. Longjing43 and Zhon-ghuang2 are shown inFig 1B, and means and standard deviations (SD) of six catechin contents in both cultivars under different treatments are shown inFig 2. The HPLC results showed that EGCG, which ranged from 68.6 to 104.0 mg/g, was the most abundant catechin fraction, while GC was the least abundant. Shading treatment significantly decreased all catechin fractions, irrespective of cultivars. This is in agreement with previous reports [31,32]. An interesting observation from this study is that the trihydroxylated catechin contents (EGCG, EGC and GC) ofcv. Zhonghuang2 were significantly higher but the dihydroxylated catechin contents (ECG, EC and C) were significantly lower than those of Longjing43, irrespective of treatments, indicating the RDTC of Zhonghuang2 is much lower than that of Longjing43.
To further characterize the cultivar and shading effects on RDTC, means and SD of RDTC were calculated and compared.Fig 3shows that the RDTC in Zhonghuang2 were 38% (con-trol) and 29% (shading treatment) lower than those in Longjing43. While the RDTC of the control and shading treatment showed only 6% (Longjing43) and 8% (Zhonghuang2)
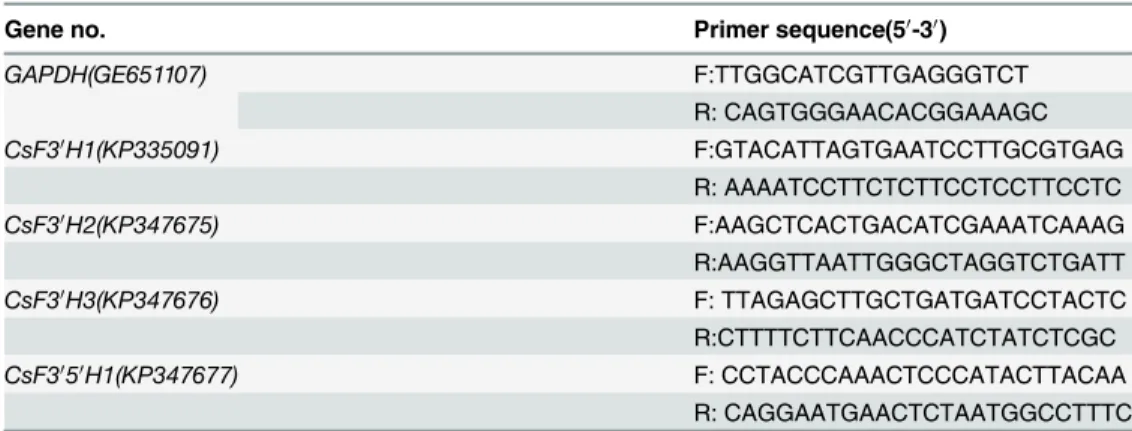
Table 1. Primers used for quantitative real time RT-PCR.
Gene no. Primer sequence(50-30)
GAPDH(GE651107) F:TTGGCATCGTTGAGGGTCT
R: CAGTGGGAACACGGAAAGC
CsF30H1(KP335091) F:GTACATTAGTGAATCCTTGCGTGAG
R: AAAATCCTTCTCTTCCTCCTTCCTC
CsF30H2(KP347675) F:AAGCTCACTGACATCGAAATCAAAG
R:AAGGTTAATTGGGCTAGGTCTGATT
CsF30H3(KP347676) F: TTAGAGCTTGCTGATGATCCTACTC
R:CTTTTCTTCAACCCATCTATCTCGC
CsF3050H1(KP347677) F: CCTACCCAAACTCCCATACTTACAA
R: CAGGAATGAACTCTAATGGCCTTTC
differences, which were much lower than the differences between cultivars (Fig 3). Further analysis of variance (ANOVA) showed that the RDTC is mainly affected by cultivars (Partial Eta Squared = 0.999) rather than shading treatment (Partial Eta Squared = 0.412), which is consistent with previous findings [9–13].
Identification of F3
0H and F3
05
0H Genes by RNA-seq Analysis
To identify F30H and F3050H genes that may affect dihydroxylated and trihydroxylated catechin
biosynthesis, tea samples from cultivars under both control and shading treatment were used for RNA-Seq analysis. Four cDNA libraries were generated and subjected to sequencing by the Illumina HiSeq2000 genome analyzer. A total of 74.7 million 101-bp paired-end reads were obtained (Table 2) and deposited in the National Center for Biotechnology Information (NCBI) with accession number of PRJNA261659 (http://www.ncbi.nlm.nih.gov/bioproject/
261659). Low-quality sequences were then trimmed and combined cleaned reads from four
libraries were assembled using the software Trinity. Finally, a total of 109,909 unigenes were obtained, with an average length of 793bp and N50 length of 992 bp (Table 3).
Thirty six percent of the unigenes (39,982) were annotated using 7 public databases (the COG, GO, KEGG, Swiss-Prot, TrEMBL, NR and NT databases) with an E-value threshold of
10−5(Table 4). Among them, 7 F3050H and 4 F30H genes were identified. Expressions of these
unigenes in each library with log2(RPKM) were compared inFig 4. Results showed that the
expression of comp149726_c0 (CsF3050H1) was much higher than other F3050H genes, which
suggests that it might be the most important F3050H gene. Moreover, four F3050H genes
(comp149682_c0, comp143001_c0, comp140473_c0 and comp49766_c0) had very low log2(RPKM), indicating at most 3 F3050H genes could be considered as candidate key F3050H
genes. In terms of F30Hs, only one unigene (comp124968_c0) showed much lower expression
than the other three F30H genes (CsF30H1, comp143838_c0;CsF30H2, comp147206_c0;
Fig 2. Catechin composition obtained by HPLC from Longjing43 and Zhonghuang2 under control and shading treatment (Mean±standard deviation, n = 3).Means in each column for each catechins labeled with the same letter are not significantly different (P>0.05) based on one-way ANOVA with Duncan0s multiple range test.
CsF30H3, comp141172_c0), which indicates that there might be three key F30H genes
(CsF30H1,CsF30H2andCsF30H3) inC.sinensis.
Moreover, the RPKM ofCsF3050H1in Zhonghuang2 was much higher, whileCsF30H2and CsF30H3were much lower than those in Longjing43, irrespective of treatments, which is
con-sistent with the trend of change in RDTC (Figs3and4). Shading treatment seems to have little effect on RPKM ofCsF3050H1,CsF30H1,CsF30H2andCsF30H3in both cultivars, which explains the less pronounced effects of shading treatment on RDTC.
Correlation Analysis of Key F3
0H and F3
05
0H Genes and RDTC
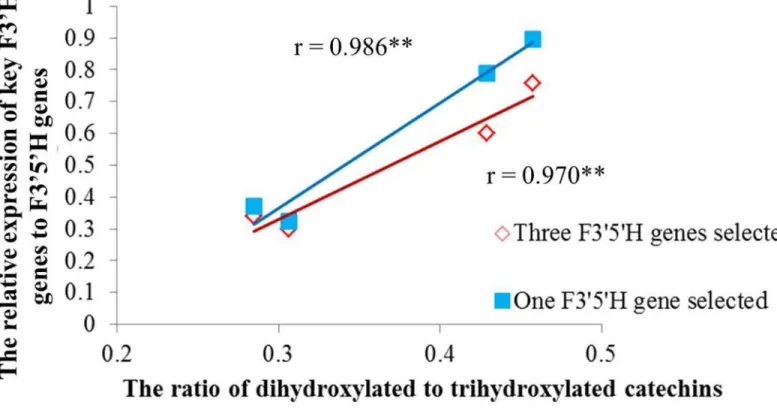
Correlation analysis was carried out to further explore the relationship between key F30H,
F3050H genes and RDTC (Fig 5). The expression ratios of key F30H genes (CsF30H1+CsF30H2
Fig 3. The ratio of dihydroxylated to trihydroxylated catechins in Longjing43 and Zhonghuang2 under control and shading treatment (Mean
±standard deviation, n = 3).Means showing significant difference (P<0.05) are labeled with different letters based on one-way ANOVA with Duncan0s multiple range test.
doi:10.1371/journal.pone.0137925.g003
Table 2. Summary for RNA-Seq datasets ofC.sinensis.
Cultivars Treatments Number of reads (million) Total base (Gb) Q20 percentage
Longjing43 Control 18.659 3.591 85.15%
Shading 17.783 3.592 88.77%
Zhonghuang2 Control 18.245 3.685 88.72%
Shading 20.011 4.042 89.03%
+CsF30H3) toCsF3050H1and key F30H genes to the top three highly expressed F3050H genes
were calculated to determine their effects on the variation of RDTC. Correlation analysis dis-played that both expression ratios were highly significantly correlated with RDTC, indicating the expression ratio of F30H to F3050H genes plays a vital role in determining the variance of
RDTC (Fig 5). Furthermore, the correlation coefficient between the expression ratio of key F30H genes toCsF3050H1and RDTC (r = 0.986) was a bit higher than that between key F30H
genes to top three F3050H genes and RDTC (r = 0.970), suggesting thatCsF3050H1is much more important than other F3050H genes in affecting RDTC.
Phylogenetic Analysis
When the deduced amino acid sequences of the four key genes were utilized in a BLAST search of GenBank (http://blast.ncbi.nlm.nih.gov/Blast.cgi),CsF3050H1andCsF30H2were closely matched to the putative F3'5'H (GenBank accession AAY23287) and F30H (GenBank accession
ACV74415) fromC.sinensis, with 100% and 99% identity respectively.CsF30H1andCsF30H3 were highly similar to F30H fromActinidia chinensis(GenBank accession ADC34701), with 66% and 83% identity respectively, indicating that they were newly identified inC.sinensis. ClustalX was utilized to compare amino acid sequences with 49 F30H and F3050H genes,
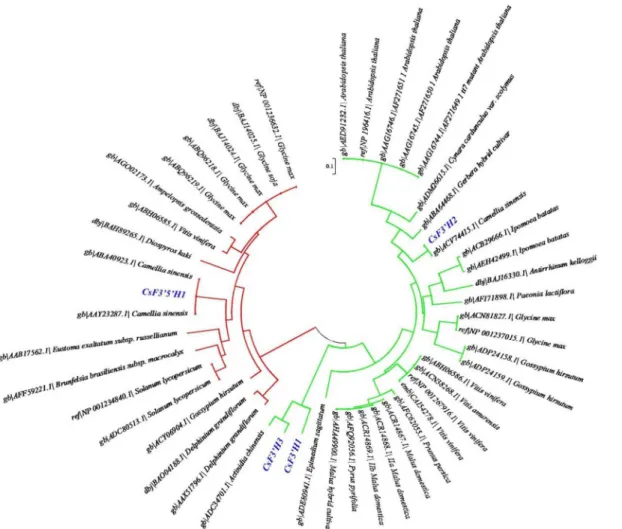
which include 45 sequences downloaded from the NCBI protein database and 4 key genes identified in this study. A phylogenetic tree was generated according to the alignment results by MEGA5.05 (Fig 6). The F30H and F3'5'H sequences were classified into two distinct clusters,
which suggests they differ in basic structure. Based on the blast search and phylogeny analysis, theCsF3'5'H1and threeCsF30Hsgenes were clearly classified into different gene families, indi-cating their potentially different functions. Furthermore,CsF30H2seems to be largely different fromCsF30H1andCsF30H3. Therefore, their differences in enzyme activities and expression patterns are worth further detail studies.
Table 3. Length distribution of assembled unigenes.
Unigenes length (bp) Number of sequences Percentage
300–500 53196 48.40%
500–1000 34439 31.33%
1000–2000 14603 13.29%
2000+ 7671 6.98%
Total number 109909
Average length 793
N50 length 992
doi:10.1371/journal.pone.0137925.t003
Table 4. Summary for the BLASTx results ofC.sinensistranscriptome against seven databases.
Annotation database Annotated Number
COG annotation 9067
GO annotation 26187
KEGG annotation 5877
Swissprot annotation 21325
TrEMBL annotation 34956
NR annotation 34837
NT annotation 29528
All annotated unigenes 39982
Validation of the Relationship Between Key F3
0H, F3
05
0H Genes and
RDTC Among Thirteen Varieties
To validate the RNA-Seq results, thirteen varieties were selected for real time RT-PCR and cat-echin analysis. Five of them (Longjing43, Fudingdabaicha, Anjibaicha, Wuniuzao, Zhong-cha108) are widely cultivated in China, and the rest were newly bred by TRICAAS. According to our previous research, these varieties showed large differences in RDTC (data not shown). Therefore, both the expressions of key F30H, F3050H genes and RDTC of these varieties were
determined in this study to validate their correlation. The results showed that the highest RDTC was identified in XKW15 (0.533) and the lowest in Zhonghuang2 (0.285) (S1 Fig). Fur-thermore, the RDTC of Longjing43 and Zhonghuang2 harvested in September 2014 were not largely different from those plucked in July 2013, demonstrating that RDTC is also not greatly affected by season. The real time RT-PCR results are shown inS2andS3Figs. Correlation anal-ysis unveiled that the expression ratios of F30H genes (CsF30H1,CsF30H2andCsF30H3) to
Fig 4. The log2(RPKM) of candidate F3050H and F30H genes in Longjing43 and Zhonghuang2 under control and shading treatment.
CsF3050H1were significantly and positively correlated with RDTC among the thirteen varieties
(r = 0.934), which is highly consistent with our previous RNA-Seq results (Fig 7).
Discussion
Both F30H and F3050H enzymes as well as their encoding genes have been widely studied in
horticultural species and fruit trees, such as cyclamen [33], rose [34] and grapevine [35], as they are important in determining flower and fruit coloration. However, for tea plants, under-standing of these enzymes is still limited, although they may play an important role in affecting catechin compositions in tea leaves. A novel development is that Wang et al. (2014) firstly con-firmed aCsF3050H(NCBI cDNA accession number: DQ194358) functioned as a F3050H
enzyme [36]. According to his study, when CsF3050H was transformed intoNicotiana tabacum, the expressions of CsF3050H were positively correlated with the ratio of delphinidin to cyanidin
in different transgenic lines. However, whether it is the key gene affecting trihydroxylated cate-chin biosynthesis in tea leaves is still not clear. This would be largely dependent on its expres-sion level as relative to other homologous genes. Wu et al. (2014) did a correlation analysis between catechin contents and the expressions of their corresponding genes identified by RNA-Seq [22]. According to his study, the high dihydroxylated catechin contents in tea variety
‘Ruchengmaoyecha’might be associated with the low expression of a F3050H gene. However,
except for that, few direct correlation analysis was reported between candidate F30H or F3050H
genes and RDTC inC.sinensis. Therefore, a global search of the major F30H and F3050H genes
inC.sinensisis required for relative study.
Fig 5. Correlation analysis of the relative expression of key F30H genes to F3050H genes and ratio of dihydroxylated to trihydroxylated catechins in Longjing43 and Zhonghuang2 under control and shading treatment.Red line represents the trend of (CsF30H1+CsF30H2+CsF30H3)/ (CsF3050H1 +CsF3050H2+CsF3050H3) to the ratio of dihydroxylated to trihydroxylated catechins. Blue line represents the trend of (CsF30H1+CsF30H2+CsF30H3)/ CsF3050H1to the ratio of dihydroxylated to trihydroxylated catechins.**represents highly significant at p<0.01.
The current work is the first to show that the coexpression of four key genes (including a F3050H gene and three F30H genes) was closely correlated with the RDTC in tea samples by
RNA-Seq and HPLC analysis (Fig 5). Phylogenetic analysis showed the various F30H and
F3050H amino acid sequences were clearly classified into two groups (Fig 6), which indicates
both enzymes could be distinguished by their amino acid sequences. Moreover, the association of the four key genes and RDTC was further confirmed among 13 tea varieties by real time PCR and HPLC analysis (Fig 7), demonstrating the importance of these four genes in affecting RDTC variation among varieties.
Among the four key genes,CsF3050H1is the most highly expressed F3050H gene inC. sinen-sis, which was verified by both RNA-Seq (Fig 4) and real time PCR analysis. According to the
blast search, it is 100% identical to the F3'5'H gene fromC.sinensis(AAY23287), a gene highly expressed in young and developing tea leaves, but at most minimally expressed in stems, roots and cotyledons [14]. Furthermore,CsF3050H1was found to have 96% identity withCsF3050H (DQ194358) characterized by Wang0s group (2014) according to amino acid sequences [36].
The expression pattern ofCsF3050H(DQ194358) was tissue specific, very high in buds and low in roots, which was similar to AAY23287 [14,36]. Moreover, the expression ofCsF3050H (DQ194358) was not significantly affected by shading in bud and first leaves, which was similar
Fig 6. Phylogenetic analysis of F30H and F3050H amino acid sequences.Red lines represent F3050H and green lines represent F30H. Four key genes identified in this study are marked in blue color.
to our results [32]. Therefore, these results confirmed thatCsF3050H1andCsF3050H (DQ194358) are homologous genes in different varieties and they are the most important F3050H genes in tea buds and leaves.
Although F3050H is the key enzyme controlling the formation of trihydroxylated flavonoids
[15], few direct correlation between the expression ofCsF3050H1and trihydroxylated catechins has been observed by either the present research or other relative studies, revealing the forma-tion of trihydroxylated catechins might also rely on the expressions of F30H genes, which are
involved in the competition for naringenin and dihydrokaempferol with F3050H [32,37]. Three
key F30H genes (CsF30H1,CsF30H2andCsF30H3) were observed in this study, which was con-sistent with the finding by Jiang et al. (2013) [38]. Phylogenetic analysis showed thatCsF30H2 was largely different fromCsF30H1andCsF30H3. Meanwhile, the expression ofCsF30H2was much higher thanCsF30H1andCsF30H3in most varieties (S2 Fig), illustratingCsF30H2may play a more vital role in the formation of dihydroxylated catechins. Furthermore, single nucleo-tide polymorphism (SNP) markers ofCsF30H1,CsF30H3andCsF3050H1were developed according to the RNA-Seq results (S1 Table), which might be correlated with RDTC. However, no SNP was identified inCsF30H2, indicating the gene might be highly conserved in tea plants. Anyway, further studies are required to verify this hypothesis, such as enzyme activity and Western blot analysis.
It is also worth noting that shading treatment had little effect on RDTC inC.sinensis, which was attributed to the stable expression of the key F30H and F3050H genes (Figs3and4). Both
F30H and F3050H belong to cytochrome P450 protein family and their activities rely on
Fig 7. Correlation of the relative expression of key F30H genes toCsF3050H1and the ratio of dihydroxylated to trihydroxylated catechins among 13 varieties.Blue line represents the trend of the relative expression of (CsF30H1+CsF30H2+CsF30H3)/CsF3050H1to the ratio of dihydroxylated to
trihydroxylated catechins.**represents highly significant at p<0.01.
associated proteins like cytochrome P450 reductase and cytochrome b5, which are involved in
the transfer of electrons to their prosthetic heme group [39]. Bogs et al. (2006) reported a puta-tive cytochrome b5gene was closely correlated with the expression of F30H and F3050H genes in
grape [35]. Here, 13 putative cytochrome b5genes were identified in this study. Among them,
the expression patterns of two cytochrome b5genes (accession number: KT354240, KT354241)
were closely associated with the expressions of F30H and F3050H genes. Further exploration of
these genes will facilitate a deeper understanding of the regulation system of the key F30H and
F3050H genes inC.sinensis.
Conclusions
In summary, four key F30H and F3050H genes were identified to be correlated with RDTC inC. sinensis. Both RDTC and the expression of key F30H and F3050H genes were mainly affected by
varieties rather than shading treatment, which was in agreement with previous findings [9,10]. Although the regulation system of F30H and F3050H genes in different variety remains elusive,
our work provides a direction for future study in this field. Moreover, the transcripts obtained in this study will also facilitate genomic studies onC.sinensis.
Supporting Information
S1 Fig. The variation of ratio of dihydroxylated to trihydroxylated catechins in 13 tea varie-ties (Mean±standard deviation, n = 3).
(TIF)
S2 Fig. Real time-PCR analysis of key F30H genes in 13 tea varieties.Data of real time PCR
analysis are the means and standard deviations (n = 4). (TIF)
S3 Fig. Real time-PCR analysis ofCsF3050H1genes in 13 tea varieties.Data of real time PCR
analysis are the means and standard deviations (n = 4). (TIF)
S1 Table. SNP markers ofCsF30H1,CsF30H3andCsF3050H1.
(XLSX)
Author Contributions
Conceived and designed the experiments: KW HC. Performed the experiments: KW L. Wang CZ L. Wu HL FZ. Analyzed the data: KW L. Wang HC. Contributed reagents/materials/analy-sis tools: KW HC L. Wang. Wrote the paper: KW. Manuscript comments: HC.
References
1. Katiyar S, Mukhtar H. Tea in chemoprevention of cancer. Int J Oncol. 1996; 8: 221–238. doi:10.3892/
ijo.8.2.221PMID:21544351
2. Tijburg LBM, Mattern T, Folts JD, Weisgerber UM, Katan MB. Tea flavonoids and cardiovascular dis-eases: A review. Crit Rev Food Sci. 1997; 37:771–785. doi:10.1080/10408399709527802
3. Wolfram S, Wang Y, Thielecke F. Anti-obesity effects of green tea: From bedside to bench. Mol Nutr Food Res. 2006; 50:176–187. doi:10.1002/mnfr.200500102PMID:16470636
4. Soobrattee MA, Neergheen VS, Luximon-Ramma A, Aruoma OI, Bahorun T. Phenolics as potential antioxidant therapeutic agents: Mechanism and actions. Mutat Res-Fund Mol M. 2005; 579:200–213.
doi:10.1016/j.mrfmmm.2005.03.023
6. Nanjo F, Mori M, Goto K, Hara Y. Radical scavenging activity of tea catechins and their related com-pounds. Biosci Biotechnol Biochem. 1999; 63:1621–1623. doi:10.1271/bbb.63.1621PMID:10610125
7. Guo Q, Zhao B, Shen S, Hou J, Hu J, Xin W. ESR study on the structure-antioxidant activity relationship of tea catechins and their epimers. BBA-Gen Subjects. 1999; 1427:13–23. doi:10.1016/S0304-4165
(98)00168-8
8. Nakagawa T, Yokozawa T. Direct scavenging of nitric oxide and superoxide by green tea. Food Chem Toxicol. 2002; 40:1745–1750. doi:10.1016/S0278-6915(02)00169-2PMID:12419687
9. Gerats AM, Martin C. Flavanoid synthesis in Petunia hybrid: Genetic sand molecular biology of flower colour. In Stafford H. A. & Ibrahim R. K. (Eds.), Phenolic metabolism in plants. New York: Plenum Press; 1992. p. 167–175.
10. Saravanan M, Maria John KM, Raj Kumar R, Pius PK, Sasikumar R. Genetic diversity of UPASI tea clones (Camellia sinensis(L.) O.Kuntze) on the basis of total catechins and their fractions. Phytochem-istry. 2005; 66:561–565. doi:10.1016/j.phytochem.2004.06.024PMID:15721948
11. Owuor PO, Obanda M. The use of green tea (Camellia sinensis) leaf flavan-3-ol composition in predict-ing plain black tea quality potential. Food Chem. 2007; 100:873–884. doi:10.1016/j.foodchem.2005.
10.030
12. Wei K, Wang LY, Zhou J, He W, Zeng JM, Jiang YW, et al. Catechin contents in tea (Camellia sinensis) as affected by cultivar and environment and their relation to chlorophyll contents. Food Chem. 2011; 125:44–48. doi:10.1016/j.foodchem.2010.08.029
13. Jin JQ, Ma JQ, Ma CL, Yao MZ, Chen L. Determination of catechin content in representative Chinese tea germplasms. J Agric Food Chem. 2014; 62:9436–9441. doi:10.1021/jf5024559PMID:25204786
14. Ashihara H, Deng W, Mullen W, Crozier A. Distribution and biosynthesis of flavan-3-ols inCamellia sinensisseedlings and expression of genes encoding biosynthetic enzymes. Phytochemistry. 2010; 71:559–566. doi:10.1016/j.phytochem.2010.01.010PMID:20189205
15. Toda K, Yang D, Yamanaka N, Watanabe S, Harada K, Takahashi R. A single-base deletion in soy-bean flavonoid 30-hydroxylase gene is associated with gray pubescence color. Plant Mol Biol. 2002; 50:187–196. doi:10.1023/A:1016087221334PMID:12175012
16. Castellarin SD, Gaspero GD, Marconi R, Nonis A, Peterlunger E, Paillard S, et al. Colour variation in red grapevines (Vitis viniferaL.): genomic organisation, expression of flavonoid 3'-hydroxylase, flavo-noid 3',5'-hydroxylase genes and related metabolite profiling of red cyanidin-/blue delphinidin-based anthocyanins in berry skin. BMC Genomics. 2006; 7:12. doi:10.1186/1471-2164-7-12PMID: 16433923
17. Eungwanichayapant PD, Popluechai S. Accumulation of catechins in tea in relation to accumulation of mRNA from genes involved in catechin biosynthesis. Plant Physiol Bioch. 2009; 47:94–97. doi:10.
1016/j.plaphy.2008.11.002
18. Xiong L, Li J, Li Y, Yuan L, Liu S, Huang J, et al. Dynamic changes in catechin levels and catechin bio-synthesis-related gene expression in albino tea plants (Camellia sinensisL.). Plant Physiol Bioch. 2013; 71:132–143. doi:10.1016/j.plaphy.2013.06.019
19. Guryev V, Cuppen E. Next-generation sequencing approaches in genetic rodent model systems to study functional effects of human genetic variation. FEBS Lett. 2009; 583:1668–1673. doi:10.1016/j.
febslet.2009.04.020PMID:19379744
20. Wei K, Wang LY, Wu LY, Zhang CC, Li HL, Tan LQ, et al. Transcriptome analysis of indole-3-butyric acid-induced adventitious root formation in nodal cuttings ofCamellia sinensis(L.). PLoS ONE. 2014; 9: e107201. doi:10.1371/journal.pone.0107201PMID:25216187
21. Zeng D, Chen X, Xie D, Zhao Y, Yang C, Li Y, et al. Transcriptome analysis of pacific white shrimp (Lito-penaeus vannamei) hepatopancreas in response to Taura Syndrome Virus (TSV) experimental infec-tion. PLoS ONE. 2013; 8:e57515. doi:10.1371/journal.pone.0057515PMID:23469011
22. Wu ZJ, Li XH, Liu ZW, Xu ZS, Zhuang J.De novoassembly and transcriptome characterization: novel insights into catechins biosynthesis inCamellia sinensis. BMC Plant Biology 2014; 14:277. doi:10. 1186/s12870-014-0277-4PMID:25316555
23. Wang L, Yue C, Cao HL, Zhou YH, Zeng JM, Yang YJ, et al. Biochemical and transcriptome analyses of a novel chlorophyll-deficient chlorina tea plant cultivar. BMC Plant Biol. 2014; 14:352. doi:10.1186/ s12870-014-0352-xPMID:25491435
24. Marioni JC, Mason CE, Mane SM, Stephens M, Gilad Y. RNA-seq: an assessment of technical repro-ducibility and comparison with gene expression arrays. Genome Res. 2008; 18: 1509–1517. doi:10.
1101/gr.079558.108PMID:18550803
25. Romualdi C, Bortoluzzi S, D0Alessi F, Danieli GA. IDEG6: a web tool for detection of differentially expressed genes in multiple tag sampling experiments. Physiol Genomics. 2003; 12:159–162. doi:10.
26. Rio DD, Stewart AJ, Mullen W, Burns J, Lean MEJ, Brighenti F, et al. HPLC–MS analysis of phenolic
compounds and purine alkaloids in green and black tea. J Agric Food Chem. 2004; 52:2807–2815. doi:
10.1021/jf0354848PMID:15137818
27. Chen L, Sheng S, Tan X, Shen Y, Li H, Zhao S. An effective method of RNA isolation from Fallopia mul-tiflora tuberous roots. Prep Biochem Biotech. 2012; 42:87–96. doi:10.1080/10826068.2011.566297
28. Hellemans J, Mortier G, De Paepe A, Speleman F, Vandesompele J. qBase relative quantification framework and software for management and automated analysis of real-time quantitative PCR data. Genome Biol. 2007; 8:2. doi:10.1186/gb-2007-8-2-r19
29. Tuteja JH, Clough SJ, Chan WC, Vodkin LO. Tissue-specific gene silencing mediated by a naturally occurring chalcone synthase gene cluster inGlycine max. Plant Cell. 2004; 16:819–835. doi:http://dx.
doi.org/10.1105/tpc.021352PMID:15064367
30. Duncan DB. Multiple-range and multiple F tests. Biometrics. 1955; 11:1–42.
31. Saijo R. Effect of shade treatment on biosynthesis of catechins in tea plants. Plant Cell Physiol. 1980; 21:989–998.
32. Wang YS, Gao LP, Shan Y, Liu YJ, Tian YW, Xia T. Influence of shade on flavonoid biosynthesis in tea (Camellia sinensis(L.) O. Kuntze). Sci Hortic.2012; 141:7–16. doi:10.1016/j.scienta.2012.04.013
33. Boase MR, Lewis DH, Davies KM, Marshall GB, Patel D, Schwinn KE, et al. Isolation and antisense suppression of flavonoid 3', 5'-hydroxylase modifies flower pigments and colour in cyclamen. BMC Plant Biol. 2010; 10:107. doi:10.1186/1471-2229-10-107PMID:20540805
34. Katsumoto Y, Fukuchi-Mizutani M, Fukui Y, Brugliera F, Holton TA, Karan M, et al. Engineering of the rose flavonoid biosynthetic pathway successfully generated blue-hued flowers accumulating delphini-din. Plant Cell Physiol. 2007; 48: 1589–1600. doi:10.1093/pcp/pcm131PMID:17925311
35. Bogs J, Ebadi A, McDavid D, Robinson SP. Identification of the flavonoid hydroxylases from grapevine and their regulation during fruit development. Plant Physiol. 2006; 140:279–291. doi:http://dx.doi.org/
10.1104/pp.105.073262PMID:16377741
36. Wang YS, Xu YJ, Gao LP, Yu O, Wang XZ, He XJ, et al. Functional analysis of Flavonoid 30,50 -hydroxy-lase from Tea plant (Camellia sinensis): critical role in the accumulation of catechins. BMC Plant Biol. 2014; 14:347. doi:10.1186/s12870-014-0347-7PMID:25490984
37. Rani A, Singh K, Ahuja PS, Kumar S. Molecular regulation of catechins biosynthesis in tea [Camellia sinensis(L.) O. Kuntze]. Gene. 2012; 495:205–210. doi:10.1016/j.gene.2011.12.029PMID:22226811
38. Jiang X, Liu Y, Li W, Zhao L, Meng F, Wang YS, et al. Tissue-Specific, Development-Dependent Phe-nolic Compounds Accumulation Profile and Gene Expression Pattern in Tea Plant [Camellia sinensis]. PLoS ONE. 2013; 8: e62315. doi:10.1371/journal.pone.0062315PMID:23646127