Row Ratios of Intercropping Maize and
Soybean Can Affect Agronomic Efficiency of
the System and Subsequent Wheat
Yitao Zhang1, Jian Liu2, Jizong Zhang1*, Hongbin Liu1, Shen Liu1, Limei Zhai1, Hongyuan Wang1, Qiuliang Lei1, Tianzhi Ren3*, Changbin Yin1
1Key Laboratory of Non-point Source Pollution Control, Ministry of Agriculture, Institute of Agricultural Resources and Regional Planning, Chinese Academy of Agricultural Sciences, Beijing, 100081, PR China, 2USDA-Agricultural Research Service, Pasture Systems and Watershed Management Research Unit, University Park, Pennsylvania, 16802, United States of America,3Agro-Environmental Protection Institute, Ministry of Agriculture, Tianjin, 300191, PR China
*[email protected](JZZ); [email protected](TZR)
Abstract
Intercropping is regarded as an important agricultural practice to improve crop production and environmental quality in the regions with intensive agricultural production, e.g., northern China. To optimize agronomic advantage of maize (Zea maysL.) and soybean (Glycine maxL.) intercropping system compared to monoculture of maize, two sequential experi-ments were conducted. Experiment 1 was to screening the optimal cropping system in sum-mer that had the highest yields and economic benefits, and Experiment 2 was to identify the optimum row ratio of the intercrops selected from Experiment 1. Results of Experiment 1 showed that maize intercropping with soybean (maize || soybean) was the optimal cropping system in summer. Compared to conventional monoculture of maize, maize || soybean had significant advantage in yield, economy, land utilization ratio and reducing soil nitrate nitro-gen (N) accumulation, as well as better residual effect on the subsequent wheat (Triticum aestivumL.) crop. Experiment 2 showed that intercropping systems reduced use of N fertil-izer per unit land area and increased relative biomass of intercropped maize, due to promot-ed photosynthetic efficiency of border rows and N utilization during symbiotic period. Intercropping advantage began to emerge at tasseling stage after N topdressing for maize. Among all treatments with different row ratios, alternating four maize rows with six soybean rows (4M:6S) had the largest land equivalent ratio (1.30), total N accumulation in crops (258 kg ha-1), and economic benefit (3,408 USD ha-1). Compared to maize monoculture, 4M:6S had significantly lower nitrate-N accumulation in soil both after harvest of maize and after harvest of the subsequent wheat, but it did not decrease yield of wheat. The most important advantage of 4M:6S was to increase biomass of intercropped maize and soybean, which further led to the increase of total N accumulation by crops as well as economic benefit. In conclusion, alternating four maize rows with six soybean rows was the optimum row ratio in maize || soybean system, though this needs to be further confirmed by pluri-annual trials.
a11111
OPEN ACCESS
Citation:Zhang Y, Liu J, Zhang J, Liu H, Liu S, Zhai L, et al. (2015) Row Ratios of Intercropping Maize and Soybean Can Affect Agronomic Efficiency of the System and Subsequent Wheat. PLoS ONE 10(6): e0129245. doi:10.1371/journal.pone.0129245
Academic Editor:Zhihui Cheng, Northwest A&F University, CHINA
Received:January 18, 2015
Accepted:May 5, 2015
Published:June 10, 2015
Copyright:© 2015 Zhang et al. This is an open access article distributed under the terms of the
Creative Commons Attribution License, which permits unrestricted use, distribution, and reproduction in any medium, provided the original author and source are credited.
Data Availability Statement:All relevant data are within the paper.
Funding:This study was funded by the Special Fund for Agro-scientific Research in the Public Interest from the Ministry of Agriculture, China (201003014, 200903011). The funders had no role in study design, data collection and analysis, decision to publish, or preparation of the manuscript.
Introduction
Northern China has a very intensive agriculture with high inputs of seeds, irrigation and chem-icals, because of high pressure of food security. This has caused severe environmental problems [1], including pollution of groundwater by nitrate from soils [2], gas emission to air [3], and
soil acidification [4]. Loss of nitrogen (N) during maize (Zea maysL.) growth season is an
espe-cial concern, as excessive application of N is often combined with heavy summer rains in this region [5]. To ensure both food security and environmental quality, it is essential to seek best management practices, which include appropriate cropping systems that can efficiently utilize solar and soil resources with minimum nutrient inputs.
Intercropping, one type of a multiple cropping system, is recommended to be used in many parts of the world for food or fibers productions, because of its overall high productivi-ty, effective control of pests and diseases, good ecological services and economic profitability [6–9]. In an intercropping system, there are often two or more crop species grown in the same field for a certain period of time, even though the crops are not necessarily sown or har-vested simultaneously. In practice, most intercropping systems involve only two crops, as in-clusion of more crops results in higher labor costs [10]. An intercropping system often consists of three phases: (1) one crop grown for a short time, (2) two intercropping crops grown simultaneously for a long time, and (3) the other crop grown for a short time [11]. The second phase is essential (or even the only phase), and it is the key phase for formation of in-tercropping advantage. The success of inin-tercropping systems is due to an enhanced temporal and spatial complementarity of resource capture, for which both above-ground and below-ground parts of crops play an important role [12].
Cereal crops intercropping with legumes are a popular option in intercropping. Even though the two crops compete for soil N as they both need it for the growth, the competition
drives legumes to fix atmospheric N2in symbiosis withRhizobium[13]. This actually results
in complementary utilization of N by the crops, which is of particular importance in soils where inorganic N is limited or over-fertilized. However, negative intercropping productivity due to interspecific competition has also been reported [14], especially when the fields are managed inappropriately [11]. Therefore, only reasonable use of competitive and facilitative interactions between crops in intercropping systems can enhance crop productivity and
nu-trient use efficiency [15–17].
In China, intercropping is regarded to be an important agronomic practice, given the high pressure of food security due to the already large and increasing population with limited and decreasing area of arable land [15]. Among different kinds of intercropping systems, strip in-tercropping has the greatest advantage in terms of convenience in field management of sowing and harvest [18]. Several previous studies have reported that intercropping can increase crop yield [19], due to efficient utilization of nutrients [20] and light [21], and enhanced positive in-teractions between crops [22,23]. However, most of these studies were focused on effects of dif-ferent intercrop species [14,24]. Rare studies have been made to investigate effects of ratio of rows between crops within a specific intercropping system. There is neither report in literature
about optimum row ratio of maize intercropping with soybean (Glycine maxL.), nor
explana-tion of the processes behind.
Materials and Methods
Study area
The field experiments were conducted during 2010 to 2012 at Liucun, Xushui (38°09–39°09 N,
115°19–115°46 E), Hebei Province, North China Plain. This region has a temperate continental
monsoon climate, with four distinct seasons. The site has annual mean temperature of 11.9°C, annual precipitation of 567 mm and evaporation of 1,200 mm. Annual sunshine duration is
2,745 h and the frost-free period is 184 days. Wheat (Triticum aestivumL.)-maize rotation is a
common cropping system in this region and this system had been used during 1990–2010 on
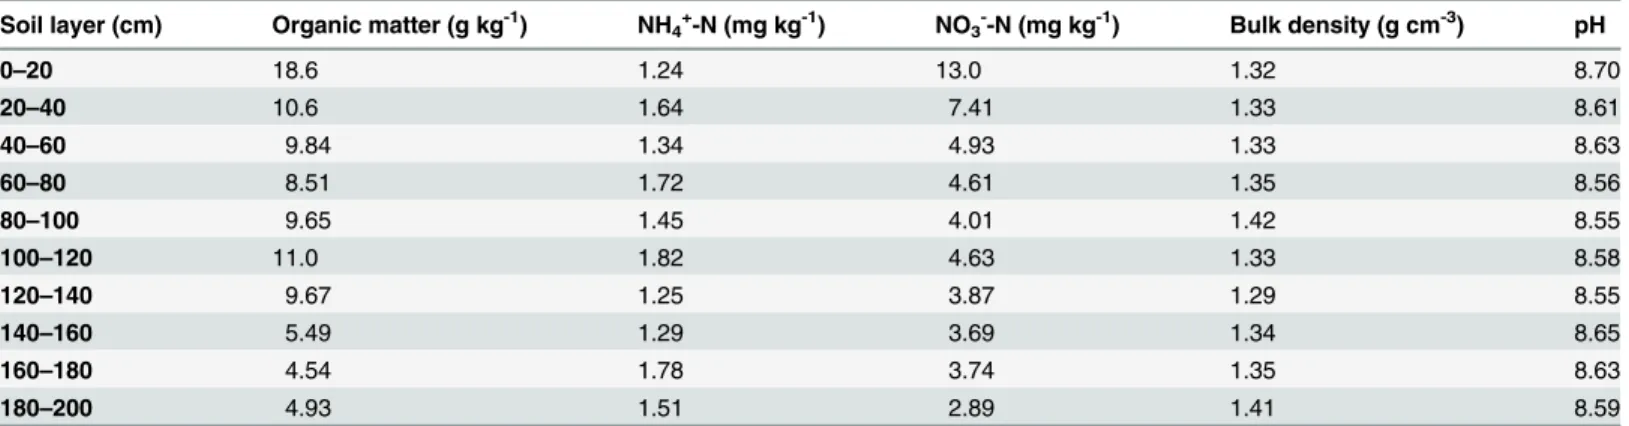
the experimental site. Each year, the field was tilled with a disk plough before sowing of wheat in October. The experimental site had a Haplic Luvisol soil (FAO classification). Physical and chemical properties of the experimental soil were determined before the start of this study (Table 1).
Ethics Statement
The experimental field used in this study belongs to the Institute of Agricultural Resources and Regional Planning (IARRP) of Chinese Academy of Agricultural Sciences (CAAS), which is a national comprehensive research institution, and it has a research ethics review committee to ensure the experiment does no harm to crops, animals and humans. Our study was approved by this committee, so no specific permissions were required for the described field experiments. The sampling locations were not privately-owned or protected in any way, and this field study did not involve any endangered or protected species. In addition, there was also no vertebrate in this study.
Experimental design
Experiment 1: screening of optimal intercropping system of maize and legume crops. This experiment was conducted from June 21st, 2010 to June 22nd, 2011. The experiment used a randomized complete block design, and it included five treatments with different cropping systems: (1) monoculture of maize, (2) monoculture of soybean, (3) monoculture of red bean (Vigna angularis (Willd.) Ohwi et OhashiL.), (4) maize intercropping with soybean (Maizeǁ
soybean), and (5) maize intercropping with red bean (Maizeǁred bean). Each treatment was
replicated three times. After harvest of these crops in autumn, a subsequent winter wheat crop (a 0.15 cm inter-row distance) was planted at all the plots. The experimental plot size ranged
from 175 m2(25 m × 7 m) to 225 m2(25 m × 9 m) in different treatments, to aid practical
Table 1. Physical and chemical properties of the experimental soil.
Soil layer (cm) Organic matter (g kg-1) NH4+-N (mg kg-1) NO3--N (mg kg-1) Bulk density (g cm-3) pH
0–20 18.6 1.24 13.0 1.32 8.70
20–40 10.6 1.64 7.41 1.33 8.61
40–60 9.84 1.34 4.93 1.33 8.63
60–80 8.51 1.72 4.61 1.35 8.56
80–100 9.65 1.45 4.01 1.42 8.55
100–120 11.0 1.82 4.63 1.33 8.58
120–140 9.67 1.25 3.87 1.29 8.55
140–160 5.49 1.29 3.69 1.34 8.65
160–180 4.54 1.78 3.74 1.35 8.63
180–200 4.93 1.51 2.89 1.41 8.59
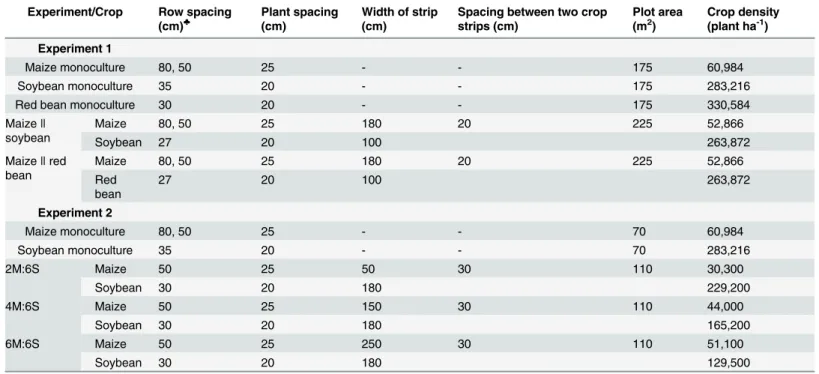
operations in the field. Detailed planting pattern of every treatment was shown inTable 2. Maize (variety Zhengdan 958, Henan Academy of Agricultural Sciences), soybean (variety Zhonghuang 30, Chinese Academy of Agricultural Sciences) and red bean (variety Jinhong 1, Heishan Jinyu Seed Co. Limited of Liaoning province) were all sown on June 21, 2010. The crops were irrigated after sowing, thinned out after crop emergence, and weeded in time during crop growth. Red bean was harvested on September 13th, and maize and soybeans were har-vested on October 6. Wheat (variety Tangmai 6, Tangshan Academy of Agricultural Sciences) was sown on October 8, 2010, and harvested on June 22, 2011.
Experiment 2: identification of optimum ratio of rows of maize and soybean.
Experi-ment 2 was conducted to identify optimum ratio of rows of maize and soybean, as maizeǁ
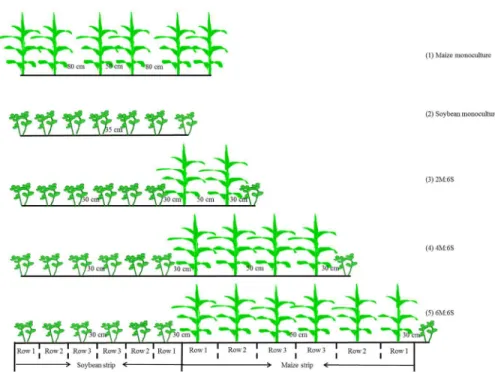
soy-bean was identified as the best intercropping system in Experiment 1. A randomized complete block design, which included five treatments with different planting patterns in three replicates, was used in summer, 2011. The treatments were: (i) monoculture of maize, (ii) monoculture of soybean, (iii) alternating two maize rows with six soybean rows (2M:6S), (iv) alternating four maize rows with six soybean rows (4M:6S), and (v) alternating six maize rows with six soybean
rows (6M:6S) (Fig 1). Detailed planting pattern of every treatment was shown inTable 2.
Maize and soybean were sown on June 24th, 2011, and harvested on October 6th, 2011. A
subse-quent winter wheat crop was sown on October 7th, 2011 with a 15 cm inter-row spacing, and it
was harvested on June 17th, 2012.
In both experiments, maize, winter wheat, soybean and red bean were supplied with 225,
225, 45 and 45 kg N ha-1in urea (46% N), respectively, and all crops were supplied with 33 kg
P ha-1in calcium superphosphate (12% P) and 62 kg K ha-1in potassium sulphate (52% K).
For maize and wheat, half of the N was incorporated into the top 20 cm soil as base fertilizers at sowing, and the rest half was applied during the jointing stage, which was 40 days after Table 2. Detailed planting pattern of every treatment in the two experiments.
Experiment/Crop Row spacing (cm)♣
Plant spacing (cm)
Width of strip (cm)
Spacing between two crop strips (cm)
Plot area (m2)
Crop density (plant ha-1)
Experiment 1
Maize monoculture 80, 50 25 - - 175 60,984
Soybean monoculture 35 20 - - 175 283,216
Red bean monoculture 30 20 - - 175 330,584
Maizeǁ
soybean
Maize 80, 50 25 180 20 225 52,866
Soybean 27 20 100 263,872
Maizeǁred bean
Maize 80, 50 25 180 20 225 52,866
Red bean
27 20 100 263,872
Experiment 2
Maize monoculture 80, 50 25 - - 70 60,984
Soybean monoculture 35 20 - - 70 283,216
2M:6S Maize 50 25 50 30 110 30,300
Soybean 30 20 180 229,200
4M:6S Maize 50 25 150 30 110 44,000
Soybean 30 20 180 165,200
6M:6S Maize 50 25 250 30 110 51,100
Soybean 30 20 180 129,500
♣Maize was sown with alternating wide (80 cm) and narrow (50 cm) inter-row spacing in Experiment 1 and maize monoculture in Experiment 2, while
intercropped maize in Experiment 2 was sown with equal row spacing (50 cm).
planting (DAP). All N for beans, and all P and K fertilizers for all crops were applied as basal fertilizers. Five flooding irrigations were applied to wheat, with one irrigation of 50 mm water at wheat growth stages of sowing, overwinter, erecting, booting and filling, respectively.
Sample collection and measurement
Before the start of the study in June 2010, soil was sampled randomly in the field by using a soil auger for every 20 cm soil depth until 200 cm deep, to determine basic physical and chemical properties of each soil layer. In Experiment 1, soil samples were collected from every crop strip with the same procedure as described above, both after harvest of summer crops and after
har-vest of winter wheat. In Experiment 2, soil samples (0–20 cm and 20–40 cm) were collected in
inter-row (Fig 1) during maize growth season, at maize pre-jointing stage (BBCH19, 26 DAP, the jointing stage was 40 days after planting), tasseling stage (BBCH51, 57 DAP), filling stage (BBCH73, 74 DAP) and ripe stage (BBCH89, 104 DAP), respectively. After harvest of wheat in 2012, soil samples were collected from each plot for every 20 cm depth until 100 cm deep, and the samples were taken separately under the previously established summer maize and soybean strips.
Soil water content was determined by oven-drying 20 grams of fresh soil at 105°C for 12 h
to a constant mass. Soil mineral N (NH4+-N and NO3--N) concentrations were determined
with a continuous flow analyzer (TRAACS 2000; Bran and Luebbe, Norderstedt, Germany),
after extracting 12 grams of fresh soil with 100 ml 0.01 M CaCl2[20]. Soil organic matter was
determined by the potassium dichromate method, total N by the automatic Kjeldahl method after wet digestion [25], and soil water pH by using a standard calomel electrode [26].
In Experiment 1, five plants of maize or bean were sampled from each crop strip after har-vest in summer. In Experiment 2, plant samples of maize and soybean were collected to deter-mine dry matter content at maize pre-jointing stage (26 DAP), tasseling stage (57 DAP) and Fig 1. Schematic diagram of different treatments.(1) Monoculture of maize, (2) Monoculture of soybean, (3) 2M:6S (two maize rows intercropping with six soybean rows), (4) 4M:6S (four maize rows intercropping with six soybean rows), and (5) 6M:6S (six maize rows intercropping with six soybean rows).
ripe stage (104 DAP), respectively. At each stage, 10 plants of each crop were sampled from
every row (Fig 1). Wheat plant samples within an area of 2 m2were taken separately for the
previously established maize or soybean strip. Stalks and grains of the crops were harvested separately at ripe stage. All the samples were oven-dried at 105°C for 30 min and then at 85°C until constant weights. Thereafter, dry plant samples were ground to determine total N
concen-trations by the automatic Kjeldahl method, after wet digestion of the samples with H2SO4and
H2O2[27].
Photosynthetic characteristics of maize were measured in each row using an infrared gas an-alyzer-based photosynthesis system (LI-6400, Li-Cor., Lincoln, NE, USA) at tasseling stage (57 DAP) and filling stage (74 DAP). The measurements took place at the middle of the ear leaf
during normal weather conditions with sunshine and no rain in summer, between 9:00–12:00
in the morning. Based on the literatures [28–30] and the actual circumstances, the conditions
supported were as follows: photosynthetic photon flux density of 1800μmol m-2s-1, CO2
con-centration of 400μmol mol-1, air temperature of 30°C and relative air humidity of 0% (0%
moisture from air to the leaf chamber).
Calculation and Statistical analysis
Land equivalent ratio (LER), which is often considered as an indicator of intercropping benefit [31], was calculated according to:
LER¼Yim
Ysm
þYis
Yss
ð1Þ
whereYim(kg ha-1) andYis(kg ha-1) are respective yields of intercropped maize and soybean
or red bean per ha intercropping area, andYsm(kg ha-1) andYss(kg ha-1) are yields of maize
and bean in monoculture treatments. If LER is greater than 1.00, there is a yield advantage by intercropping; otherwise there is no yield advantage.
Total N accumulated by the crop (Nacc, kg ha-1) was calculated according to:
Nacc¼X½MC ð2Þ
whereMis the amount of dry matter (kg ha-1) andCis the N concentration in the plant (%).
Economic benefit (E, USD ha-1) was calculated according to:
E¼YP LF FF SF MF ð3Þ
whereYis yield (kg ha-1),Pis grain price (USD ha-1),LFis labor fees (USD ha-1),FFis fertilizer
fees (USD ha-1),SFis seed costs (USD ha-1) andMFis machinery expenses (USD ha-1). USD is
U.S. dollar.
Nitrate-N accumulation in soil (R, kg ha-1) was calculated according to:
R¼TBC
10 ð4Þ
whereTis the thickness (cm) of a soil layer,Bis soil bulk density (g cm-3), andCis
concentra-tion of soil nitrate-N (mg kg-1).
Analysis of variance (ANOVA) was conducted using the SPSS19.0 software package and
Results
Screening of optimal intercropping system of maize with legume
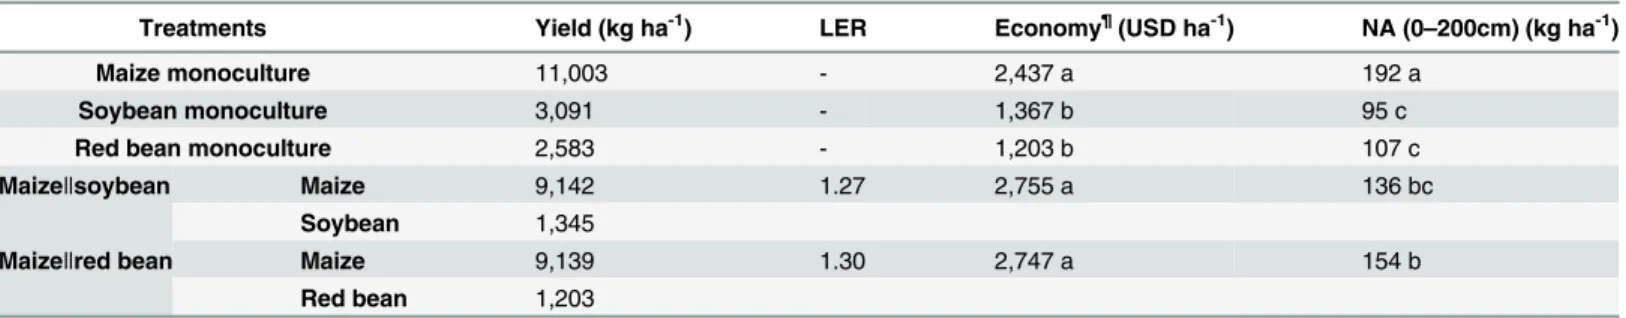
Compared to monoculture, both maizeǁsoybean and maizeǁred bean cropping systems had
in-tercropping advantages in yield and economy (i.e., promoted crop yields and farmers’income)
(Table 3). Both intercropping systems had a LER value greater than 1. Maizeǁsoybean had the
highest economic benefit among all the cropping systems, but it did not significantly differ
with that of maizeǁred bean. In addition, both maizeǁsoybean and maizeǁred bean cropping
systems significantly reduced soil (0–200 cm) nitrate-N accumulation compared to
monocul-ture of maize (P<0.05). Maizeǁsoybean had soil nitrate-N accumulation 56 kg ha-1lower than
monoculture of maize, and 18 kg ha-1lower than maizeǁred bean. In addition, compared to
monoculture of maize, both maizeǁsoybean and maizeǁred bean did not significantly affect
yield of subsequent wheat, but they reduced nitrate-N accumulation in soil (0–200 cm) after
harvest of subsequent wheat (Table 4). Considering all the aspects above, maizeǁsoybean
per-formed better than maizeǁred bean and all monocultures, and thus maizeǁsoybean was
investi-gated with further details.
Table 3. Crop yield, economic benefit, soil nitrate-N accumulation at 0–200 cm soil depth (NA) and land equivalent ratio (LER) in different crop
sys-tems at harvest in the summer of 2010 (Experiment 1).
Treatments Yield (kg ha-1) LER Economy¶(USD ha-1) NA (0–200cm) (kg ha-1)
Maize monoculture 11,003 - 2,437 a 192 a
Soybean monoculture 3,091 - 1,367 b 95 c
Red bean monoculture 2,583 - 1,203 b 107 c
Maizeǁsoybean Maize 9,142 1.27 2,755 a 136 bc
Soybean 1,345
Maizeǁred bean Maize 9,139 1.30 2,747 a 154 b
Red bean 1,203
Data were presented on a basis of per hectare monoculture/intercropping area
¶Cost: Machinery 46.44 USD ha-1, labor 216.7 USD ha-1, Maize seed 1.24 USD kg-1, soybean seed 1.86 USD kg-1, red bean seed 3.10 USD t-1, urea 325.08 USD t-1, calcium superphosphate 123.8 USD t-1, potassium sulfate 541.8 USD t-1; Procurement price: maize grain 0.28 USD kg-1, maize straw 0.003 USD kg-1, soybean grain 0.62 USD kg-1, red bean grain 0.70 USD kg-1.
Note: Different letters represented significant differences between means of replicates (n = 3) at the 0.05% level within a column.
doi:10.1371/journal.pone.0129245.t003
Table 4. Residual effect of different summer cropping systems on yield of winter wheat and soil ni-trate-N accumulation after harvest of wheat in Experiment 1.
Treatments in summer Yield of wheat (kg ha-1) Soil nitrate-N accumulation (0
–200cm) (kg ha-1)
Maize monoculture 7,633 a 260 a
Soybean monoculture 7,633 a 204 c
Red bean monoculture 7,633 a 201 c
Maizeǁsoybean 7,830 a 233 b
Maizeǁred bean 7,695 a 229 b
Note: Different letters represented significant differences between means of replicates (n = 3) at the 0.05% level within a column.
Effects of row ratios on agronomy and environmental benefits of
intercropping systems
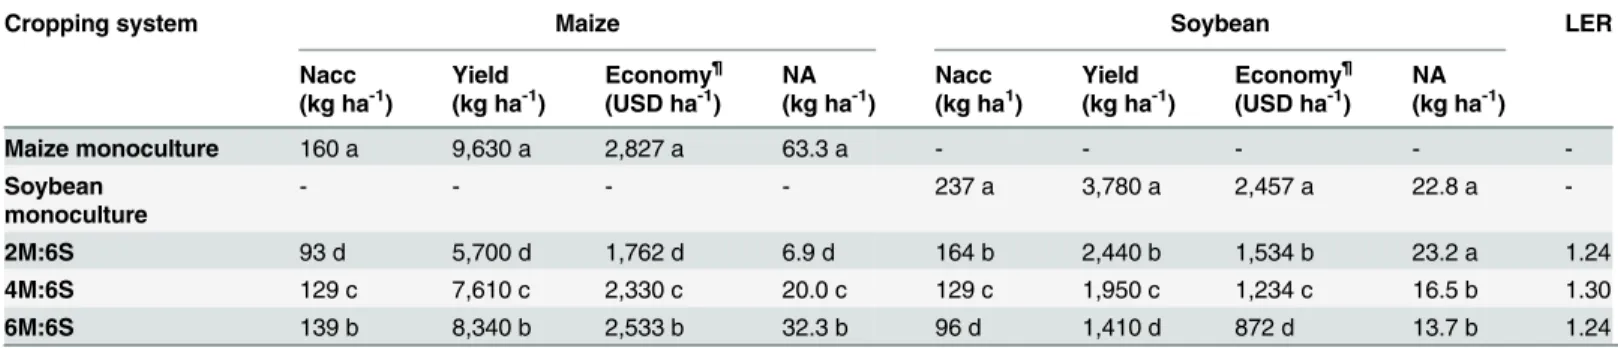
Overall effects of row ratios. Despite being applied with less N, intercropping
significant-ly increased crop yields, economic benefit and crop total N uptake (P<0.05), and reduced
ni-trate-N accumulation in soil at harvest, compared to crop monocultures on equivalent land areas. Specifically, intercropping increased maize yield (per hectare maize growing area) by
42.2–92.3%. Soybean yield was slightly decreased by 6.5% in 2M:6S and by 4.4% in 6M:6S, but
it was increased by 3.0% in 4M:6S. As a result, the LER values of the three intercropping
sys-tems were all greater than 1, and the land utilization rates in these syssys-tems were 24–30% higher
than the rates in the two monocultures (Table 5). 4M:6S had the best economic benefit, which was 26.0% higher than maize monoculture, 45.4% higher than soybean monoculture, 8% higher than 2M:6S, and 5% higher than 6M:6S. Amounts of total N accumulation in crops
were similar in 4M:6S (258 kg ha-1) and 2M:6S (257 kg ha-1), which were significantly higher
than those in the other treatments (P<0.05). Soil nitrate-N accumulation (0–40 cm) at harvest
was smaller at lower proportion of maize growing area. Compared to maize monoculture, in-tercropping significantly reduced soil N accumulation after crop harvest, by 46.6% in 6M:6S, 57.6% in 4M:6S and 65.1% in 2M:6S.
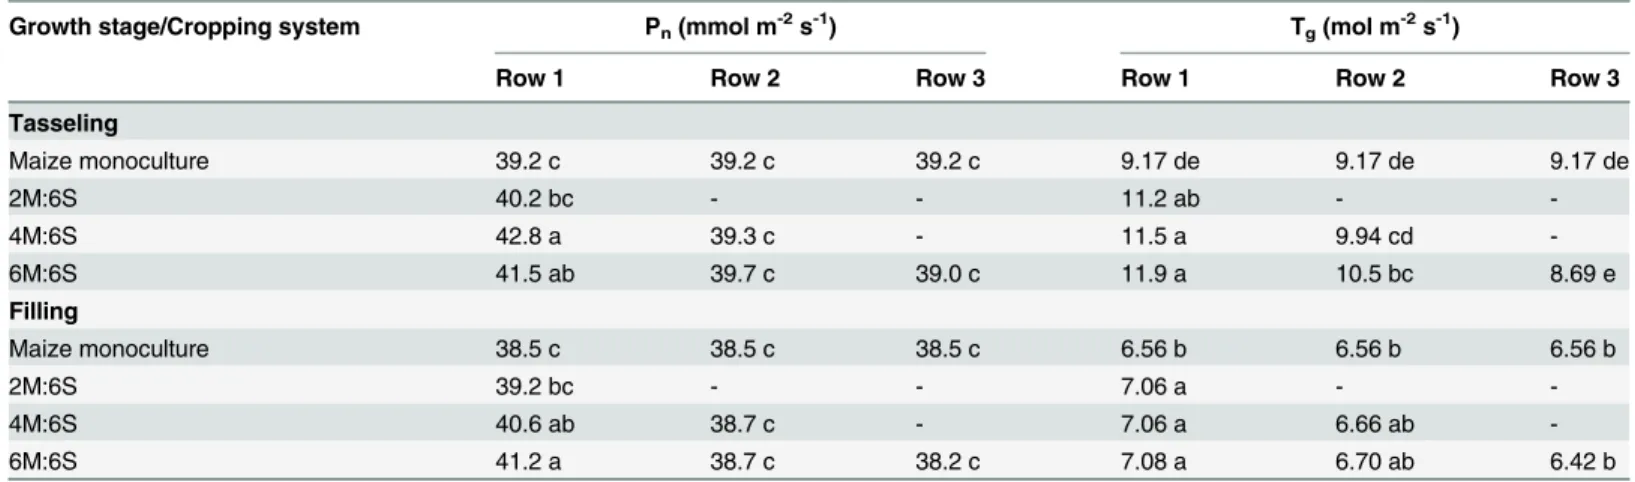
Photosynthetic characteristics of maize at different growth stages. Intercropping en-abled an efficient utilization of environmental resources. At maize tasseling and filling stages, photosynthetic gas-exchange parameters, including net photosynthetic rate (Pn) and transpira-tion rate (Tg), collectively showed a border row effect [32]. That is, values of photosynthetic characteristics were larger at a smaller distance to the border row within a maize strip (Table 6).
At both stages, the Pnof maize in row 1 of 4M:6S and 6M:6S were significantly (P<0.05) higher
than that in the inner-row in these treatments as well as that in maize monoculture. The Tgof
maize in row 1 did not significantly differ between intercropping systems, but they were all
sig-nificantly (P<0.05) higher than that in maize monoculture. Moreover, Tgof maize in the
inner-row in intercropping systems was also slightly higher than that in maize monoculture.
Uptake of N by crops at different growth stages. Intercropping systems did not reduce N concentrations in maize or soybean compared to monocultures (Table 7). At each growth
Table 5. Total N accumulation in crop (Nacc), crop yield, economy, soil nitrate-N accumulation at 0–40 cm soil depth (NA) and land equivalent ratio
(LER) in different cropping systems at harvest in the summer of 2011 (Experiment 2).
Cropping system Maize Soybean LER
Nacc (kg ha-1)
Yield (kg ha-1)
Economy¶ (USD ha-1)
NA (kg ha-1)
Nacc (kg ha1)
Yield (kg ha-1)
Economy¶ (USD ha-1)
NA (kg ha-1)
Maize monoculture 160 a 9,630 a 2,827 a 63.3 a - - - -
-Soybean monoculture
- - - - 237 a 3,780 a 2,457 a 22.8 a
-2M:6S 93 d 5,700 d 1,762 d 6.9 d 164 b 2,440 b 1,534 b 23.2 a 1.24
4M:6S 129 c 7,610 c 2,330 c 20.0 c 129 c 1,950 c 1,234 c 16.5 b 1.30
6M:6S 139 b 8,340 b 2,533 b 32.3 b 96 d 1,410 d 872 d 13.7 b 1.24
Data were presented on a basis of per hectare monoculture/intercropping area.
¶Cost: Machinery 46.44 USD ha-1, labor 216.7 USD ha-1, Maize seed 1.86 USD kg-1, soybean seed 1.86 USD kg-1, urea 371.5 USD t-1, calcium superphosphate 123.8 USD t-1, potassium sulfate 541.8 USD t-1; Procurement price: maize grain 0.34 USD kg-1, maize straw 0.003 USD kg-1, soybean grain 0.77 USD kg-1.
Note: Different letters represented significant differences between means of replicates (n = 3) at the 0.05% level within a column.
Table 6. Net photosynthetic rate (Pn) and transpiration rate (Tg) of maize at tasseling and filling stages under different cropping systems.
Growth stage/Cropping system Pn(mmol m-2s-1) Tg(mol m-2s-1)
Row 1 Row 2 Row 3 Row 1 Row 2 Row 3
Tasseling
Maize monoculture 39.2 c 39.2 c 39.2 c 9.17 de 9.17 de 9.17 de
2M:6S 40.2 bc - - 11.2 ab -
-4M:6S 42.8 a 39.3 c - 11.5 a 9.94 cd
-6M:6S 41.5 ab 39.7 c 39.0 c 11.9 a 10.5 bc 8.69 e
Filling
Maize monoculture 38.5 c 38.5 c 38.5 c 6.56 b 6.56 b 6.56 b
2M:6S 39.2 bc - - 7.06 a -
-4M:6S 40.6 ab 38.7 c - 7.06 a 6.66 ab
-6M:6S 41.2 a 38.7 c 38.2 c 7.08 a 6.70 ab 6.42 b
Note: Different letters represented significant (at the 0.05% level) differences between means of three replicates among all crop rows of different treatments at each growth stage.
doi:10.1371/journal.pone.0129245.t006
Table 7. Concentration (g kg-1) of N in maize and soybean at each growth stage under different cropping systems.
Growth stage/Cropping system Maize strip Soybean strip
Row 1 Row 2 Row 3 Row 1 Row 2 Row 3
Pre-jointing
Monoculture 29.5 b 29.5 b 29.5 b 29.7 e 29.7 e 29.7 e
2M:6S 32.9 a - - 38.1 b 40.9 a 37.8 b
4M:6S 28.4 b 31.1 ab - 37.6 b 28.8 e 34.7 c
6M:6S 29.9 ab 29.9 ab 30.42 ab 38.3 b 35.2 c 32.6 d
Tasseling
Monoculture 17.0 a 17.0 a 17.0 a 27.5 a 27.5 a 27.5 a
2M:6S 17.0 a - - 27.2 a 27.5 a 26.5 a
4M:6S 16.8 a 15.0 a - 26.9 a 25.6 a 26.9 a
6M:6S 14.8 a 16.3 a 15.5 a 27.2 a 28.0 a 27.1 a
Ripening-straw
Monoculture 7.78 ab 7.78 ab 7.78 ab 3.73 de 3.73 de 3.73 de
2M:6S 7.39 ab - - 4.25 ab 4.77 a 3.89 cde
4M:6S 8.10 a 7.19 b - 3.64 e 3.92 bcd 4.66 ab
6M:6S 7.56 ab 8.13 a 7.58 ab 4.22 ab 4.25 ab 4.42 ab
Ripening-grain
Monoculture 11.7 a 11.7 a 11.7 a 60.7 b 60.7 b 60.7 b
2M:6S 11.6 a - - 64.4 ab 65.5 ab 65.0 ab
4M:6S 12.5 a 12.5 a - 63.2 ab 62.3 ab 64.5 ab
6M:6S 11.7 a 11.8 a 12.2 a 66.5 a 65.7 ab 65.3 ab
Note: Different letters represented significant (at the 0.05% level) differences between means of three replicates among all crop rows of different treatments in one crop strip at each growth stage.
stage, N concentration of maize in all intercropping systems did not significantly differ from
that of maize monoculture (P<0.05), except that N concentration of maize in 2M:6S was
signif-icantly higher than that in maize monoculture at pre-jointing stage. The N concentration of
soybean monoculture was significantly lower than that of the intercropped soybean (P<0.05)
at the early growth stage of pre-jointing, but they did not differ at tasseling and ripening stages. At pre-jointing stage, the N concentration of the intercropped soybean descended from row 1 to row 3, while the concentration did not significantly differ between rows at tasseling and
rip-ening stages. At riprip-ening stage, the soybean straw had much lower N concentration (3.64–4.77
mg kg-1) than the grains (60.71–66.54 mg kg-1). For the entire growth period, intercropping
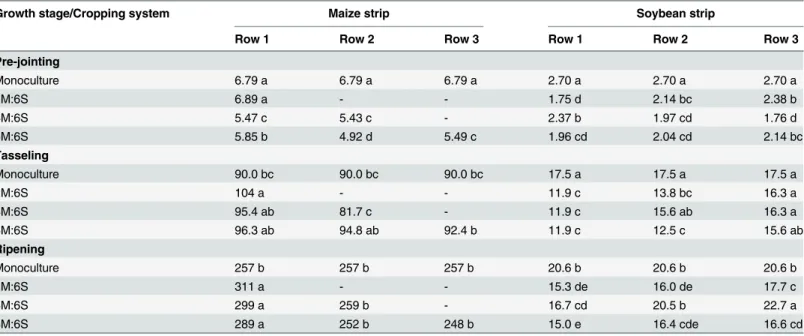
in-creased total N accumulation of the whole system compared to monocultures (Table 5). Crop biomass at different growth stages. Crop biomass per plant gradually increased from seeding to ripening stage (Table 8). At pre-jointing, biomass of intercropped maize and soybean (except maize row 1) in 2M:6S was significantly lower than biomass of monoculture
(P<0.05). 2M:6S and 6M:6S showed a negative border row effect on biomass per plant, but the
effect was positive in 4M:6S. Positive border row effect on maize biomass started to appear at tasseling stage (Table 8), when biomass per soybean plant in intercropping showed an advan-tage of inner rows and gradually increased from row 1 to row 3.
At ripening stage, row 1 of all intercropped maize had an obvious advantage and its biomass
per plant was significantly higher than that of monoculture of maize (P<0.05), but this was not
observed for the maize inner rows (row 2 and row 3). The biomass per intercropped soybean plant gradually increased from row 1 to row 3, but all biomass except in 4M:6S were
signifi-cantly lower than that of soybean monoculture (P<0.05). Overall, 4M:6S had an advantage in
row 2 and row 3 of the intercropped soybean compared with monoculture, but there was al-ways a disadvantage in 2M:6S and 6M:6S.
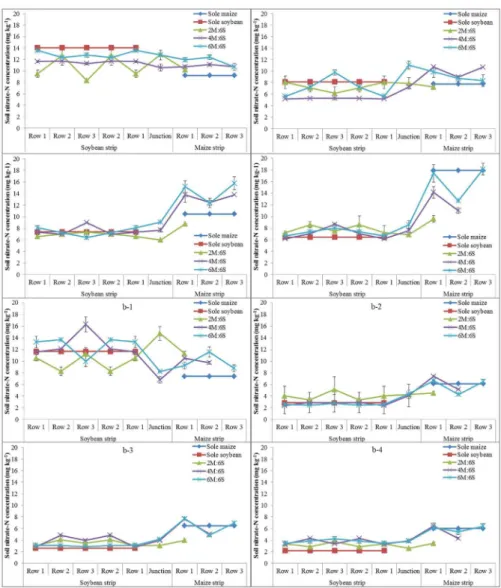
Soil nitrate-N concentration at different growth stages. Nitrate-N concentration in
top-soil (0–20 cm) was obviously higher than that in sub-soil (20–40 cm). In the soybean strip,
Table 8. Crop biomass (g plant-1) at each growth stage under different cropping systems.
Growth stage/Cropping system Maize strip Soybean strip
Row 1 Row 2 Row 3 Row 1 Row 2 Row 3
Pre-jointing
Monoculture 6.79 a 6.79 a 6.79 a 2.70 a 2.70 a 2.70 a
2M:6S 6.89 a - - 1.75 d 2.14 bc 2.38 b
4M:6S 5.47 c 5.43 c - 2.37 b 1.97 cd 1.76 d
6M:6S 5.85 b 4.92 d 5.49 c 1.96 cd 2.04 cd 2.14 bc
Tasseling
Monoculture 90.0 bc 90.0 bc 90.0 bc 17.5 a 17.5 a 17.5 a
2M:6S 104 a - - 11.9 c 13.8 bc 16.3 a
4M:6S 95.4 ab 81.7 c - 11.9 c 15.6 ab 16.3 a
6M:6S 96.3 ab 94.8 ab 92.4 b 11.9 c 12.5 c 15.6 ab
Ripening
Monoculture 257 b 257 b 257 b 20.6 b 20.6 b 20.6 b
2M:6S 311 a - - 15.3 de 16.0 de 17.7 c
4M:6S 299 a 259 b - 16.7 cd 20.5 b 22.7 a
6M:6S 289 a 252 b 248 b 15.0 e 16.4 cde 16.6 cd
Note: Different letters represented significant (at the 0.05% level) differences between means of three replicates among all crop rows of different treatments in one crop strip at each growth stage.
nitrate-N concentration in both soil layers gradually decreased from pre-jointing to ripening stage of soybean, while for maize the concentration decreased from pre-jointing to tasseling stage and increased after topdressing N until ripening stage (Fig 2). Before N topdressing for
maize, soil nitrate-N concentration (0–20 cm and 20–40 cm) in rows of maize monoculture
was significantly lower than that of all intercropping rows. After N topdressing, nitrate-N
con-centration at 0–20 cm soil depth of all maize rows gradually increased until harvest. In
particu-lar, the nitrate-N concentration in maize monoculture had a dramatic amplification until reaching the highest point at ripening stage. However, N topdressing did not substantially
af-fect soil N concentration at the depth of 20–40 cm (6.03–6.47 mg kg-1). Soil nitrate-N
concen-tration (0–20 cm and 20–40 cm) in rows of soybean monoculture gradually decreased until
reaching the lowest point at ripening stage compared to intercropped soybean. Except at pre-jointing stage, soil nitrate-N concentration in all soybean rows had a small variation, especially Fig 2. Spatial distribution of nitrate-N concentration (mg kg-1) of each cropping system at different soil depths and maize growth stages.(a) a soil depth of 0–20 cm: (a-1) pre-jointing stage, (a-2) tasseling stage, (a-3) filling stage and (a-4) ripening stage, and (b) a soil depth of 20–40 cm: 1) pre-jointing stage, (b-2) tasseling stage, (b-3) filling stage and (b-4) ripening stage. A row number is defined as inFig 1. Each data point presents mean of three replicates and an error bar indicated standard deviation.
at filling stage (6.41–8.98 mg kg-1in 0–20 cm and 2.62–4.84 mg kg-1in 20–40 cm) and ripening
stage (6.18–8.65 mg kg-1in 0–20 cm and 2.19–4.30 mg kg-1in 20–40 cm). Soil nitrate-N
con-centration in the junction row (between maize strip and soybean strip) also differed with inter-cropping systems, but with no clear trends. In the later period of crop growth especially after filling stage of maize, soil nitrate-N concentration in junction rows was higher than that of soy-bean row 1, but lower than that of maize row 1.
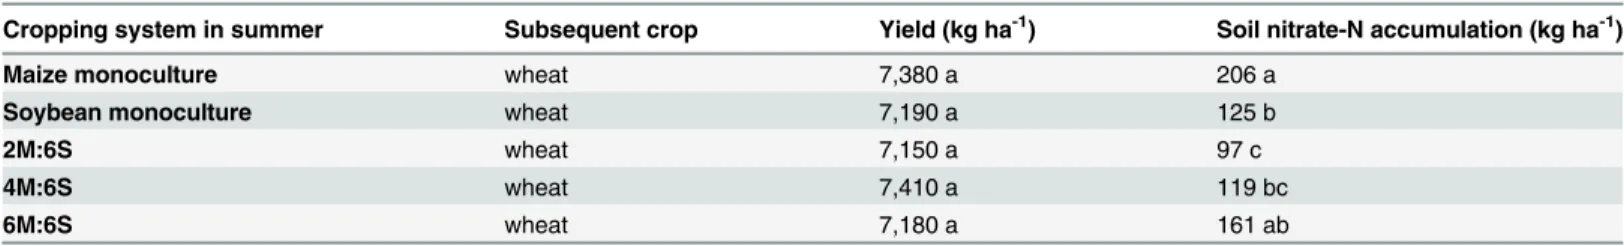
Yield of subsequent wheat and soil nitrate-N accumulation. Intercropping in summer did not significantly affect yield of winter wheat, but it significantly reduced soil nitrate-N
ac-cumulation (0–100 cm) after harvest of wheat, compared to monoculture of maize in summer
(Table 9). 4M:6S produced 12–263 kg ha-1higher wheat yields than the other four cropping
systems, which indicated that intercropping systems in summer could even slightly increase yield of the subsequent crop. Compared to maize monoculture, intercropping systems reduced
soil nitrate-N accumulation during wheat season by 21.9–51.7%.
Discussion
This study clearly demonstrated that intercropping systems presented advantage over maize monoculture. Intercropping system of maize with legumes reduced N application in the same planting area compared to maize monoculture, probably because of the enhanced biological N
fixation by legumes [6]. Both maizeǁsoybean and maizeǁred bean systems showed
intercrop-ping advantages in yield, economy, land utilization ratio and reducing soil nitrate-N accumula-tion, as well as better residual effect on the subsequent wheat crop. Previous studies had also reported beneficial effects of intercropping systems on yield, economy and the environment [6,33], which stresses the importance of using intercropping in sustainable agriculture to allevi-ate pressure in intensive farming systems with high inputs and outputs [14]. Soybean is more important than red bean in China, with more consumption and relying on import [34], and de-creasing planting area year by year [35]. Therefore, considering maize intercropping with soy-bean as the best cropping system in summer in the present study is reasonable and necessary.
In particular, the optimal intercropping system was strip intercropping of 4 maize rows with 6 soybean rows (4M:6S), which had positive effects on yield, economy and environment in this study. Its LER value, crop N uptake, yields of both maize and soybean and economic benefit were even greater than those of 2M:6S and 6M:6S. This confirmed the previous finding that row ratio can influence intercropping efficiency [36,37]. In addition, 4M:6S significantly reduced soil nitrate-N accumulation compared to maize monoculture after harvest of summer crops. The LER values greater than 1 in all intercropping systems in the present study indicated high land-use efficiency compared to monoculture of maize or soybean [36].
Advantage of intercropping is probably derived from high light use efficiency above-ground and nutrients (e.g., N) below-ground [22]. Ability of maize to capture sunlight was enhanced at Table 9. Residual effect of different summer cropping systems on yield of winter wheat and soil nitrate-N accumulation (0–100 cm) after harvest of
wheat in Experiment 2.
Cropping system in summer Subsequent crop Yield (kg ha-1) Soil nitrate-N accumulation (kg ha-1)
Maize monoculture wheat 7,380 a 206 a
Soybean monoculture wheat 7,190 a 125 b
2M:6S wheat 7,150 a 97 c
4M:6S wheat 7,410 a 119 bc
6M:6S wheat 7,180 a 161 ab
Note: Different letters represented significant differences between means of replicates (n = 3) at the 0.05% level within a column.
border rows, while there was small difference in photosynthetic rate and transpiration rate be-tween inner-rows within a strip. The best light use efficiency was obtained in 4M:6S with nar-row strips and a high proportion of border nar-rows. Enhanced photosynthesis existed only in the two side rows, which indicated that four maize rows consisted of the optimal maize strip for light utilization. As a result, maize yield of intercropping systems was linearly correlated with photosynthetic efficiency, and light transmission was affected by between-row spacing, which supported previous findings by Prasad and Brook [38]. Intercropped soybean probably facili-tated growth of maize by transferring the N fixed [39]. However, more N fertilization would in-hibit N fixation of legumes [40], thus N was applied as basal fertilizer to both maize and soybean but only topdressed for maize in this study. Results showed that intercropping could provide enough nitrate for crops during the whole growth period. Top-soil was the main source of nitrate for crops, with significantly higher nitrate concentration than that of subsoil. Soil ni-trate had different patterns in different intercropping systems from seeding to ripening stage. Soil nitrate-N in maize monoculture gradually increased to the highest value at ripening stage compared to intercropped maize, while soil nitrate-N in soybean monoculture gradually de-creased to the lowest value at ripening stage compared to intercropped soybean. Elsewhere, Ossom et al. (2009) also observed significant differences in soil nitrate-N between different in-tercropping systems. Our results showed that soil nitrate-N accumulation increased gradually with the increasing maize area, probably partly because the N fertilizer rate for per unit area of maize was higher than that for soybean after topdressing.
Intercropping advantage was most obvious in 4M:6S, but the advantage did not emerge at the beginning of growth. At the early stage, biomass per plant of most intercropped crops was smaller than the corresponding monoculture, probably because maize suffered border row ef-fect and soybean growth was also negatively afef-fected [32]. In the middle stage with two inter-cropping crops grown simultaneously, different inter-cropping systems probably had different extents of interactions between interspecific competition and facilitation [13], which led to dif-ferent growth rhythm. Intercropping advantage of maize started to emerge at tasseling and lasted until ripening stage, by showing a border row effect. In contrast, intercropping advantage did not appear in soybean during the entire growth period, except in 4M:6S which had a slight-ly increased soybean yield at ripening stage. A previous study showed that intercropping in-creased N concentration in junction crops [41], but this was not observed after maize tasseling stage in our study. Thus, the increase in total N accumulation of crops in intercropping systems was mainly because intercropping promoted biomass production. Our finding that accumula-tion of N by crops in intercropping systems was higher than that in maize monoculture was consistent with the conclusion of Li et al. [20], but it was contradict with Zhang et al. [42] who observed a higher amount of N accumulation in monoculture than intercropping.
An optimal cropping system should aim at having a positive residual effect and increasing or at least not reducing yield of a subsequent crop. A promoted yield production of a subsequent crop by intercropping systems was observed in some studies [43,44], but not in others [45]. In the present study, yields of wheat following 4M:6S was the highest among all the treatments and
its soil (0–100 cm) nitrate-N accumulation was significantly lower than that following maize
monoculture. This provides additional proof of advantage existing in 4M:6S intercropping.
Conclusions
Compared to conventional monoculture of maize, both maizeǁsoybean and maizeǁred bean
had significant advantage in yield, economy, land utilization ratio and reducing soil nitrate-N accumulation, as well as better residual effect on the subsequent wheat crop. In particular,
system in this study. Intercropping systems could reduce N fertilizer use and increase relative biomass of intercropped maize, as a result of high photosynthetic efficiency of border rows and sufficient nitrate supply during symbiotic period. Noticeably, intercropping advantage was not inherent but began to emerge at tasseling stage after N topdressing for maize. 4M:6S was the best intercropping system in this study, as it had the largest LER, crop total N accumulation and economic benefit. In addition, compared to maize monoculture, 4M:6S significantly re-duced nitrate-N accumulation in the soil after harvest of both summer crops and winter wheat, and it even slightly increased wheat yield. The most important advantage of 4M:6S was to in-crease biomass of intercropped maize and soybean, which further led to the inin-crease of total N accumulation by crops as well as economic benefit. In conclusion, alternating four maize rows with six soybean rows is the optimum row ratio in maize || soybean system, though this needs to be further confirmed by pluri-annual trials.
Author Contributions
Conceived and designed the experiments: YTZ JZZ TZR. Performed the experiments: YTZ HBL SL. Analyzed the data: JL JZZ LMZ. Contributed reagents/materials/analysis tools: HYW QLL CBY. Wrote the paper: YTZ JZZ TZR.
References
1. Zhang F, Shen J, Li L, Liu X (2004) An overview of rhizosphere processes related with plant nutrition in major cropping systems in China. Plant and Soil 260: 89–99.
2. Ju XT, Kou CL, Zhang FS, Christie P (2006) Nitrogen balance and groundwater nitrate contamination: Comparison among three intensive cropping systems on the North China Plain. Environmental Pollu-tion 143: 117–125. PMID:16364521
3. Zhang YY, Liu JF, Mu YJ, Xu Z, Pei SW, Lun XX, et al. (2012) Nitrous oxide emissions from a maize field during two consecutive growing seasons in the North China Plain. Journal of Environmental Sci-ences-China 24: 160–168. PMID:22783628
4. Blumenberg M, Berndmeyer C, Moros M, Muschalla M, Schmale O, Thiel V (2013) Bacteriohopanepo-lyols record stratification, nitrogen fixation and other biogeochemical perturbations in Holocene sedi-ments of the central Baltic Sea. Biogeosciences 10: 2725–2735.
5. Ju XT, Xing GX, Chen XP, Zhang SL, Zhang LJ, Liu XJ, et al. (2009) Reducing environmental risk by improving N management in intensive Chinese agricultural systems. Proceedings of the National Acad-emy of Sciences of the United States of America 106: 3041–3046. doi:10.1073/pnas.0813417106
PMID:19223587
6. Wu KX, Wu BZ (2014) Potential environmental benefits of intercropping annual with leguminous peren-nial crops in Chinese agriculture. Agriculture Ecosystems & Environment 188: 147–149.
7. Midega CAO, Salifu D, Bruce TJ, Pittchar J, Pickett JA, Khan ZR (2014) Cumulative effects and eco-nomic benefits of intercropping maize with food legumes on Striga hermonthica infestation. Field Crops Research 155: 144–152.
8. Xia HY, Wang ZG, Zhao JH, Sun JH, Bao XG, Christie P, et al. (2013) Contribution of interspecific inter-actions and phosphorus application to sustainable and productive intercropping systems. Field Crops Research 154: 53–64. doi:10.1016/j.jconhyd.2013.07.007PMID:24090736
9. Thierfelder C, Cheesman S, Rusinamhodzi L (2012) A comparative analysis of conservation agriculture systems: Benefits and challenges of rotations and intercropping in Zimbabwe. Field Crops Research 137: 237–250. doi:10.1039/c1an15719aPMID:22034621
10. Caviglia OP, Sadras VO, Andrade FH (2011) Yield and Quality of Wheat and Soybean in Sole- and Double-Cropping. Agronomy Journal 103: 1081–1089.
11. Zhang L, Spiertz JHJ, Zhang S, Li B, Werf W (2007) Nitrogen economy in relay intercropping systems of wheat and cotton. Plant and Soil 303: 55–68.
12. Wu KX, Fullen MA, An TX, Fan ZW, Zhou F, Xue GF, et al. (2012) Above- and below-ground interspe-cific interaction in intercropped maize and potato: A field study using the 'target' technique. Field Crops Research 139: 63–70.
14. Li Q-Z, Sun J-H, Wei X-J, Christie P, Zhang F-S, Li L (2010) Overyielding and interspecific interactions mediated by nitrogen fertilization in strip intercropping of maize with faba bean, wheat and barley. Plant and Soil 339: 147–161.
15. Zhang FS, Li L (2003) Using competitive and facilitative interactions in intercropping systems enhances crop productivity and nutrient-use efficiency. Plant and Soil 248: 305–312.
16. Betencourt E, Duputel M, Colomb B, Desclaux D, Hinsinger P (2012) Intercropping promotes the ability of durum wheat and chickpea to increase rhizosphere phosphorus availability in a low P soil. Soil Biolo-gy & Biochemistry 46: 181–190.
17. Zuo YM, Zhang FS (2008) Effect of peanut mixed cropping with gramineous species on micronutrient concentrations and iron chlorosis of peanut plants grown in a calcareous soil. Plant and Soil 306: 23–36. 18. Lesoing GW, Francis CA (1999) Strip intercropping effects on yield and yield components of corn, grain
sorghum, and soybean. Agronomy Journal 91: 807–813.
19. Paltridge NG, Coventry DR, Tao J, Heath TJ, Tashi N (2014) Intensifying Grain and Fodder Production in Tibet by Using Cereal-Forage Intercrops. Agronomy Journal 106: 337–342. doi:10.1111/vox.12113 PMID:24330192
20. Li CJ, Li YY, Yu CB, Sun JH, Christie P, An M, et al. (2011) Crop nitrogen use and soil mineral nitrogen accumulation under different crop combinations and patterns of strip intercropping in northwest China. Plant and Soil 342: 221–231.
21. Mao LL, Zhang LZ, Zhao XH, Liu SD, van der Werf W, Zhang SP, et al. (2014) Crop growth, light utiliza-tion and yield of relay intercropped cotton as affected by plant density and a plant growth regulator. Field Crops Research 155: 67–76.
22. Lv Y, Francis C, Wu PT, Chen XL, Zhao XN (2014) Maize-Soybean Intercropping Interactions Above and Below Ground. Crop Science 54: 914–922.
23. Jannoura R, Joergensen RG, Bruns C (2014) Organic fertilizer effects on growth, crop yield, and soil microbial biomass indices in sole and intercropped peas and oats under organic farming conditions. Eu-ropean Journal of Agronomy 52: 259–270.
24. Li CJ, Li YY, Yu CB, Sun JH, Christie P, An M, et al. (2011) Crop nitrogen use and soil mineral nitrogen accumulation under different crop combinations and patterns of strip intercropping in northwest China. Plant and Soil 342: 221–231.
25. Perez DV, de Alcantara S, Arruda RJ, Meneghelli NDA (2001) Comparing two methods for soil carbon and nitrogen determination using selected Brazilian soils. Communications in Soil Science and Plant Analysis 32: 295–309.
26. Pietsch D, Mabit L (2012) Terrace soils in the Yemen Highlands: Using physical, chemical and radio-metric data to assess their suitability for agriculture and their vulnerability to degradation. Geoderma 185: 48–60.
27. Lithourgidis AS, Vlachostergios DN, Dordas CA, Damalas CA (2011) Dry matter yield, nitrogen content, and competition in pea-cereal intercropping systems. European Journal of Agronomy 34: 287–294. 28. Ma KF, Song YP, Jiang XB, Zhang ZY, Li BL, Zhang DQ (2012) Photosynthetic response to genome
methylation affects the growth of Chinese white poplar. Tree Genetics & Genomes 8: 1407–1421. 29. Liu TD, Song FB (2012) Maize photosynthesis and microclimate within the canopies at grain-filling
stage in response to narrow-wide row planting patterns. Photosynthetica 50: 215–222.
30. Fan YZ, Zhong ZM, Zhang XZ (2011) A comparative analysis of photosynthetic characteristics of hul-less barley at two altitudes on the Tibetan Plateau. Photosynthetica 49: 112–118.
31. Tariah N, Wahua T (1985) Effects of component populations on yields and land equivalent ratios of in-tercropped maize and cowpea. Field Crops Research 12: 81–89.
32. Li L, Sun JH, Zhang FS, Li XL, Rengel Z, Yang SC (2001) Wheat/maize or wheat/soybean strip inter-cropping II. Recovery or compensation of maize and soybean after wheat harvesting. Field Crops Re-search 71: 173–181.
33. Qin AZ, Huang GB, Chai Q, Yu AZ, Huang P (2013) Grain yield and soil respiratory response to inter-cropping systems on arid land. Field Crops Research 144: 1–10.
34. Chen W, Marchant MA, Muhammad A (2012) China's soybean product imports: an analysis of price ef-fects using a production system approach. China Agricultural Economic Review 4: 499–513.
35. Li YH, Guan RX, Liu ZX, Ma YS, Wang LX, Li LH, et al. (2008) Genetic structure and diversity of cultivat-ed soybean (Glycine max (L.) Merr.) landraces in China. Theoretical and Applicultivat-ed Genetics 117: 857– 871. doi:10.1007/s00122-008-0825-0PMID:18587557
37. Neugschwandtner RW, Kaul HP (2014) Sowing ratio and N fertilization affect yield and yield compo-nents of oat and pea in intercrops. Field Crops Research 155: 159–163.
38. Prasad RB, Brook RM (2005) Effect of varying maize densities on intercropped maize and soybean in Nepal. Experimental Agriculture 41: 365–382.
39. Li YY, Yu CB, Cheng X, Li CJ, Sun JH, Zhang FS, et al. (2009) Intercropping alleviates the inhibitory ef-fect of N fertilization on nodulation and symbiotic N-2 fixation of faba bean. Plant and Soil 323: 295– 308.
40. Fan F, Zhang F, Song Y, Sun J, Bao X, Guo T, et al. (2006) Nitrogen Fixation of Faba Bean (Vicia faba L.) Interacting with a Non-legume in Two Contrasting Intercropping Systems. Plant and Soil 283: 275– 286.
41. Li L, Sun JH, Zhang FS, Li XL, Yang SC, Rengel Z (2001) Wheat/maize or wheat/soybean strip inter-cropping I. Yield advantage and interspecific interactions on nutrients. Field Crops Research 71: 123– 137.
42. Zhang L, Spiertz JHJ, Zhang S, Li B, van der Werf W (2008) Nitrogen economy in relay intercropping systems of wheat and cotton. Plant and Soil 303: 55–68.
43. Olasantan FO (1998) Effects of preceding maize (Zea mays) and cowpea (Vigna unguiculata) in sole cropping and intercropping on growth, yield and nitrogen requirement of okra (Abelmoschus esculen-tus). Journal of Agricultural Science 131: 293–298.
44. Bergkvist G, Stenberg M, Wetterlind J, Bath B, Elfstrand S (2011) Clover cover crops under-sown in winter wheat increase yield of subsequent spring barley-Effect of N dose and companion grass. Field Crops Research 120: 292–298.