Rational Phosphorus Application Facilitates
the Sustainability of the Wheat/Maize/
Soybean Relay Strip Intercropping System
Yuanxue Chen1☯
*, Tao Zhou1☯, Chaochun Zhang2☯, Ke Wang1, Jing Liu1, Junyu Lu3,
Kaiwei Xu1*
1Department of Plant Nutrition and Microbiology, College of Resource Science, Sichuan Agricultural University, Chengdu, China,2Department of Plant Nutrition, College of Resource and Environmental Sciences, China Agricultural University, Beijing, China,3Ya’an Agricultural Bureau, Ya’an, China
☯These authors contributed equally to this work. *[email protected](YXC);[email protected](KWX)
Abstract
Wheat (Triticum aestivumL.)/maize (Zea maysL.)/soybean (Glycine maxL.) relay strip intercropping (W/M/S) system is commonly used by the smallholders in the Southwest of China. However, little known is how to manage phosphorus (P) to enhance P use efficiency of the W/M/S system and to mitigate P leaching that is a major source of pollution. Field experiments were carried out in 2011, 2012, and 2013 to test the impact of five P application rates on yield and P use efficiency of the W/M/S system. The study measured grain yield, shoot P uptake, apparent P recovery efficiency (PRE) and soil P content. A linear-plateau model was used to determine the critical P rate that maximizes gains in the indexes of sys-tem productivity. The results show that increase in P application rates aggrandized shoot P uptake and crops yields at threshold rates of 70 and 71.5 kg P ha-1respectively. With P application rates increasing, the W/M/S system decreased the PRE from 35.9% to 12.3% averaged over the three years. A rational P application rate, 72 kg P ha-1, or an appropriate soil Olsen-P level, 19.1 mg kg-1, drives the W/M/S system to maximize total grain yield while minimizing P surplus, as a result of the PRE up to 28.0%. We conclude that rational P appli-cation is an important approach for relay intercropping to produce high yield while mitigating P pollution and the rational P application-based integrated P fertilizer management is vital for sustainable intensification of agriculture in the Southwest of China.
Introduction
Food security, resource saving and environmental safety are focuses of globally many
govern-ments’attention, especially Chinese government. During the period 1960 to 2008, the total
grain production of China increased 3.4 fold from 110 to 483 million tons [1], but P fertilizer
input increased 91 fold during the same period [2]. Grain production greatly increased
because of this substantial P fertilizer input, but excessive P use by farmers led to low P use OPEN ACCESS
Citation:Chen Y, Zhou T, Zhang C, Wang K, Liu J, Lu J, et al. (2015) Rational Phosphorus Application Facilitates the Sustainability of the Wheat/Maize/ Soybean Relay Strip Intercropping System. PLoS ONE 10(11): e0141725. doi:10.1371/journal. pone.0141725
Editor:Wenju Liang, Chinese Academy of Sciences, CHINA
Received:February 13, 2015
Accepted:October 12, 2015
Published:November 5, 2015
Copyright:© 2015 Chen et al. This is an open access article distributed under the terms of the
Creative Commons Attribution License, which permits unrestricted use, distribution, and reproduction in any medium, provided the original author and source are credited.
Data Availability Statement:All relevant data are within the paper and its Supporting Information files.
Funding:This work was supported by the National Natural Science Foundation of China (31210103906) and the National Maize Production System in China (CARS-02-24).
efficiency, high environmental risk and P accumulation in soils which occurred in most
regions of China [3–4]. In the North China Plain, a major area for intensive crop production,
the annual net P input was 53 kg ha-1[5]. In China, the total net P input during the period
from 1980 to 2007 was 242 kg ha-1, causing soil Olsen-P increase from 7.4 to 24.7 mg kg-1[6]
while the P recovery efficiency (PRE) is currently only 15–20% [7–8]. Zhong [9] considered
20 mg kg-1to be the Olsen-P threshold for optimal plant growth and 40 mg kg-1to be the
criti-cal level for having risk of P leaching in many Chinese soil types. However, about 9.3% of
Chi-na’s arable land exceeded 40 mg kg-1of Olsen-P in soil [6] and about 60% of inland lakes
showed eutrophication, and 67% of the P source resulting in water pollution was derived from
agriculture [10].
Many studies report that interspecific facilitation results in overyielding of intercropping relative to monocultures, and also increase resource (solar, water and nutrients) use
effi-ciency [11–13]. In the Southwest China, one of the most densely populated agricultural
regions, annual planting systems include rotation and intercropping [14], and the dominant
cropping system is wheat/maize/soybean (W/M/S) relay strip intercropping. In this system, wheat and soybean are rotated as a double crop in the same strip, where wheat is planted and harvested first, and then soybean is planted. The fertilizer residue remained in the soil after wheat harvest can be utilized by the subsequent soybean. The wheat-soybean double crop strip is relay intercropped with maize grown in a different strip. Interspecific interactions, such as facilitation and competition, occur primarily between the different strips, so between wheat and maize, and then between soybean and maize. Most studies on the W/M/S system
examined the impacts of different variety combinations [15] and nitrogen (N) application
[16–17] on productivity. However, as yet no work has focused on P fertilizer management
considering both soil P status and cropping system’s annual productivity. Rational P
man-agement to reduce P leaching is vital in the Southwest of China as this area locates the upstream of the Yangtze River and the arable field on the hilly landscape is easily eroded by
rainfall [14].
The scientific problem of the current study is what P application rate is rational to produce high grain yield of wheat, maize, soybean and the W/M/S system, and to achieve high PRE and stable soil P level in the Southwest of China. A three-year field experiment was conducted to test the hypothesis that a rational P application in the W/M/S system maximizes productivity, enhances PRE, and generates a net balance between P input and output.
Materials and Methods
Site description
The field experiments were conducted in 2011, 2012 and 2013 at the Ya’an Experimental
Sta-tion (29°580N, 102°580E) with an altitude of 600 m above sea level, Sichuan Province, China.
Annual mean temperature is 15.4°C with a maximum and minimum temperature of 25.4°C and 6.1°C respectively. The frost-free period is 294 days, annual precipitation is 1500 mm and potential evaporation is 838 mm. Annual sunshine is 1019 hours and total solar radiation
aver-ages 3,750 MJ m-2yr-1. The monthly average temperature and rainfall values during the current
experimental period showed that generally the temperature and rainfall are the lowest in
Janu-ary and highest in August (Fig 1). The experimental soil is classified as a Purple soil (Luvic
Xer-osols, FAO classification). At the start of the study the soil pH (water) was 6.2, organic matter
content 32.1 g kg-1, total N 2.10 g kg-1, available N 112 mg kg-1, Olsen-P 13.2 mg kg-1,
exchangeable K 71 mg kg-1, and Cation Exchange Capacity 21.5 cmol kg-1of dry soil in the top
20 cm soil layer. The proportion of soil particles and bulk density [18] in the soil profile are
Experiment design and crop management
The field experiment was designed as a randomized block with five P treatment levels and four replicates (blocks) over three years in the same location. Every block consisted of five plots
measuring 4 × 9 m2each in which wheat (Triticum aestivumL. cv. Chuanmai No. 37), maize
(Zea maysL. cv. Chuandan No. 418) and soybean (Glycine maxL. cv. Gongxuan No.1) were
cultivated to make the wheat/maize/soybean (W/M/S) strip relay intercropping system (S1
Fig). Each plot included two duplicates of one planting unit which was consisted of a 1-m wide
wheat-soybean strip and an identical width maize strip. Each double crops strip had four rows of wheat followed by two rows of soybean after wheat was harvested, and each maize strip
included two rows of maize (Fig 2). Wheat was sown in rows at spacing of 25 cm between
rows. Two maize seedlings were transplanted per hole at a spacing of 40 cm between holes and Fig 1. Monthly average rainfall (mm) and temperature (°C) at the experimental spot in 2011, 2012 and 2013 and planting/harvest times of the three crops during growth period.(1) Shading indicates that the crops are growing in the field; (2) Wheat intercropped with maize has a co-growth period of almost 45 days; (3) Maize intercropped with soybean has a co-growth period of almost 55 days.
doi:10.1371/journal.pone.0141725.g001
Table 1. Particle size distribution and bulk density of the experimental soil change with soil depth.
Soil layer (cm) Proportions (%) of soil particles Texture (FAO classification) Bulk density (g cm-3)
>2.0 mm 2.0–0.02 mm 0.02–0.002 mm <0.002 mm
0–20 0 56.0 26.0 18.0 Sandy clay loam 1.48
20–40 0 52.0 24.0 24.0 Clay loam 1.53
40–60 0 46.0 30.0 24.0 Clay loam 1.39
60–80 0 46.0 28.0 26.0 Loamy clay 1.39
80–100 0 46.0 28.0 26.0 Loamy clay 1.39
50 cm between rows. Soybean was directly sown after wheat harvested without soil tillage at spacing of 35 cm between plants and 40 cm between rows. The space was 25 cm between wheat
and maize and 55 cm between maize and soybean (Fig 2). Density of intercropped wheat was
about 240 plants m-2, maize 5 plants m-2, soybean 5.7 plants m-2. Wheat was sown on 11th
November in 2010, 11thNovember in 2011, and 10thNovember in 2012 and harvested on 25th
May in 2011, 30thMay in 2012, and 11thMay in 2013 respectively. Maize was transplanted on
16thApril in 2011, 15thApril in 2012, and 7thApril in 2013 and harvested on 10thAugust in
2011, 6thAugust in 2012, and 6thAugust in 2013 respectively. Soybean was sown on 15thJune
in 2011, 14thJune in 2012, and 12thJune in 2013 and harvested on 27thOctober in 2011, 30th
October in 2012, and 5thNovember in 2013 respectively. The coexisting periods of wheat with
maize, and maize with soybean were approximately 45 days and 55 days respectively (Fig 1).
With regard to soil tillage, before the experiment of annually W/M/S system i.e. before wheat sowing or after soybean harvested every year, the soil of whole experiment including both wheat-soybean strip and maize strip were identically turned over to 20 cm in depth and then smashed and plattened all by hand. During the experiment of annually W/M/S system there is no soil tillage.
The P rates marked as P0, P1, P2, P3, P4, for wheat were 0, 20, 40, 60 and 80 kg P ha-1and the
rates for maize were 0, 16, 32, 48 and 64 kg P ha-1applied as triple superphosphate. The total N
application rate for wheat and maize were 120 kg N ha-1and 225 kg N ha-1as urea respectively.
Fig 2. Diagram showing the arrangement of wheat intercropped with maize (A) and maize intercropped with soybean (B) in the field plot.
The K application rate for wheat and maize were 75 kg K ha-1and 87 kg K ha-1respectively as potassium chloride. Soybean as the crop following wheat had no fertilizer input while utilizing
the residual nutrients of fertilizers left by wheat (Table 2). All of the P and K fertilizers were
applied as basal fertilizer before wheat or maize sowing, but N fertilizer was split to a basal fertili-zation and two topdressings which were applied to wheat at the tillering stage and the stem elon-gation stage, and applied to maize at the stem elonelon-gation stage and the tasseling stage. The proportions of basal fertilizer and two topdressings were 40-30-30 in the percentage of the total N fertilizer regarding wheat and 30-30-40 regarding maize. No organic manure was applied. During the growth period all the plots were well irrigated and weeded manually or by chemical control.
Plant sampling and analysis
Shoot biomass, including stem, leaves, and grain, of wheat, maize, and soybean were measured
at maturity. Five plants of maize, 10 plants of soybean and 0.4 ×1.0 m2of wheat were sampled
from the middle strip of each plot. The samples were oven dried at 70°C and then ground for
further chemical measurements. The samples were wet-digested with concentrated H2SO4and
H2O2(30%), and then N content was measured with the micro-Kjeldahl procedure, and P
determined by the vanadomolybdate method [19]. Shoot P uptake was calculated by
multiply-ing P concentration with the shoot biomass. Grain yield of the three crops came from harvest-ing the remainharvest-ing parts of the plot after shoot samplharvest-ing.
Soil sampling and analysis
In 2010 before crops were planted, soil samples were taken with a soil cores to a depth of 1 m
and then sliced to 0–20 cm, 20–40 cm, 40–60 cm, 60–80 cm and 80–100 cm layers. The soil
samples from all layers were analyzed for particle size distribution and bulk density. The 0–20
cm soil subsamples were analyzed for their physiochemical properties, including pH, organic
matter, total N, available N, Olsen-P, exchangeable K and cation exchange capacity [20]. At
harvest of maize and soybean, soil samples from each plot were collected from the 0–20 cm
layer in 2011 and 2012, but in 2013 at harvest of maize and soybean one-meter deep soil cores
were taken from each plot and similarly sliced to 0–20 cm, 20–40 cm, 40–60 cm, 60–80 cm,
and 80–100 cm layers. Two subsamples per layer from each plot were taken and mixed
uni-formly to give one pooled sample. Soil samples were air-dried and passed through a 2.0 mm
mesh sieve. A 2.5 g soil sample was shaken with 50 ml of 0.5 mol L-1NaHCO3for 30 minutes
at 25°C, and after the suspension was filtered, the P concentration of the filtrate was
deter-mined using the molybdate ascorbic acid method [20]
Calculations
The PRE is defined as percentage recovery of fertilizer P [21] and has been generally accepted
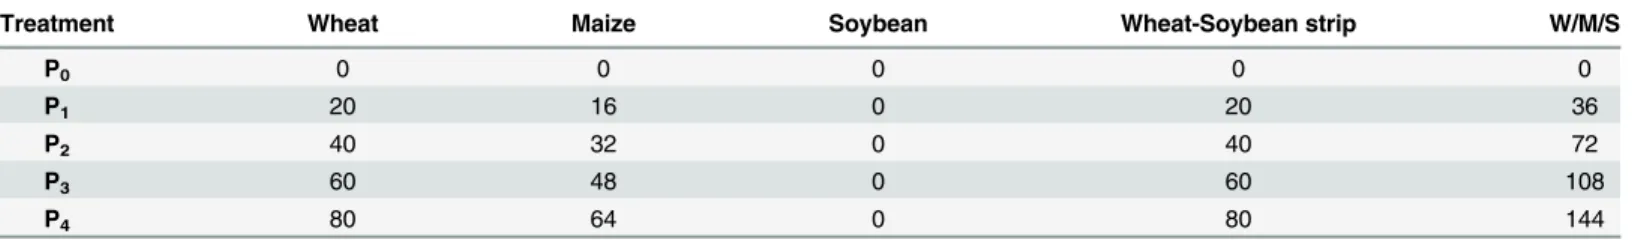
as an agronomically sound index to evaluate the P absorption efficiency of crops from P Table 2. P application rates for wheat, maize and soybean in the W/M/S system (kg P ha-1year-1).
Treatment Wheat Maize Soybean Wheat-Soybean strip W/M/S
P0 0 0 0 0 0
P1 20 16 0 20 36
P2 40 32 0 40 72
P3 60 48 0 60 108
P4 80 64 0 80 144
fertilizer applied to soil. PRE is calculated according to:
PRE ð%Þ ¼Uf U0
Pf
100 ð1Þ
whereUfis P uptake of the P treated crops,U0is P uptake of the no-P treated crops, andPfis
the amount of P fertilizer applied. Considering the experiment was continuously carried on for
3 years in the same location, we calculated the PRE for wheat (PREw), maize (PREm),
wheat-soybean strip (PREw-s), and W/M/S system (PREw/m/s) by the same principle. For example
PREwwas calculated as:PREW= 100×(Uw−f−Uw−0)/Pw−f, whereUw−fis the mean of P uptake of
the P treated wheat in 2011, 2012 and 2013;Uw−0is the mean of P uptake of the none-P treated
wheat in 2011, 2012 and 2013Pw−fis the mean of P fertilizer rates applied to wheat in 2011,
2012 and 2013.
Apparent P balance (APB) was calculated from the magnitude of applied P minus the total
P uptake by the aboveground biomass of wheat (APBw), maize (APBm), wheat-soybean strip
(APBw-s) and W/M/S system (APBw/m/s) respectively [22].
The linear-plateau model was used to analyze the relationship between P application rate and yield, aboveground biomass and shoot P uptake. The linear-plateau model is defined by
Eqs(2)and(3)as:
y¼aþbx ifðxÞ<c ð2Þ
y¼Yp ifðxÞ c ð3Þ
whereyis yield, aboveground biomass or shoot P content;ais the intercept parameter;bis the
slope parameter;xis the P application rate (kg P ha-1);cis the critical P application rate (kg P
ha-1), which is the interception point of the two linear segments; andYpis the plateau value
which is often 90% of the maximum yield [23].Eq 2can be interpreted as the region during
which the crop responds to P application, andEq 3to the plateau region where additional P
application has no effect.
Statistical analysis
Regression equations were developed for the relationships between P application rates and yield, aboveground biomass, or shoot P uptake for the linear-plateau model using the SAS 9.1.3 software (SAS Institute Inc., USA). Significance differences in PRE and soil Olsen-P content
between the different P treatments were conducted atp<0.05 level by least significant
differ-ence (LSD) using the SPSS 19.0 software (SPSS Institute Inc., USA).
Results
Shoot biomass and grain yield of the W/M/S system
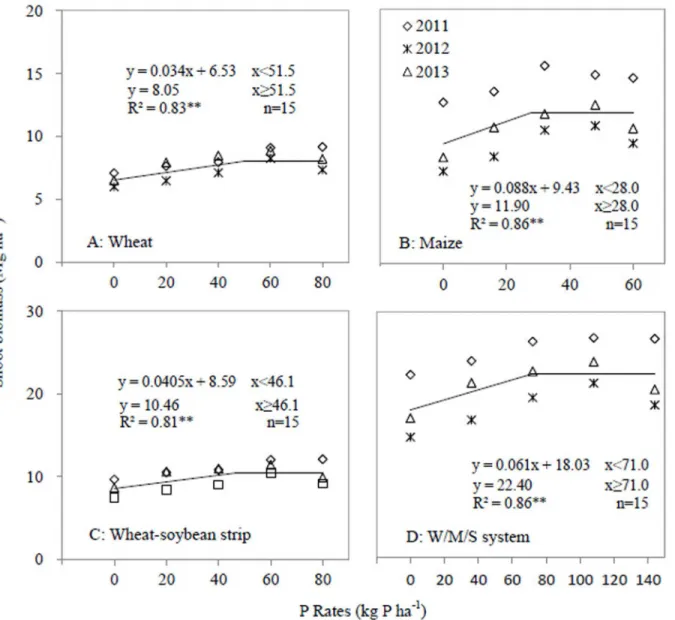
The linear-plateau model denoted linear relationships between P application rates and shoot
biomass of wheat (R2= 0.83), maize (R2= 0.86), wheat-soybean strip (R2= 0.81), and W/M/S
system (R2= 0.86) (P<0.001) (Fig 3). Increase in P application rate increased shoot biomass,
but the critical application rates for crop shoot biomass were greatly affected by crop species
and P application rate (Fig 3). For wheat, maize and wheat-soybean strip, the critical P
applica-tion rate was 51.5, 28.0 and 46.1 kg P ha-1respectively, and the plateau shoot biomass was 8.05,
11.90 and 10.46 Mg ha-1respectively. The critical P application rate for wheat-soybean strip
was lower than that for wheat. The critical P rate for the W/M/S system was 71.0 kg P ha-1,
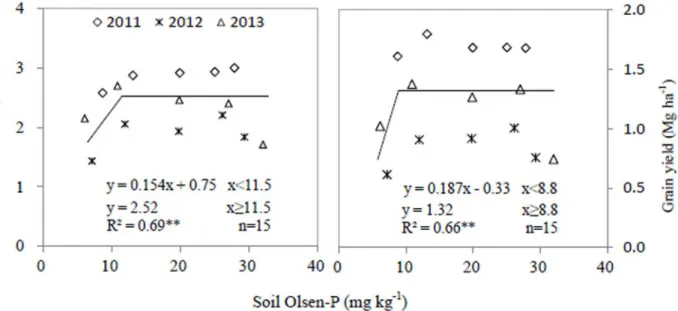
strips (Fig 3). Regarding soybean shoot biomass, the critical soil Olsen-P value was 11.5 mg kg
-1and the plateau value was 2.52 Mg ha-1(Fig 4).
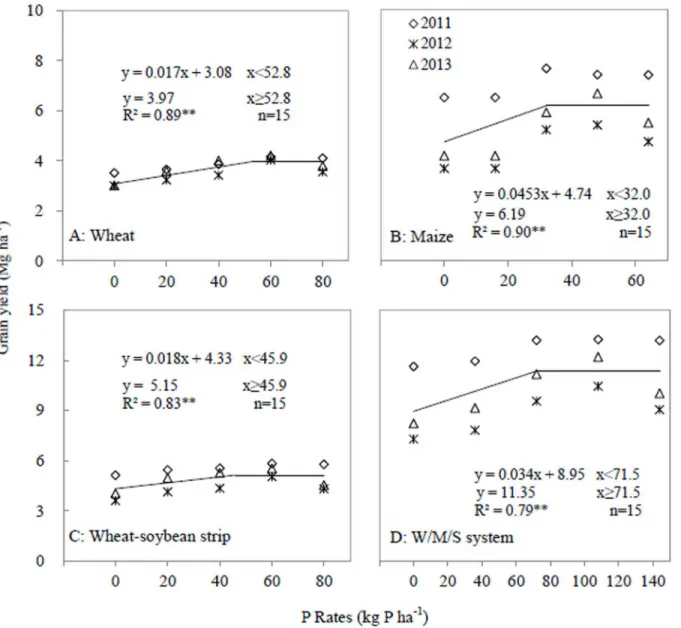
Similarly, the linear-plateau model presented the linear relationships between the P
applica-tion rate and yield of wheat (R2= 0.89), maize (R2= 0.90), wheat-soybean strip (R2= 0.83) and
the W/M/S system (R2= 0.79) (P<0.001) (Fig 5). For grain yield, a critical P application rate
was shown for wheat, maize, wheat-soybean strip and W/M/S system (Fig 5). Increase in P
application rate increased grain yield, but the critical P application rates were affected by crop species and cropping systems. For wheat, maize and wheat-soybean strips, the critical P rates
were 52.8, 32.0 and 45.9 kg P ha-1respectively, and the plateau grain yield was 3.97, 6.19 and
5.15 Mg ha-1respectively (Fig 5). The critical P rate for the W/M/S system was 71.5 kg P ha-1,
which is 6.4 kg P ha-1lower than the summed critical rate of both wheat-soybean and maize
strip. The plateau grain yield of the W/M/S system was 11.35 Mg ha-1(Fig 5). Considering the
Fig 3. Shoot biomass as affected by P application rates in 2011, 2012 and 2013.A, Wheat; B, Maize; C, Wheat-soybean strip; D, W/M/S system. Each data point was the mean of four replicates.
soybean grain yield, the critical soil Olsen-P value was 8.8 mg kg-1and the plateau value was
1.32 Mg ha-1(Fig 4).
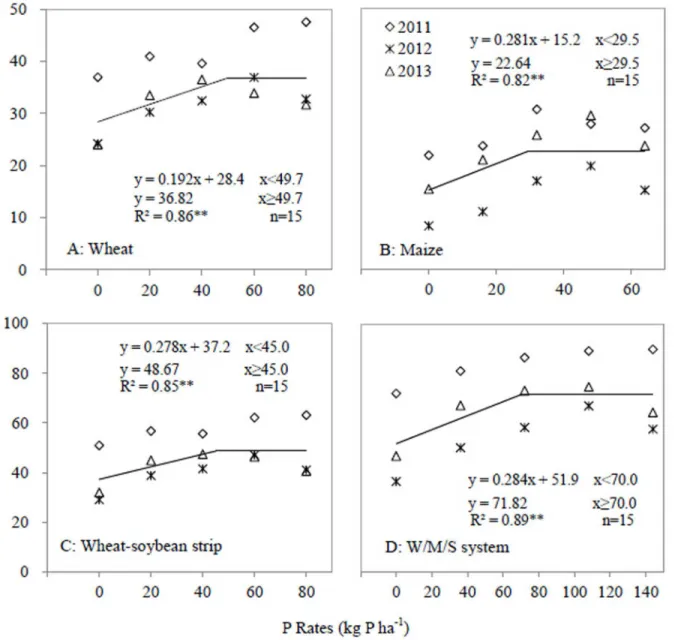
Shoot P uptake by intercropped species
Increase in P application rate increased shoot P uptake, but a changing point was observed in
the relationship between P application rate and shoot P uptake (Fig 6). The plateau shoot P
uptake of the W/M/S system was 71.82 kg P ha-1and the critical application rate was 70 kg P
ha-1(Fig 6). Regarding each component of the W/M/S, the critical P application rates for
wheat, maize and wheat-soybean strips were 49.7, 29.5, and 45.0 kg P ha-1respectively. The
pla-teau shoot P uptakes for wheat, maize and wheat-soybean strips were 36.82, 22.64, and 48.67
kg ha-1respectively.
Apparent recovery of fertilizer P (PRE) and apparent P balance as
affected by P application rate and intercropped species
The results showed that the PRE of each crop decreased as the P application rates increased (Table 3). Compared with the 20 kg P ha-1application rate, the 40, 60, and 80 kg P ha-1 applica-tion rates decreased PRE of wheat by 40.2%, 45.0% and 65.6% respectively. The PRE of the wheat-soybean strip was 46.5%, 39.9%, 35.7%, and 21.9% higher than that of wheat at the P
appli-cation rates of 20, 40, 60, and 80 kg P ha-1respectively. The PRE of maize was not significantly
different among 16, 32, and 48 kg P ha-1(P>0.05), but it was significantly higher than that of the
maize applied with 64 kg P ha-1(P<0.01). The PRE of the W/M/S system applied with more than
108 kg P ha-1decreased significantly compared with that of the system applied with 36 or 72 kg P
ha-1(P<0.05), but the PRE did not differ between 36 and 72 kg P ha-1(P>0.05) (Table 3).
Wheat, maize and wheat-soybean strips did not achieve apparent P budget balance given each
P rate (Table 3). Both P0and P1treatments caused P depletion in both the wheat-soybean strip
and the W/M/S system, but P2, P3, and P4treatment showed P surplus, although this surplus was
marginal at 72 kg P ha-1. At higher levels of applied P, the APB increased substantially to a
maxi-mum of 56.9 kg P ha-1. At P2rate, the W/M/S system was in apparent P balance (Table 3).
Soil P status influenced by P application rates and cropping species
Soil Olsen-P concentration was not significantly different between the wheat-soybean strip and
the maize strip across all P application rates over three growing seasons (Fig 7) (P>0.05).
Increase in P application rate increased soil Olsen-P in both the maize and wheat-soybean
strips in the 0–20 cm soil layer (Fig 7). In both wheat-soybean and maize strips applied with P2
rate, the soil Olsen-P was consistently kept at about 19.1 mg kg-1over the three years. However,
both wheat-soybean and maize strips applied with P0or P1rates, on average, reduced Olsen-P
by 2.28 and 2.02 mg kg-1respectively, in 2013 compared with the Olsen-P of those strips in
2011. Contrarily, both wheat-soybean and maize strips applied with P3rate increased soil
Olsen-P by 2.02 and 6.03 mg kg-1respectively. Wheat-soybean and maize strips applied with
P4rate increased soil Olsen-P by 4.17 and 6.55 mg kg-1in 2013, respectively, compared with
the Olsen-P of those strips in 2011 (Fig 7).
Fig 5. Grain yield as affected by P application rates in 2011, 2012 and 2013.A, Wheat; B, Maize; C, Wheat-soybean strip; D, W/M/S system. Each data point was the mean of four replicates.
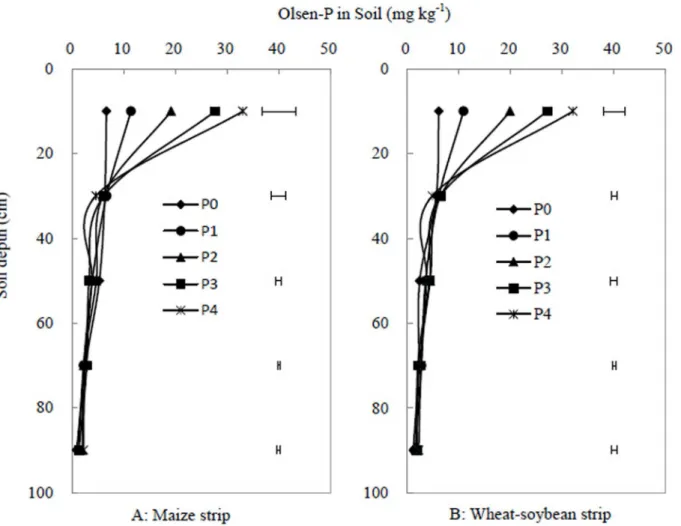
After three years, the soil Olsen-P was greatest in the top 20 cm soil in both the maize or
wheat-soybean strips, and continuous fertilizer input increased soil Olsen-P of the 0–20 cm
soil but did not significantly changed across soil profile below 20 cm (Fig 8). The soil Olsen-P
in 20–100 cm depths had no significant difference between maize and wheat-soybean strip
across all P treatments (Fig 8).
Discussions
A rational P application rate enhances crop production and shoot P
uptake of the W/M/S
Over-fertilization with phosphorus (P) causes severe environmental problems [24], while
inad-equate input of P results in low productivity and land degradation [5]. Therefore a rational P
Fig 6. Shoot P uptake as affected by P application rates in 2011, 2012 and 2013.A, Wheat; B, Maize, C Wheat-soybean strip; D, W/M/S system. Each data point was the mean of four replicates.
application rate is a prerequisite for a sustainable cropping system. The present study supports our hypothesis that a rational P application rate in the W/M/S system leads to a higher grain yield and more efficient P utilization.
A critical P application rate can be defined as a P application rate above which crop yield, shoot biomass and shoot P uptake do not respond to the increase in P application. Regarding the W/M/S system, the critical P application rates for grain yield, shoot biomass and P uptake were
71.5, 71 and 70 kg P ha-1respectively (Figs3–6). The W/M/S system applied with 72 kg P ha-1
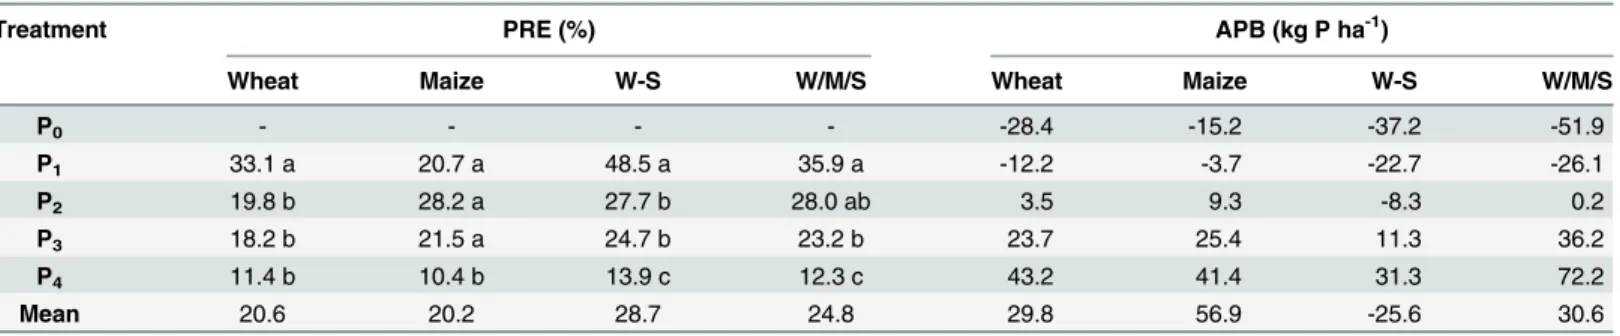
Table 3. Apparent applied P recovery efficiency (PRE) and apparent P balance (APB) as affected by P fertilization rates and cropping systems over the three years.
Treatment PRE (%) APB (kg P ha-1)
Wheat Maize W-S W/M/S Wheat Maize W-S W/M/S
P0 - - - - -28.4 -15.2 -37.2 -51.9
P1 33.1 a 20.7 a 48.5 a 35.9 a -12.2 -3.7 -22.7 -26.1
P2 19.8 b 28.2 a 27.7 b 28.0 ab 3.5 9.3 -8.3 0.2
P3 18.2 b 21.5 a 24.7 b 23.2 b 23.7 25.4 11.3 36.2
P4 11.4 b 10.4 b 13.9 c 12.3 c 43.2 41.4 31.3 72.2
Mean 20.6 20.2 28.7 24.8 29.8 56.9 -25.6 30.6
Values are means of 4 replicates. Different lower-case letters indicate significant difference (P<0.05) by LSD between different P application rates. W-S and W/M/S indicate wheat-soybean strip and wheat/maize/soybean relay strip intercropping system respectively.
doi:10.1371/journal.pone.0141725.t003
Fig 7. Soil Olsen-P in the top 20 cm layer of the maize strip at maize harvest (M) and the wheat-soybean strip at soybean harvest (W-S) in the W/M/S system as affected by P application rates each year.Different lower-case letters indicate significant difference (P<0.05) by LSD between different years under the same P application rate. Different capital letters indicate significant difference (p<0.05) by LSD between different P application rates. F = the first year (2011), S = the second year (2012), T = the third year (2013). P0, P1, P2, P3, P4indicate the P treatments (as intable 2). Each value was the mean±SE.
(P2treatment) had least P surplus but greatest apparent recovery of P fertilizer (PRE) (Table 3).
Thus, the critical P application rate, 72 kg P ha-1, is sufficient for meeting the demand of
produc-ing crop grain in this system. However, the critical P application rate can be different dependproduc-ing
on soil P concentration and yield level. Xia et al. [21] presented 40 kg P ha-1as a sufficient rate
for meeting P demands of all maize-based intercropping systems grown on Aridisol soil where
Olsen-P is 20.3 mg kg-1, higher than soil P availability in this study, which is 13.2 mg/kg.
How-ever, Aulakh et al. [25] demonstrated that 60 kg P2O5ha-1or 26 kg P ha-1is sufficient in a wheat/
soybean system that produces 6.55 Mg ha-1grain yield, much lower than the W/M/S yield in the
current study (Fig 5).
A rational P application also depends on crop species and soil fertility. In the present study, the critical P application rates associated with the yield, shoot biomass and P uptake of wheat
were 52.8, 51.5 and 49.7 kg P ha-1respectively, and the corresponding P rates of maize were
32.0, 28.0 and 29.5 kg P ha-1respectively (Figs3–6). A study on a wheat/maize intercropping
system grown on an Aridisol soil indicates a similar critical P rate, 53 kg P ha-1, regarding the
yield and shoot P uptake of wheat [8], and 40 kg P ha-1regarding those of maize [21]. However,
the results are clearly different from a study in which increased P supply does not increase the Fig 8. Soil Olsen-P of the maize strip at maize harvest (A) and the wheat-soybean strip at soybean harvest (B) in the 0–100 cm layers of the soil
profile in 2013.The floating bars indicate LSD (p<0.05) between different P application rates. P0, P1, P2, P3, P4indicate the P treatments (as intable 2). Each data point was the mean of four replicates.
average grain yield and shoot P uptake of both intercropped maize and faba bean grown on a
P-deficient reclaimed desert soil [26] and also different from another work on a maize/faba
bean intercropping system grown on sandy soil [27]. Thus, crops respond differently to P
applications depending on various intercropping system and soil conditions [21].
The apparent recovery efficiency of fertilizer P in W/M/S system
In China only 15–20% of the applied P is taken up by crops during the growing season [7–8],
but the present results showed a greater PRE of the W/M/S system, on average 24.8%, or even
higher, 28.0% when this system is applied with the critical P application rate, 72 kg P ha-1
(Table 3). Similarly, when the maize-based (e.g. rape, faba bean, chickpea, soybean) are
sup-plied with their critical P rate, 40 kg P ha-1, the PRE is up to 30%, on average 3.8 times greater
as that for the weighted means of the corresponding monocrops [21]. Interspecific interaction
may be a major reason why shoot P uptake and PRE are enhanced in intercropping systems. Several studies have shown that legumes increase P acquisition of associated cereals in
inter-cropping systems [11,21,26–28]. In calcareous soils, proton release by faba bean increases the
P uptake of intercropped cereals [27]. The root compatibility between intercropped maize and
associated faba bean may allow the intercropped maize to spread underneath the roots of neighbors and intermingle with them, thereby increasing root length density, root growth
space and corresponding nutrient uptake [29]. Similarly in cereal-cereal intercropping systems,
such as wheat/maize strip intercropping, roots of intercropped maize can further enlarge their
growth space underneath the root zone of harvest wheat [30], thus showing clear advantage in
total nutrient uptake over the sole cropping systems [11,31]. Additionally, fertilizer placement
is also important for the PRE of a cropping system, particularly for a strip relay intercropping
system in which two or more crops are grown in different strips at given time. Aulakh [25]
found that the PRE of soybean/wheat system was highest when 60 kg P2O5ha-1was applied to
the wheat strip, followed by the treatment when the same amount of P is added into both soy-bean and wheat strips, and lowest when the same amount of P is supplied to the soysoy-bean strip.
The results may be due to beans (e.g. soybean and faba bean) responding less to P fertilizer [26,
32] and being able to utilize the residual P left by other crops in rotation [33–34]. Similarly in
the current study, the averaged PRE of the wheat-soybean strip was significantly higher than
that of the pure wheat strip (Table 3). No fertilizer P was applied to soybean and the crop
grown as an aftercrop could adequately utilize the residual soil P after wheat harvest. In short words, the intercropping system applied with a critical P application rate has a greater PRE
than a system applied with a farmer’s common P rate, but the biological mechanisms involved
are unclear and need to be examined in the future.
Fertilizer P management strategies in W/M/S system
Most of nutrient management studies focus on nitrogen fertilizer application because nitrogen
(N) is one of the most important essential nutrients [35–36] but overuse has the negative
envi-ronmental effect of increasing N-related emissions from soil (e.g., N2O, NH3, NOx, and nitrate
leaching) [37–39]. However, phosphorus is commonly regarded as a key driving force of water
body eutrophication [40], thus reducing P efflux or keeping P apparent balance is crucial in
reducing water pollution, especially at the hilly area [41], such as the Southwest of China. Better
P fertilizer management for cropping systems can maintain P balance of inputs and output [6].
In the present W/M/S system, the critical P application rate (72 kg P ha-1) is lower than the
conventionally recommended P application rate (85.2 kg P ha-1) [42], but it meets the nutrient
requirement of crop producing high grain yield (Figs4and5). This yield is even higher than
critical P application rate results in efficient nutrient uptake while less nutrient output and con-sequently maintain P apparent balance. After three annual growing seasons, the critical P
application rate of 72 kg P ha-1maintained the soil Olsen-P concentration, 19.1 mg kg-1(Fig
7), with lower P input causing soil P depletion, and higher P input resulting in excessive P
accu-mulation in soil. Thus, the dominant cropping system maintains P input/output balance and the soil available P at an appropriate level, and the P efflux from the arable field could conse-quently be mitigated. This is vital for protecting the ecological environment and developing sustainable crop production intensification in the Southwest of China, the upstream of the Yangtze River.
Conclusions
Utilization of the different P requirement by the three crops and a rational P management strategy may have contributed to enhanced total grain yields and P use efficiency of the W/M/S system. Consequently, the overall apparent recovery of fertilizer P (PRE) of the W/M/S system is greatly increased comparing with the national average. A rational P application rate (e.g.
wheat 40 kg P ha-1/maize 32 kg P ha-1/soybean 0 kg P ha-1) in the W/M/S system resulted in a
balanced P input and output, high crop yields and high P recovery efficiency (28.8%) while
maintaining a steady soil Olsen-P level (19.1 mg kg-1). The W/M/S system with a rational P
application rate provides the basis for a sustainable and productive agricultural system.
Supporting Information
S1 Fig. Wheat/maize/soybean relay strip intercropping system.The pattern of the W/M/S system is shown as pictures (A, B, C, D, E). Wheat is first sown in November but maize strip is blank (A). Maize was transplanted in April of the following year when wheat is at flowering stage (B). After wheat is harvested in May of the following year soybean is planted on wheat strip after wheat harvest (C, D). Thus, soybean is planted as relay crop following wheat (E). (RAR)
Acknowledgments
The authors would like to thank all the colleagues that have provided us help to accomplish this study. Wei Huang, Xiaohui Chen, Yaqi Cui, Yu Yang, Hanhan Li and Lan Zou provided the help in field experiment. Dr. Larry Matthew York provided the help in polishing the revised manuscript.
Author Contributions
Conceived and designed the experiments: YXC TZ KX CCZ. Performed the experiments: TZ KW JL. Analyzed the data: YXC TZ CCZ. Contributed reagents/materials/analysis tools: YXC CCZ JYL. Wrote the paper: TZ YXC.
References
1. FAO (2011) FAOSTAT Database-Agriculture Production. Food and Agriculture Organization of the United Nations, Rome.
2. Zhang FS, Cui ZL, Chen XP, Ju XT, Shen JB, Chen Q, et al. (2012) Integrated nutrient management for food security and environmental quality in China. Adv Agron 116:1–40.
4. Ma WQ, Ma L, Li JH, Wang FH, Sisak I, Zhang FS (2011) Phosphorus flows and use efficiencies in pro-duction and consumption of wheat, rice, and maize in China. Chemosphere 84: 814–821. doi:10. 1016/j.chemosphere.2011.04.055PMID:21570104
5. Vitousek PM, Naylor R, Crews T, David MB, Drinkwater LE, Holland E, et al. (2009) Nutrient imbalances in agricultural development. Science 324: 1519–1520 doi:10.1126/science.1170261PMID:19541981
6. Li H, Huang G, Meng L, Ma L, Yuan L, Wang F, et al. (2011a) Integrated soil and plant phosphorus man-agement for crop and environment in China. A review. Plant Soil 349:157–167.
7. Zhang L, vander WW, Bastiaans L, Zhang S, Li B, Spiert JHJ (2008a) Light interception and utilization in relay intercrops of wheat and cotton. Field Crop Res 107: 29–42.
8. Zhang WF, Ma WQ, Ji YX, Fan MS, Oenema O, Zhang FS (2008b) Efficiency, economics, and environ-mental implications of phosphorus resource use and the fertilizer industry in China. Nutr Cycl Agroeco-syst 80: 131–144.
9. Zhong X, Zhao X, Bao H, Li HH, Li GT, Lin QM (2004) The evaluation of phosphorus leaching risk of 23 Chinese soil, I. Leaching criterion. Acta Ecol Sin 24: 2275–2280.
10. Chinese Ministry of Environment Protection, 2010. Available:http://www.gov.cn/jrzg/2010-02/10/ content_1532174.htm.
11. Li L, Sun JH, Zhang FS, Li XL, Yang SC, Rengel Z (2001a) Wheat/maize or soybean strip intercropping. I. Yield advantage and interspecific interactions on nutrients. Field Crop Res 71:123–137.
12. Li L, Sun JH, Zhang FS, Li XL, Rengel Z, Yang SC (2001b) Wheat/maize or soybean strip intercropping. II. Recovery or compensation of maize and soybean after wheat harvesting. Field Crop Res 71:173–
181.
13. Mao L, Zhang L, Li W, Werf WV, Sun J, Spiertz H, et al. (2012) Yield advantage and water saving in maize/pea intercrop. Field Crop Res 138: 11–20.
14. Zhang XB, He XB, Wen AB, Walling DE, Feng MY, Zou X (2004) Sediment source identification by using137Cs and210Pb radionuclides in a small catchment of the Hilly Sichuan Basin, China. Chinese
Sci Bull 49: 1953–1957.
15. Yang F, Huang S, Gao RC, Liu WG, Yong TW, Wang XC et al. (2014) Growth of soybean seeding in relay strip intercropping systems in relation to light quantity and red: far-red ratio. Field Crop Res 155: 245–253.
16. Chen YX, Chen XH, Tang YQ, Zhang FS, Chen XP, Zhang CC, et al. (2014a) Effect of nitrogen on dry matter accumulation and yield in wheat/maize/soybean intercropping systems. Acta Prataculturae Sinica 23: 73–83.
17. Chen XH, Xu KW, Tang YQ, Liu J, Chen XP, Zhang CC, et al. (2014b) Nitrogen accumulation, alloca-tion and translocaalloca-tion in wheat/maize/soybean relay intercropping system. J Plant Nutr Fertil 20: 1127–1138.
18. Blake GR, Hartge KH (1986) Bulk density. In: Klute A. (ed.), Methods of Soil Analysis.Part 1. Physical and Mineralogical Methods. Agronomy Monograph, Soil Sci Soc Am (SSSA), Madison, WI. vol. 9, 2nd ed., pp. 363–375.
19. Page AL (1982) Methods of soil analysis (Part 2), 2nd edn. American Society of Agronomy, Madison. 20. Murphy J, Riley J (1962) A modified single solution method for the determination of PO% innatural
waters. Anal Chim Acta 27:31–36.
21. Xia HY, Wang ZG, Zhao JH, Sun JH, Bao XG, Christie P, et al. (2013) Contribution of interspecific inter-actions and phosphorus application to sustainable and productive intercropping systems. Field Crop Res 154: 53–64.
22. Zhang H, Xu M, Shi X, Li Z, Huang Q, Wang X (2010) Rice yield, potassium uptake and apparent bal-ance under long-term fertilization in rice-based cropping systems in southern China. Nutr Cycl Agroeco-syst 88: 341–349.
23. Tang X, Ma YB, Hao XY, Li XY, Li JM, Huang SM, et al. (2009) Determining critical values of soil Olsen-P for maize and winter wheat from long-term experiments in China. Olsen-Plant Soil 323: 143–151.
24. Le C, Zha Y, Li Y, Sun D, Lu H, Yin B (2010) Eutrophication of lake waters in China: Cost, causes, and control. J Environ Manage 45: 662–668.
25. Aulakh MS, Pasricha NS, Bahl DS (2003) Phosphorus fertilizer respond in an irrigated soybean-wheat production system on a subtropical, semiarid soil. Field Crop Res 80: 99–109.
27. Li L, Li SM, Sun JH, Zhou LL, Bao XG, Zhang HG, et al. (2007) Diversity enhances agricultural produc-tivity via rhizosphere phosphorus facilitation on phosphorus-deficient soils. P Natl Acad Sci USA 104:11192–11196.
28. Li HG, Shen JB, Zhang FS, Marschner P, Cawthray G, Rengel Z (2010) Phosphorus uptake and rhizo-sphere properties of intercropped and monocropped maize, faba bean, and white lupin in acidic soil. Biol Fertil Soils 46:79–91.
29. Li L, Sun JB, Zhang FS, Guo TW, Bao XG, Andrew FA, et al. (2006) Root distribution and interactions between intercropped species. Oecologia 147: 280–290. PMID:16211394
30. Li L, Sun JH, Zhang FS (2011b) Intercropping with wheat leads to greater root weight density and larger below-ground space of irrigated maize at late growth stages. Soil Sci Plant Nutr 57: 61–67.
31. Li QZ, Sun JH, Wei XJ, Christie P, Zhang FS, Li L (2011c) Overyielding and interspecific interactions mediated by nitrogen fertilization in strip intercropping of maize with faba bean, wheat and barley. Plant Soil 339: 147–161.
32. Vandamme E, Pypers P, Vanlauwe B, Baijukya F, Smolders E, Merckx R (2014) Residual phosphorus effects and nitrogen × phosphorus interactions in soybean-maize rotations on a P-deficient Ferralsol. Nutr Cycl Agroecosyst 98: 187–201.
33. Zingore S, Murwira HK, Delve RJ, Giller KE (2008) Variable grain legume yields, responses to phos-phorus and rotational effects on maize across soil fertility gradients on African smallholder farms. Nutr Cycl Agroecosyst 80:1–18.
34. Kihara J, Vanlauwe B, Waswa B, Kimetu JM, Chianu J, Bationo A (2010) Strategic phosphorus applica-tion in legume-cereal rotaapplica-tions increases land productivity and profitability in Western Kenya. Exp Agric 46:35–52.
35. Silvia RM, Tommaso M (2013) Evaluation of nitrogen management in maize cultivation grows on soil amended with sewage sludge and urea. Eur J Agron 45: 59–67.
36. Xu JZ, Liao LX, Tan JY, Shao XH (2013) Ammonia volatilization in gemmiparous and early seedling stages from direct seeding rice fields with different nitrogen management strategies: A pots experiment. Soil Till Res 126: 169–176.
37. Erisman JW, Bleeker A, Hensen A, Vermeulen A (2008) Agricultural air quality in Europe and the future perspectives. Atmos Environ 42: 3209–3219.
38. Robertson JW and Vitousek PM (2009) Nitrogen in Agriculture: Balancing the Cost of an Essential Resource. Annu Rev Environ Resourc 34: 97–125.
39. Cui ZL, Yue SC, Wang GL, Mang QF, Wu L, Yang ZP, et al. (2013) Closing the yield gap could reduce projected greenhouse gas emissions: a case study of maize production in China. Global Change Biol 19: 2467–2477
40. Schindler D W, Hecky RE, Findlay DL, Stainton MP, Parker BR, Paterson MJ, et al. (2008) Eutrophica-tion of lakes cannot be controlled by reducing nitrogen input: results of a 37-year whole-ecosystem experiment. P Natl Acad Sci USA 105: 11254–11258.
41. Gao Y, Zhu B, Zhou P, Tang JL, Wang T, Miao CY (2009) Effects of vegetation cover on phosphorus loss from a hill slope cropland of purple soil under simulated rainfall: a case study in China. Nutr Cycl Agroecosys 85: 263–273.
42. DB51/T810-2008 The relay-planting system of“wheat/corn/soybean”. Available:http://www. rcsoybean.com/.
43. Yong TW (2009) Analysis of the nitrogen uptake and utilization, rhizosphere micro-ecology in the
“wheat/maize/soybean”relay-cropping system. Dissertation, Sichuan Agricultural University. Available: