A NEW METHOD FOR EVALUATING POSTNATAL GROWTH IN THE FIRST TWO YEARS OF LIFE’
M. Martell,2 J. Gaviria,3’ and R. Belitzky4
Despite high prevalence of low birth-weight infants in deuelop- ing countries, and high rates of mortality associated with low birth-weight, virtually no standardsfor monitoring the growth of low birth-weight babies have been developed. This article
presents tables and curves that can be used by physicians and
primary health care workers to monitor growth of both low birth-weiEht and normal infants during the first two years of life.
Introduction
An individual undergoes a series of so- matic and physiological changes during intrauterine and postnatal life, from the time of conception. Concurrently, body mass increases and new functions are ac- quired. These biological phenomena are intimately interrelated, the increase in cor- poral mass paralleling a measurable in- crease in psychomotor ability.
The term “growth” is used preferentially for referring to anatomical and physiologi- cal changes, while “development” refers to processes concerned with the acquisition of motor, psychological, and sensorial abili- ties. These two processes result in the evolu- tion, over time, of an individual’s “normal” status.
The first action to take when examining an infant or child should be to assess growth and development, regardless of the
‘Report of a study performed at the PAHO/WHO Latin American Center for Perinatology and Human Development (CLAP) in Montevideo, Uruguay. Also appearing in Spanish in the R&tin de la Oficina Sanitaria Panamericana 86(2):95-104, 1979.
ZNeonatologist. Latin American Center for Peri- natology and Human Development.
kniversity of MCrida/PAHO fellow at the Latin American Center for Perinatology and Human De- velopment, 1977.
4PAHO/WHO Perinatology Consultant at the Latin American Center for Perinatology and Human Development.
reason for the examination. Development is generally evaluated by means of the standards described by Gesell (2) or the Denver test (6). Growth may be assessed by the use of tables and curves for weight-age, or for height and head circumference-age. Norms commonly used in Uruguay and other countries are derived from those published by Jackson and Kelly (7) and Tanner (8-10).
Simple standard growth measurements, such as those proposed by Weech and adapted by Nelson (5) are often used to evaluate weight and height. However, these charts and standard measurements deal only with full-term well-nourished children born with an adequate weight for their gestational age.
The prevalence of low birth-weight infants (LBI)-made up of pre-term infants (PTI) and small-for-gestational-age infants (SFGI)-according to different authors is between 14 per cent and 40 per cent in de- veloping countries. This prevalence de- pends, in large measure, upon the socioeco- nomic background of the sample studied rather than the specific country. Since such children and infants are vulnerable, it is clearly important to follow their growth and development, and this poses a real prob- lem for child health services. At present there are few references published (II, 12) that describe adequately the characteristics
Martell et al.
l EVALUATION OF POSTNATAL GROWTH 371of growth in these infants and children, and we think that appropriate tables and growth curves for these children will be useful.
Virtually no standards have been devel- oped for early detection and control of growth pattern alterations. Another factor that complicates growth assessment, espe- cially in developing countries is the fact that birth-weights are sometimes not re- corded because of substandard obstetric care.
It is important to recall that neuron mye- linization occurs during the first six months of life, and that low birth-weight and pre- mature infants can attain weights within normal limits (3, 12) if they receive appro- priate treatment during the first two years of postnatal life.
The first objective of this study is to pro- vide data for the assessment of growth in LB1 (PTI and SFGI), and for full-term in- fants (FTI) in their normal birth-weight range. The second objective is to provide a method that will allow the evaluation of growth velocity. For this purpose it is neces- sary to have body-weight measurements separated by a fixed time interval. The method to be described may be used even though neither gestational age nor birth- weight is known.
Materials and Methods
Tables were constructed based on a new criterion (3, 12): Mean growth velocity per weight unit (MGV/WU). The MGV/WU, which expresses growth over time (e.g., over daily or weekly periods) in grams per kg of body weight, is determined by the formula:
Weight gain (present weight minus weight at previous examination)
MGV/WU =
Weight at previous examination x Days between the two examina- tions
For example, if the infant’s present weight is 3.9 kg, its previous weight was
3.000 kg, and 30 days elapsed between the weighings, then
3.900 kg - 3.000 kg 0.900 kg
MGV/WU =
3.000 kg x 30 days = 90 kg-days =O.OlOkgx kg-x day=
=lO grams daily weight gain per kg of body weight
This methodology was developed in a long-term study of 112 children (64 low birth-weight infants and 48 full-term in- fants with adequate birth-weights) up to two years of age (3, 13). The sample was comprised of simple pregnancies of Cauca- sian mothers with similar socioeconomic
Figure 1. Curves for evaluating 30.day weight gains (MGV/WU),* showing average gains for
percentiles 10,25,50, 75, and 90.
1500 1400
1200
1090 z .6 800
: I 6
640
400 _
ZOO{
0
Figure 2. Curves evaluating 45-day weight gains (MGV/WU),* showing average gains for
percentiles 10, 25,50, 75, and 90.
*Along the top of the graph find the weight in kg recorded in the examination performed 45 days pre- viously and draw a vertical line downward at that point: along the left-hand edge of the graph find the grams gained in the time interval between the two examinations (present weight minus weight 45 days previously) and draw a horizontal line across the graph at that point. The zone within which the two lines intersect indicates whether the child’s growth during de 45.day interval has been insuFficient, ade- quate, or excessive.
background in the city of Montevideo. A progressive and continual perinatal care system was provided for the mothers and newborn infants. All the infants were con- sidered healthy and none had congenital anomalies. Anthropometry was done exclu- sively by two individuals trained in the techniques of Falkner (I) and Owen.
Measurements were made at the follow- ing postnatal ages:
15 days zt 2 day limit
1, 2, 3, 4, 5, and 6 months + 4 day limit 8, 10, 12, 15, 18, 21, and 24 months f 1 week limit.
Figure 3. Curves for evaluating 60.day weight gains (MGV/WIJ),* showing average gains for
percentiles 10, 25,50, 75, and 90.
2400 2200 2000 1800 1600 1400 1200 1000 BOO 600 400 ,200 0
*Along the top of the graph find the weight in kg recorded in the examination performed 60 days previously and draw a vertical line downward at that point: along the left-hand edge of the graph find the grams gained in the time interval between the two examinations (present weight minus weight 30 days previously) and draw a horizontal line across the graph at that point. The zone within which the two lines intersect indicates whether the child’s growth during the 30.day interval has been insufficient, ade- quate, or excessive.
No measurements outside the time limits were considered.
Martell et al.
l EVALUATION OF POSTNATAL GROWTH373
with children whose growth was in the ninetieth percentile of the classic curves.
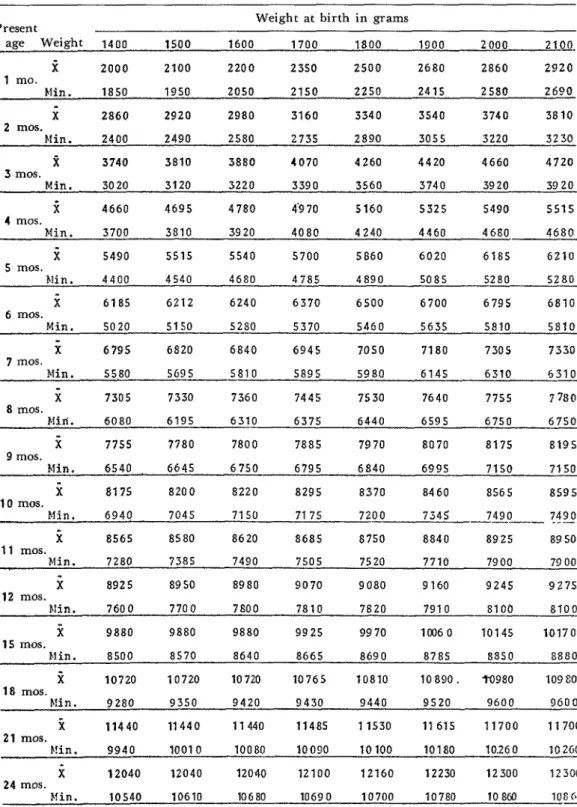
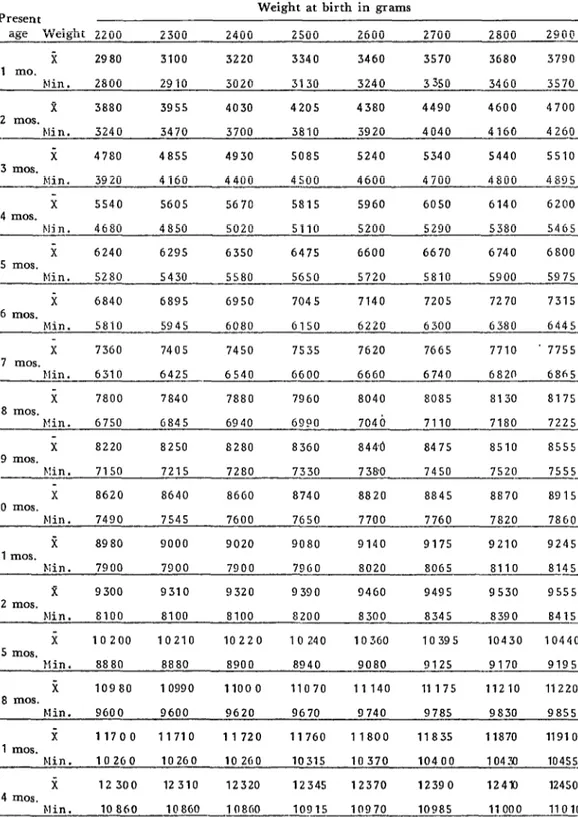
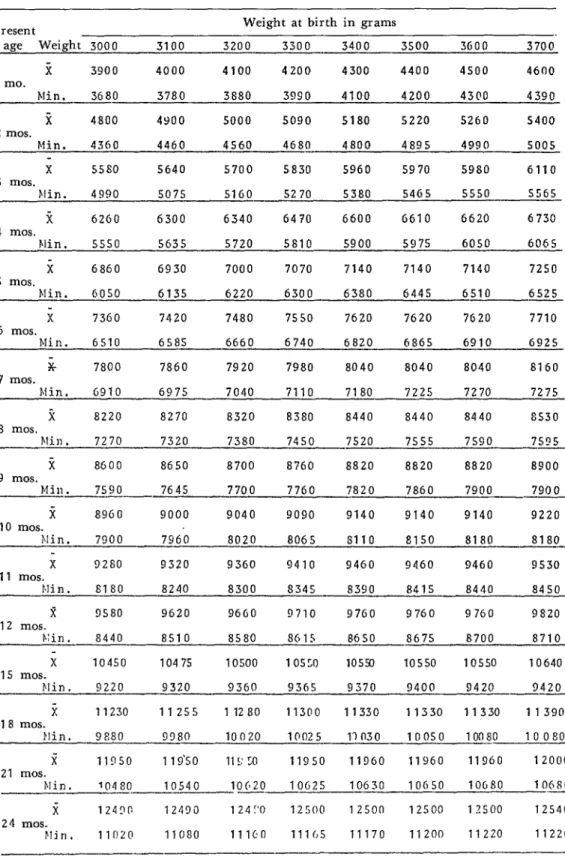
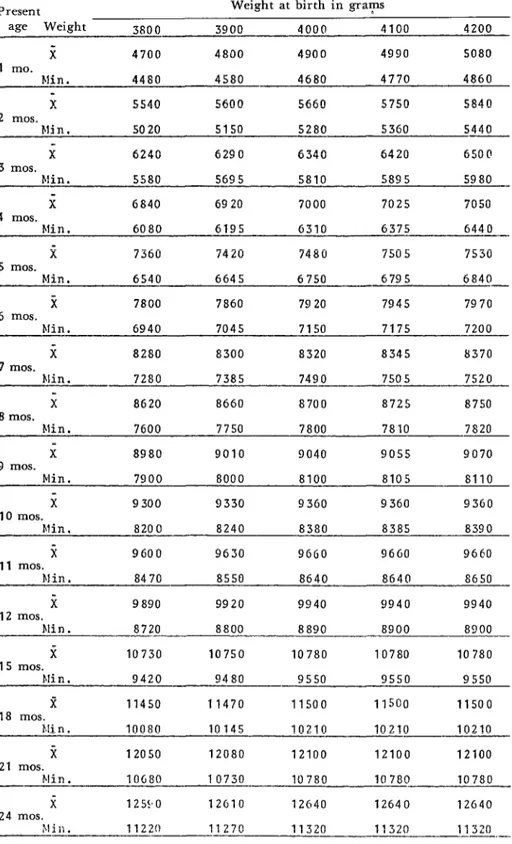
The figures and Table 1 presented in this article were developed on the basis of these comparative data. Table 1 shows the mean and minimum acceptable weights for infants of different ages based upon weight at birth. Figures 1-3 show ranges of appro- priate weight gains over specified time in- tervals in terms of body weight, irrespective of the subject’s date of birth and birth- weight.
Postnatal
Growth Curves
The growth curves shown were developed on the basis of each subject’s weight upon initial examination and his or her weight at an interval of 30 days (Figure l), 45 days (Figure Z), or 60 days (Figure 3) after that examination. Beginning with a body weight of 2 kg and proceeding upward at 100-g intervals to 12 kg, growth rates per unit of body weight (MGV/WU) were determined for children situated in percentiles 10, 25, 50, 75, and 90. Doing this for 30-day, 45- day, and 60-day intervals permitted delimi- tation of the five zones shown in Figures l- 3. Information provided by these zone divi- sions is as follows:
Zone I: Insufficient weight gain (below tenth percentile, P 10, of MGV/ WU).
ZoneII: Insufficient weight gain (be- tween P 10 and P 25 of MGV/ WU).
Zone III: Adequate weight gain (between P 25 and P 75 of MGV/WU).
Zone IV: Excessive weight gain (between P 75 and P 90 of MGV/WU). ZoneV: Excessive weight gain (above
P 90 of MGV/WU).
Growth Table
When the weight gains of the children under observation place them in Zone III
on the charts (between percentiles 25 and 75 of MGV/WU), then in virtually all cases their total weight and age place them be- tween percentiles 10 and 90 on the classic growth curves (5, 7, 9). Using this infor- mation, Table 1 shows mean weights and minimum acceptable weights for each month from birth to 24 months of age. The mean weights were derived by grouping in- fants according to birth-weight (starting at 1.4 kg) and adding the monthly weight gain corresponding to percentile 50 of MGV/ WU. The minimum acceptable weights were derived by the same procedure, using percentile 25 of growth rate per unit weight instead of percentile 50. The minimum values obtained correspond generally to the lower edge of Zone III and percentile 10 on the classic weight-for-age curves.
Use
ofthe Table and Figures
The data in the Table 1 permit one to determine the theoretical mean weight and minimum acceptable weight for any subject O-2 years of age. Knowing the sub- ject’s birth-weight, one merely follows the corresponding column for that weight down to the line for the subject’s present age, where the appropriate mean weight and minimum acceptable weight will be found. This procedure allows an initial growth evaluation to be made simply and quickly-even for subjects with birth- weights as low as 1,400 g-so long as their birth-weights and ages are known, irrespec- tive of whether they were premature.
Table 1. Postnatal growth chart for infants and young children O-24 months of age.
Present Weight at birth in grams
age Weight 1400 1500 1600 1700 1800 1900 2000 2100.
i 2000 2100 2200 2350 2500 2680 2860 2920
1 mo.
Min. 1850 1950 2050 2150 2250 2415 2580 2600
x 2860 2920 2980 3160 3340 3540 3740 3810
2 mos.
Min. 2400 2490 2580 2735 2890 3055 3220 3230
2 3740 3810 3880 4070 4260 4420 4660 4720
3 mos.
Min. 3020 3120 3220 3390 3560 3740 3920 3920
ic 4660 4695 4780 4.9 70 5160 5325 5490 5515
4 mos.
Min. 3700 3810 3920 4080 4240 4460 4680 ~- 4680
i 5490 5515 5540 5700 5860 6020 6185 6210
5 mos.
Min. 4400 4540 4680 4785 4890 5085 5280 5280
i 6185 6212 6240 6370 6500 6700 6795 6810
6 mos.
Min. 5020 5150 5280 5370 5460 5635 5810 5810
x 6795 6820 6840 6945 7050 7180 7305 7330
7 mos.
Min. 55fso 5G95 5810 5895 5980 6145 6310 5310
i 7305 7330 7360 7445 7530 7640 7755 7780
8 mos.
Mid. 6080 6195 6310 6375 6440 6595 6750 6750
i 775s 7780 7800 7885 7970 8070 at75 8195
9 mos.
Min. 6540 6645 6750 6795 6840 6995 7150 7150
i 8175 8200 8220 8295 8370 8460 8565 8595
10 mos.
Min. 6944 7045 7150 717s 7200 7345 A-- 7490 7430 _---
i 8565 8580 8620 8685 8750 8840 8925 89 50
11 mos.
Min. 7280 7385 7490 7505 7520 7710 7900 79 00
i 8925 8950 8980 9070 9080 9160 924s 9275
12 mos.
Min. 7600 7700 7600 7810 7820 7910 81 Ob 8100
i 9880 9880 9880 9925 9970 10060 10145 10170
15 mos.
Min. 8500 8570 8640 8665 8690 8785 8850 8880
ii 10720 10720 10720 10765 10810 10890. to980 109 80
18 mos.
h!in. 9280 9350 9420 9430 9440 9520 9600 9600
ic
11440 11440 11440 11485 11530 11 615 11700 1170021 mos.
!!in. 9940 10010 10080 10090 10100 10180 10.260 102GO
i 12040 12040 12040 12100 12160 12230 12300 12300
24 mos.
Martell et al.
l EVALUATION OF POSTNATAL GROWTHTable 1. Postnatal pwth chart for infants and young children O-24 months of age.
375
Present Weight at birth
in grams
age Weight 2200 2300 2400 2500 2600 2700 2800 2900
x 2980 3100 3220 3340 3460 3570 3680 3790
1 mo.
Min. 2800 2910 3020 3130 3240 3350 3460 3570
x
3880 3955 4030 4205 4380 4490 4600 47002 mos.
bli n. 3240 3470 3700 3810 3920 4040 4160 4261?_
x 4780 4855 4930 5085 5240 5340 5440 5510
3 mos.
Min. 3920 4160 4400 4500 4600 4700 4800 4895
x 5540 5605 5670 5815 5960 6050 6140 6200
4 mos.
Min. 4680 4850 5020 5110 5200 5290 5380 5465
i 6240 6295 6350 6475 6600 6670 6740 6800
5 mos.
Min. 5280 5430 5580 5650 5720 5810 5900 5975
i 6840 6895 6950 7045 7140 7205 7270 7315
6 mos.
Min. 5810 5945 6080 (1150 6220 6300 (1380 6445
x
7360 7405 7450 7535 7620 7665 7710 . 77557 mos.
Min. 6310 6425 6540 GGOO 6660 6740 6820 6865
x
7800 7840 7880 7960 8040 8085 8130 81758 mos.
Kin. 6750 0845 6940 6990 7046 7110 7180 7225
x 8220 8250 8280 8360 844.0 8475 8510 8555
9 mos.
F!in. 7150 7215 7280 7330 7380 7450 7520 7555-
x 8620 8640 8660 8740 8820 8845 8870 89 15
10 mos.
Min. 7490 7545 7600 7650 7700 7760 7a20 7860
fi a980 9000 9020 9080 9140 9175 9210 9245
11 mos.
Kin. 7900 7900 7900 7960 8020 8065 8110 8145 -
z 9300 9310 9320 9390 9460 9495 9530 9555
12 mos.
Irlin. 8100 8100 8100 8200 8300 8345 8390 8415 -
x 10200 10210 10220 10240 10360 10395 10430 10440
15 mos.
Min. 8880 8880 8900 8940 9080 9125 9170 9195
i 10980 10990 11000 11070 11140 11175 11210 11220
18 mos.
Min. 9600 9600 9620 9670 9740 9785 9830 9855
x 11700 11710 11720 11760 11800 11835 11870 11910
21 mos.
Min. 10260 10260 10260 10315 10370 10400 10430 10455-
i 12300 12310 12320 12345 12370 12390 124x) 12450
24 mos.
Table 1. Postnatal growth chart for infants and young children O-24 months of age.
Present Weight at birth in grams
age Weight 3000 3100 3200 3300 3400 3500 3600 3700.
x 3900 4000 4100 4200 4300 4400 4500 4600
1 mo.
Min. 3680 3780 3880 3990 4100 4200 4300 4390
i 4800 4900 5000 5090 5180 5220 5260 5400
2 mos.
Min. 4360 4460 4560 4680 4800 4895 4990 5005
x 5580 5640 5700 5830 5960 5970 5960 6110
3 mos.
Min. 4990 5075 5160 5270 5380 5465 5550 5565
k 6260 6300 6340 6470 6600 G610 6620 6730
4 mos.
Plin. 5550 5635 5720 5810 5900 597s 6050 6065
i 6860 6930 7000 7070 7140 7140 7140 7250
5 mos.
Min. 6050 6135 6220 6300 6380 6445 6510 6525
x 7360 7420 7480 7550 7620 7620 7020 7710
6 mos.
Min. 6510 6585 6660 6740 6820 6865 6910 6925
x
7800 7860 7920 7980 8040 8040 8040 81607 mos.
M i n . G910 6975 7040 7110 7180 7225 7270 7275
i 8220 8270 8320 8380 8440 8440 8440 as30
8 mos.
Flin , 7270 7320 7380 7450 7520 7555 7590 759s
--
i 8600 8650 8700 8760 8820 8820 8820 8900
9 mos.
Min. 7590 7645 7700 7760 7820 7860 7900 7900
i 8960 9000 9040 9090 9140 9140 9140 9220
10 mos.
filin. 7900 7960 8020 8065 8110 8150 8180 8180
X 9280 9320 9360 9410 9460 9460 9460 9530
11 mos.
fdi n . 8180 8240 8300 8345 8390 8415 8440 8450
R 9580 9620 9660 9710 97G0 9760 9760 9820
12 mos.
i\:in. 8440 8510 8580 8615 8650 8675 8700 8710
x 10450 10475 10500 10550 10550 10550 10550 10640
15 mos.
tdin. 9220 9320 9360 9365 9370 9400 9420 -- 9420
i 11230 11255 11280 11300 11330 11330 11330 11390
18 mos.
flin. 9880 9380 10020 10025 11030 10050 10080 10080
i 11950 1 19‘50 115: 50 11950 11960 11960 11960 12000
21 mos.
Min. -- '0480 10540 10620 -- lOG25 10630 10650 10660 10680
x 1249(: 12490 1 24 I'0 12500 12500 12500 12500 12540
24 mos.
MarteN et al.
l EVALUATION OF POSTNATAL GROWTH377
-
Table 1. Postnatal growth chart for infants and young children O-24 months of age.
Present Weight at birth in gra?s
age Weight 3800 3900 4000 4100 4200
i 4700 4800 4900 4990 5080
1 mo.
Min. 4480 4580 4680 4770 4860
x 5540 5600 5660 5750 5840
2 mos.
Min. 5020 5150 5280 5360 5440
x 6240 6290 6340 6420 650@
3 mos.
Kin. 5580 5695 5810 5895 5980
x 6840 6920 7000 7025 7050
4 mos.
Min. 6080 6195 6310 6375 6440
i 7360 7420 7480 7505 7530
5 mos.
Min. 6540 6645 6750 6795 6840 -
x 7800 7860 7920 794s 7970
6 mos.
Min. 6940 7045 7150 7175 7200
i 82S0 8300 8320 8345 8370
7 mos.
Min, 7280 7385 7490 7505 7520
x 8620 8660 8700 8725 8750
8 mos.
Min. 7600 7750 7800 7810 7820
x 8980 9010 9040 9055 9070
9 mos.
Min. 7900 8000 8100 8105 8110
x 9300 9330 9360 9360 9360
10 mos.
FZin. 8200 8240 8380 8385 8390
it 9600 9630 9660 9600 9660
11 mos.
Min. 8470 8550 8640 8640 8650
i 9890 9920 9940 9940 9940
12 mos.
Min. 8720 8800 8890 8900 8900
x 10730 10750 10780 10780 10780
15 mos.
bfi n . 9420 9480 9550 9550 9550
R 11450 11470 11500 11500 11500
18 mos.
Mi n . 10080 10145 10210 10210 10210
i 12050 12080 12100 12100 12100
21 mos.
Min. lOG80 10730 10780 10780 10780
x 125!*0 12610 12640 12640 12640
24 mos.
experienced by children being given dif- ferent treatments for malnutrition.
Since the growth being measured, though continuous, may be less rapid at some pe- riods than at others, more than one mea- surement should be made to confirm a
diagnosis. One pair of weighings may be in- adequate; but if repeated weighings place the subject in the same zone of the weight- gain charts, these findings may provide the
basis for a conclusive diagnosis. If a lower
than adequate value (Zone I or II) is ob- tained-even in a single examination -the
child’s medical history should be consulted and an exhaustive physical examination
performed to investigate the possible causes of the inadequate weight gain.
Used together, these charts and the table
permit early detection of significant degrees of undernutrition and obesity-even (in the case of the charts) when subject’s gestational age and birth-weight are unknown. An additional important advantage is that both
the table and charts are very straightfor-
ward and can be readily used by workers providing primary health care.
SUMMARY
Despite the high prevalence of low-birth
weight infants in developing countries, and of
heavy mortality associated with low birth-weight and malnutrition, virtually no standards for measuring the patterns of growth of low birth- weight infants and young children have been developed. Moreover, there are many cases where a subject’s birth-weight has not been re- corded, a circumstance further complicating any attempt to determine whether appropriate growth is being achieved. The aim of this article is to present tables and charts that can be used for this purpose by primary care workers and other health personnel.
Previous work done at the Latin American Center for Perinatology and Human Develop- ment in Uruguay found a close relationship be-
tween the mean daily amount of weight gained per unit of body weight and rates of growth indi- cated by classic weight-for-age curves. This rela-
tionship persisted regardless of whether the chil-
dren (in the O-2 year age group) were premature
or had a low birth-weight for their gestational age. On the basis of this relationship, it has been possible to construct charts employing current weight versus weight gained over a specified period to show whether a given subject’s rate of weight gain is insufficient, adequate, or exces- sive. Likewise, a table for subjects with known
ages and birth-weights has been constructed. This combined the subject’s birth-weight with antici- pated rates of weight gain per unit of body weight to provide a similar basis for growth evaluation.
REFERENCES
(1) Falkner, F. Human Development. Saund- ers, Philadelphia, 1966.
(2) Gesell, A., and C. Amatruda. Diagnhtico de1 desarrollo (3rd edition). Paid& Eds., Buenos
Aires, Argentina, 1966.
(3) Martell, M., L. B. Bertolini, F. Nieto, S. Tenzer, R. Ruggia. and R. Belitzky. Creci- miento y desarrollo en Los dos primeros adios de vida postnatal. Scientific Publication 672. Latin American Center for Perinatology and Human
Development (PAHO/WHO), Montevideo,
Uruguay, 1977.
(4) Sinclair, D. Human Growth after Birth (2nd edition). Oxford University Press, New York, 1973.
(5) Nelson, W. E., V. C. Vaughan, and R. J. McKay. Textbook of Pediatrics (9th edition). Saunders, Philadelphia, 1969.
(6) Frankenburg, W. K.. and J. B. Dodds. The Denver developmental screening test. J Pediatr 71:181, 1967.
Martell et al. l EVALUATION OF POSTNATAL GROWTH 379
(8) Tanner, J. M. The assessment of growth and development in children. Arch Dis Child 27:10, 1952.
(9) Tanner, J. M., R. H. Whitehouse, and M. Takaishi. Standards from birth to maturity for height, weight, height velocity, and weight velocity: British children, 1965 (I). Arch Dis Child 41:454, 1966.
(10) Tanner, J. M., R. H. Whitehouse, and M. Takaishi. Standards from birth to maturity for height, weight, height velocity, and weight velocity: British children, 1965 (II). Arch Dis
Child 41:613, 1966.
(II) Babson, S. G. Growth of low birth-weight infants.j Pediatr 77:11, 1970.
(12) Cruise, M. 0. A Longitudinal study of growth of low birth weight infants: I. Velocity and distance growth from birth to 3 years. Pediatrics 51:620, 1973.
(13) Martell, M., F. Falkner, L. B. Bertolini, J. L. Diaz, F. Nieto, S. M. Tenzer, and R. Belitzky. Early postnatal growth evaluation in fullterm, preterm and small-for-date infants. EaTlj Human Development 1:313, 1978.
INTERNATIONAL DRIVE AGAINST ENDEMIC GOITER*
An estimated 200 million or more people throughout the world are un- necessarily affected by goiter, since the technical means to prevent the disease-adding iodine to table salt-are available at very low cost. Iodine deficiency causes common, endemic goiter, a widespread nutritional defi- ciency disease found particularly in mountainous areas, which causes enlargement of the thyroid gland. Cretinism, or other forms of mental deficiency, and neurological disorders are frequent among children born to mothers with the disease.
The Fourth Ministerial Session of the United Nations World Food Council meeting in Mexico in June 1978 adopted the resolution, endorsed by the General Assembly, urging governments to “adopt the goal of eradicating” endemic goiter within the next decade and to establish measures to achieve that goal. Nineteen countries have been asked by the executive heads of the United Nations World Food Council, the World Health Organization, and the United Nations Children’s Fund to join in the proposed program.