AR
TICLE
Trends in risk factors chronic diseases,
according of health insurance, Brazil, 2008-2013
Abstract This article aims to compare the trends for risk and protective factors for NCD in the pop-ulation with and without health insurance. Anal-ysis of temporal trends of the Vigitel phone survey, collected annually in adult population. Were used analyzed the temporal series of variables referent to risk and protective factors for NCD, from 2008 to 2013. Variables were compared according to the possession or not of health insurance using simple linear regression model. There was a reduction in the prevalence of smoking in the population with and without health insurance, in 0.72% and 0,69% per year respectively. The consumption of fruits and vegetables grew 0,8% and 0.72% per year respectively among the population with and without health insurance. Physical activity in lei-sure time increased 1.17% and 1.01% per year among population with and without health in-surance. Excess weight increased in 1.03% and obesity in 0.74% p.y in the population with health insurance and 1.53% and 0.95% p.y without health insurance. Mammography increased 2.4% in the population without health insurance. Vig-itel monitoring showed improvement in the indi-cators in the population with and without health insurance.
Key words Non-communicable diseases, Health insurance, Trends, Smoking, mammography Deborah Carvalho Malta 1
Regina Tomie Ivata Bernal 2
Martha Oliveira 3
1 Escola de Enfermagem,
Departamento de Enfermagem Materno-Infantil e Saúde Pública, Universidade Federal de Minas Gerais. Av. Alfredo Balena 190, Santa Efigênia. 30130-100 Belo Horizonte MG Brasil.
2 Núcleo de Pesquisas
Epidemiológicas em Nutrição e Saúde, Faculdade de Saúde Pública.
3Agência Nacional de Saúde
M
alta D
Introduction
Noncommunicable diseases (NCDs) – particu-larly cardiovascular and chronic respiratory dis-eases, along with neoplasms and diabetes – cause a high number of premature deaths and loss of quality of life, in addition to exerting significant
economic and social impacts1.
The NCD epidemic has preferentially affect-ed low-income populations because they are most exposed to risk factors and have the least
access to healthcare services1.Studies indicate
differences in the distribution of the morbidity, mortality and risk factors of NCDs according to socioeconomic conditions, access to services and consumer purchasing patterns, among other
fac-tors1-3.
As a function of their global relevance, a high-level meeting of the United Nations Gen-eral Assembly held in 2011 summoned heads of state and countries, and global agreements for addressing NCDs were established. The agree-ments and targets include a 25% reduction in premature mortality from NCDs by 2025 and re-ductions in specific risk factors, such as smoking
and physical inactivity4.
Within that context, monitoring the trends exhibited by NCDs and their risk factors at the national and regional levels and per population segments and sectors is relevant for identifying
social vulnerabilities and ways to correct them4,5.
Data from the National Household Sam-ple Survey (Pesquisa Nacional de Amostra de Domicílios - PNAD) show that in Brazil, individ-uals with higher family income have better access
to healthcare services and medical consultations6.
In addition, the higher the family income, the higher the odds are for individuals to have ac-cess to privatehealth insurance coverage. Thus, in 2008, 84% of the population with income over 20 times the minimum wage had private health insurance coverage versus 3% of the low-income
population6.
In the United States, specialized telephone surveys (e.g., the Behavioral Risk Factor Surveil-lance System [BRFSS]) indicate that the popula-tion with private health insurance tends to have wider access to preventive testsand exhibits a higher prevalence of protective factors, such as healthy eating and physical activity, and a lower
prevalence of risk factors, such as smoking7,8.
Few studies have assessed this topic in Brazil; however, those studies that have, such as one con-ducted in Belo Horizonte, Minas Gerais, detected a significantly higher prevalence of risk factors in
populations without private health insurance9.
Studies conducted within the National System of Surveillance of Chronic Diseases by Tele-phone Survey (Sistema Nacional de Vigilância de Doenças Crônicas por Inquérito Telefônico – Vigitel) found that the access to cancer screening tests is better among the population with private
health insurance 10, which further exhibits a
larg-er prevalence of protective factors and a lowlarg-er
prevalence of risk factors10.
Starting in 2006, risk factors for NCDs began
to be monitored in Brazil through Vigitel11. The
survey is performed with the adult population
(≥ 18 years old) from all 26 state capitals and the
Federal District on an annual basis10. The
vari-able private health insurance was included in 2008, which allowed for new explorations relative to the population thus benefitted.
The present study compared the trends exhib-ited by the protective and risk factors for NCDs and reported morbidity and access to preventive tests between the population with or without pri-vate health insurance from all Brazilian capitals taken together from 2008 to 2013.
Method
This population-based cross-sectional study was
conducted with the adult population (≥ 18 years
old) from the 26 Brazilian state capitals and the Federal District. Vigitel surveys probabilistic
samples of the adult population (≥ 18 years old)
based on the register of landline owners provid-ed by the main telephone operating companies every year. Five thousand landlines are randomly selected from each city by lottery and are then divided into replicates (or subsamples) with 200 landlines each to identify the eligible ones, i.e., the active residential landlines. Once the eligibil-ity of each landline is established, the resident to be interviewed is selected.
Vigitel databases from 2008 to 2013 were
used. The raking11-13 technique was used to
e C
ole
tiv
a,
20(4):1005-1016,
2015
balanced according to the sample weights. The
weights were calculated using Izrael et al.’s13
mac-ro sasRakinge.sas in the pmac-rogram. This pmac-rocedure seeks to equate the distribution of the surveyed population to the one of the population of each state capital, as estimated by Vigitel.
The Vigitel questionnaire consists of approx-imately 90 questions on various subjects, includ-ing demographic and socioeconomic charac-teristics; dietary and physical activity patterns; reported body weight and height; tobacco and alcohol use; self-assessed state of health; and
re-ported morbidity11.
The trends exhibited by the populations with or without private health insurance were com-pared, and the following risk factors for NCDs were analyzed:
a) Tobacco use: prevalence of smokers (% smokers/number of interviewees).
b) Overweight (body mass index – BMI ≥ 25
kg/m2) and obesity (BMI ≥ 30 kg/m2).
c) Dietary intake: consumption of meat with visible fat (red meat with visible fat or chicken
with skin); regular soft drink or artificial fruit juice
intake (five or more days per week); recommend-ed fruit, legume and vegetable intake (five or more
daily portions five or more days per week);
regu-lar fruit, legume and vegetable intake (% of adults who consume fruits and vegetables five or more
days per week); and whole milk intake (% of
indi-viduals who consume whole milk).
d) Recommended free-time physical activity (practice of mild-tomoderate-intensity physical activity 150 minutes per week, or at least 75 min-utes ofvigorous physical activity per week, inde-pendently from the number of weekly sessions); and Watchingtelevision (TV) three or more hours per day (% of individuals who watch TV three or more hours per day).
e) Alcohol abuse (four [women]/five [men] or more doses of alcoholon a single occasion within the past 30 days, considering as one dose of alco-hol: one measure of any distilled beverage, one
beer can or one glass of wine); and Driving after
drinking alcohol (% of adults who reported driv-ing after havdriv-ing drunk alcohol).
f) Reported morbidity (report of previously diagnosed arterial hypertension or diabetes).
g) Self-assessed state of health (% of adults who assessed their state of health as poor)
h) Performance of cancer screening tests by
women: mammogram (women 50 to 69 years
old) and Papanicolaou (Pap) testing (women 25
to 59 years old).
In all of the indicators, the denominator was the total number of interviewed adults, except for the gender- or age-specific indicators.
Time series analysis
The first step of the calculation method was
the construction of a time series (Zt) for each
in-dicator using secondary data. The estimates of risk and protective factors corresponding to the period from 2008 to 2013 were extracted from the Vigitel databases.
The second step wastime series (Zt)
model-ing to establish whether atrend wassignificant. In this study, modeling was performed by means of simple linear regression according to the
equation Zt = α+ ß*t + at , where Zt is the
preva-lence at time t; α, the intercept; ß, the regression
coefficient or slope, with t ranging from 2008
to 2012; and at, the residuals(random error). A
positive regression coefficient indicates an in-creasing tendency, while a negative coefficient indicates a falling tendency. The following tests were used to check the model goodness-of-fit: analysis of variance (ANOVA), which indicates
whether the function fit by the linear model (Zt
= α+ ß*t + at) decreases the residual variance
compared to the simple model (Zt = m+ at) we
used to test hypothesis: H0: ß = 0 at 5%
signifi-cance; coefficient of determination ( ),
which measures the strength of the association between indicator and time; residual analysis,
calculated as the difference between actual (Zt )
and adjusted (Ẑt) prevalence, which indicates the
quality of model-fitting: standardized residuals within the range -2 to 2 indicate a lack of atypi-cal values that might lead to over- or underesti-mating a trend; and the p-value of coefficients
α (intercept or intersection) and ß (regression
coefficient). The significance level was set as less
than 5% in ANOVA and R2 equal to or higher
than 70%. The assumption underlying time se-ries analysis was that what happened in the past
will repeat in the future14.
The Vigitel survey was approved by the Na-tional Commission of Human Research Ethics, Health Ministry. Written informed consent was replaced by verbal consent manifested by inter-viewees upon being contacted by phone.
SQregression
M
alta D
Results
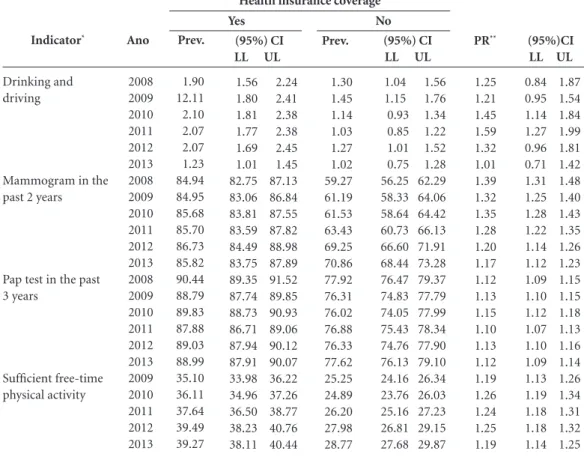
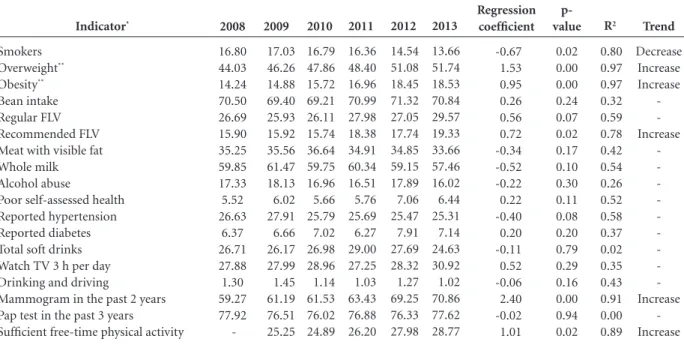
The prevalence of protective factors was general-ly higher and the frequency of risk factors lower among the population with private health insur-ance. The lower prevalence of smokers, higher prevalence of fruit, legume and vegetable (FLV) intake, lower frequency of fat meat intake and lower frequency of soft drink intake stand out. Half of the population with or without private health insurance was overweight, and the prev-alence of obesity was high in both groups. The prevalence of alcohol abuse was high in both groups, while drinking and driving was more common in the group with private health in-surance. The insured women performed can-cer-screening tests (mammogram and Pap test-ing) more often. Self-assessment of the state of health as poor was three times more frequent among the population without private health insurance. Although the frequency of free-time physical activity was higher in the insured pop-ulation, it exhibited increasing trends in both groups (Table 1). The population with private health insurance exhibited the lowest prevalence of smokers throughout the study period. The prevalence of smokers in that group decreased 0.72% per year, i.e., from 12.4% to 8.6% in 2013 (Table 2).
The frequency of individuals who were over-weight among the group with private health insurance increased 1.03% per year, i.e., from 45.8% (2006) to 49.6% (2013).
Similarly, the prevalence of obesity in that group increased 0.74% per year, i.e., from 12.9% (2008) to 16.2% (2013). It is worth noting that this prevalence rate remained stable from 2012 to 2013.
Relative to the dietary intake, the consump-tion of beans and soft drinks remained stable, while the intake of recommended FLV increased from 24.9% (2008) to 28.3% (2013), i.e., 0.83% per year. Consumption of whole milk decreased from 52.1% (2008) to 49.1% (2013), i.e., -0.94% per year. The remaining variables representing dietary intake remained stable throughout the investigated period.
Free-time physical activity increased 1.17% per year, i.e., from 35.1% (2008) to 39.3% (2013) in the group with private health insurance (Table 2).
The frequency of mammograms was stable among the insured population. The remaining investigated trends were also stable in this group: reported morbidity, self-assessed state of health,
TV watching habit, alcohol abuse and drinking and driving (Table 2).
Among the population without private health insurance, the prevalence of tobacco use decreased 0.67% per year, i.e., from 16.8% to 13.7% in 2013 (Table 3).
In this group, the frequency of overweight in-creased 1.53% per year, i.e., from 44.0% (2008) to 51.7% (2013). It is worth noting that the percent-age variation remained stable from 2012 to 2013.
Obesity exhibited a similar pattern, with a 0.95% increase per year, i.e., from 14.2% to 18.5% (2013), but leveled off from 2012 to 2013.
Relative to dietary intake, the consumption of beans, soft drinks, meat with visible fat and whole milk remained stable. The frequency of recommended FLV intake increased from 15.9% (2008) to 19.3% (2013), i.e., 0.72% per year.
Free-time physical activity increased 1.01% per year in the group without private health in-surance, i.e., from 25.3% (2009) to 28.8% (2013) (Table 3).
The frequency of mammograms increased in this group from 59.3% to 70.9%, i.e., 2.4% per year; this indicator had the greatest growth throughout the investigated period. In contrast, mammogram frequency remained stable among the women with private health insurance (0.28% per year; p = 0.30). The frequency of Pap testing remained stable throughout the investigated pe-riod.
The remaining investigated variables were stable: reported morbidity, self-assessed state of health, TV-watching habits, alcohol abuse and drinking and driving.
Discussion
The prevalence of protective factors was general-ly higher and the frequency of risk factors lower among the population with private health insur-ance. The results indicate an improvement of the trends exhibited by the protective factors free-time physical activity, increased FLV intake and reduced prevalence of tobacco use. The mammo-gram coverage exhibited a remarkable increase in the group of women without private health in-surance only. Overweight and obesity increased in both groups until leveling off from 2012 to 2013. The consumption of milk decreased in the population with private health insurance.
e C ole tiv a, 20(4):1005-1016, 2015
Table 1. List of (95%) confidence intervals for the frequencies of indicators and prevalence ratios per year, stratified per health insurance coverage. Set of 26 state capitals and the Federal District, 2008-2013.
Indicator*
Smokers
Overweight***
Obesity***
Regular bean intake (5 or more times per week)
Regular fruit and vegetable intake
Recommended fruit and vegetable intake
Fatty meat intake
Whole milk intake
Ano 2008 2009 2010 2011 2012 2013 2008 2009 2010 2011 2012 2013 2008 2009 2010 2011 2012 2013 2008 2009 2010 2011 2012 2013 2008 2009 2010 2011 2012 2013 2008 2009 2010 2011 2012 2013 2008 2009 2010 2011 2012 2013 2008 2009 2010 2011 2012 2013 Prev. 12.39 11.20 10.94 10.06 9.37 8.61 45.81 45.62 48.62 49.35 50.96 49.66 12.93 13.72 14.33 15.05 16.24 16.42 59.77 59.82 61.45 63.82 63.35 62.54 40.39 39.22 38.94 39.98 41.71 43.13 24.90 24.93 23.93 25.91 28.28 28.33 28.00 28.38 28.61 29.71 27.89 27.95 52.13 53.73 51.41 51.00 47.96 49.09 it continues (95%) CI LL UL
11.51 13.27 10.40 12.01 10.09 11.79 9.28 10.83 8.57 10.17 7.86 9.36 44.61 47.02 44.44 46.80 47.42 49.81 48.17 50.52 49.66 52.26 48.46 50.87 12.09 13.76 12.90 14.55 13.53 15.12 14.23 15.87 15.29 17.19 15.55 17.30 58.61 60.93 58.69 60.96 60.31 62.60 62.73 64.92 62.13 64.56 61.40 63.69 39.22 41.55 38.08 40.35 37.80 40.08 38.85 41.11 40.46 42.97 41.96 44.31 23.88 25.91 23.93 25.92 22.94 24.92 24.90 26.91 27.13 29.43 27.26 29.39 26.88 29.12 27.26 29.50 27.51 29.72 28.61 30.81 26.70 29.08 26.83 29.08 50.93 53.34 52.55 54.92 50.22 52.60 49.83 52.18 46.67 49.26 47.88 50.29 Yes Prev. 16.80 17.03 16.79 16.36 14.54 13.66 44.03 46.26 47.86 48.40 51.08 51.74 14.24 14.88 15.72 16.96 18.45 18.53 70.50 69.40 69.21 70.99 71.32 70.84 26.69 25.93 26.11 27.98 27.05 29.57 15.90 15.92 15.74 18.38 17.74 19.33 35.25 35.56 36.64 34.91 34.85 33.66 59.85 61.47 59.75 60.34 59.15 57.46 (95%) CI LL UL
15.81 17.80 15.99 18.08 15.75 17.84 15.36 17.35 13.49 15.60 12.70 14.62 42.84 45.22 44.97 47.56 46.54 49.18 47.20 49.59 49.76 52.41 50.50 52.98 13.39 15.08 13.96 15.80 14.84 16.61 16.09 17.83 17.42 19.47 17.57 19.49 69.48 71.51 68.28 70.52 68.09 70.34 69.98 72.01 70.22 72.41 69.79 71.89 25.66 27.73 24.82 27.03 24.97 27.25 26.92 29.05 25.93 28.17 28.48 30.65 15.03 16.77 14.98 16.86 14.78 16.69 17.45 19.32 16.78 18.70 18.38 20.28 34.06 36.44 34.29 36.82 35.34 37.94 33.73 36.08 33.54 36.15 32.45 34.87 58.67 61.04 60.23 62.72 58.47 61.03 59.18 61.51 57.85 60.44 56.24 58.68 No PR** 0.84 0.74 0.74 0.70 0.72 0.72 1.05 1.02 1.04 1.02 1.00 0.97 0.97 1.01 0.95 0.92 0.94 0.93 0.93 0.94 0.97 0.97 0.95 0.94 1.28 1.27 1.23 1.22 1.32 1.27 1.29 1.28 1.21 1.18 1.35 1.26 0.89 0.86 0.86 0.94 0.86 0.88 0.91 0.93 0.91 0.88 0.84 0.88 (95%)CI LL UL
M
alta D
in the United States (USA)7,8, which showed that
such populations exhibit higher risk of NCDs
and poorer access to healthcare services7,8. Worse
results were reported for populations without health insurance coverage, youths, non-whites, autonomous workers, unemployed people, in-dividuals with low-paying jobs, and low-income
populations7,8,15,16.The frequencies of screening
tests, such as mammograms, colonoscopy and Pap testing, are higher in populations with health
insurance coverage7.
One study conducted in the metropolitan
area of Belo Horizonte, Brazil9 found that
indi-viduals with health insurance coverage exhibit-ed healthier habits, such as less tobacco use and more free-time physical activity, consumed five or more daily FLV portions, and performed
can-cer screening tests more often9.
In the USA and Brazil, the population with health insurance coverage typically has more schooling and income, which is usually
associat-ed with wider access to goods and services9,10,15-18.
Tabela 1. continuation
it continues
Indicator*
Regular soft drink intake (5 times or more per week)
Alcohol abuse Poor self-assessed health Arterial hypertension Diabetes
Watch TV 3 hours per day Ano 2008 2009 2010 2011 2012 2013 2008 2009 2010 2011 2012 2013 2008 2009 2010 2011 2012 2013 2008 2009 2010 2011 2012 2013 2008 2009 2010 2011 2012 2013 2009 2010 2011 2012 2013 Prev. 26.06 25.75 26.58 25.85 24.03 21.76 17.09 18.82 19.36 16.56 19.03 16.77 3.46 3.10 3.11 3.19 2.81 3.18 23.77 22.77 22.52 22.79 23.05 22.79 6.03 5.96 6.51 6.29 6.78 6.57 22.22 25.28 24.48 24.33 26.01 (95%) CI LL UL
24.93 27.20 24.64 26.85 25.44 27.71 24.77 26.94 22.84 25.22 20.67 22.85 16.17 18.02 17.89 19.75 18.40 20.32 15.66 17.45 17.97 20.10 15.83 17.70 3.03 3.89 2.67 3.52 2.66 3.55 2.78 3.59 2.43 3.19 2.78 3.58 22.75 24.78 21.81 23.73 21.59 23.45 21.87 23.71 22.02 24.08 21.85 23.74 5.47 6.60 5.42 6.49 5.98 7.05 5.73 6.85 6.18 7.38 6.02 7.12 21.23 3.21 24.24 26.32 23.47 25.49 23.23 25.43 24.96 27.06 Yes Prev. 26.71 26.17 26.98 29.00 27.69 24.63 17.33 18.13 16.96 16.51 17.89 16.02 5.52 6.02 5.66 5.76 7.06 6.44 26.63 27.91 25.79 25.69 25.47 25.31 6.37 6.66 7.02 6.27 7.91 7.14 27.99 28.96 27.25 28.32 30.92 (95%) CI LL UL
25.56 27.85 24.96 27.37 25.81 28.15 27.85 30.14 26.44 28.94 23.48 25.78 16.41 18.25 17.11 19.15 16.00 17.92 15.60 17.42 16.81 18.96 15.07 16.96 4.97 6.06 5.44 6.61 5.11 6.20 5.25 6.28 6.29 7.83 5.82 7.05 25.54 27.72 26.72 29.10 24.67 26.91 24.67 26.71 24.37 26.57 24.28 26.34 5.76 6.98 5.94 7.39 6.39 7.64 5.73 6.80 7.22 8.61 6.53 7.76 26.80 29.17 27.74 30.18 26.18 28.33 27.08 29.56 29.75 32.09 No PR** 1.02 1.01 1.00 0.93 0.91 0.95 0.98 0.96 1.06 0.93 1.02 0.97 0.79 0.66 0.73 0.73 0.52 0.62 0.90 0.86 0.91 0.88 0.94 0.92 0.99 0.95 0.94 1.01 0.87 0.99 0.87 0.89 0.93 0.90 0.89 (95%)CI LL UL
e C
ole
tiv
a,
20(4):1005-1016,
2015
Tabela 1. continuation
* Weighted percentage to adjust the sociodemographic distribution of the Vigitel sample to the projected distribution of the adult
population from the same city per study year (see Methodological Features 2012). ** Imputed missing data. *** Prevalence ratios
adjusted for age, gender and level of schooling.
There are also historical inequalities in the in-stalled capacity and access to services and equip-ment between different regions, urban and rural areas, types of services and human resources
6,18,19.Such inequalities have been attenuated by
the Unified Health System (Sistema Único de Saúde – SUS), which grants universal access to healthcare.
The Health Ministry recommends Pap test-ing every three years for women of
reproduc-tive age20 and mammograms every two years for
women 50 to 69 years old, based on international evidence on the beneficial impact of screening on breast cancer mortality in women within that age
range21.
Vigitel data showed that the coverage of can-cer screening tests, such as mammograms and Pap testing, is wider among health insured wom-en, which might be accounted for by the greater
access to services among that population7,8,10.
Studies based on the Sanitary Medical Care Survey (Pesquisa sobre Assistência Médica Sani-tária - AMS) showed that the numbers of hospi-tal beds and equipment such as mammography devices are larger in the private healthcare
set-ting22. This situation is gradually changing as a
function of the investment made by the Health Ministry on a program that prioritizes the
con-trol of breast and cervical cancer23,24. The present
study showed that over a short period of time, the access to mammograms improved much fast-er in the SUS. In this regard, it is worth noting that the coverage of mammograms among the population without health insurance reached 75% of the goal established for 2022 in the Plan
for Combat of Chronic Diseases3,25; that goal has
already been accomplished among the popula-tion with private health insurance.
Although the frequency of Pap testing was also higher among women with private health
Indicator*
Drinking and driving
Mammogram in the past 2 years
Pap test in the past 3 years
Sufficient free-time physical activity
Ano
2008 2009 2010 2011 2012 2013 2008 2009 2010 2011 2012 2013 2008 2009 2010 2011 2012 2013 2009 2010 2011 2012 2013
Prev.
1.90 12.11 2.10 2.07 2.07 1.23 84.94 84.95 85.68 85.70 86.73 85.82 90.44 88.79 89.83 87.88 89.03 88.99 35.10 36.11 37.64 39.49 39.27
(95%) CI LL UL
1.56 2.24 1.80 2.41 1.81 2.38 1.77 2.38 1.69 2.45 1.01 1.45 82.75 87.13 83.06 86.84 83.81 87.55 83.59 87.82 84.49 88.98 83.75 87.89 89.35 91.52 87.74 89.85 88.73 90.93 86.71 89.06 87.94 90.12 87.91 90.07 33.98 36.22 34.96 37.26 36.50 38.77 38.23 40.76 38.11 40.44 Yes
Prev.
1.30 1.45 1.14 1.03 1.27 1.02 59.27 61.19 61.53 63.43 69.25 70.86 77.92 76.31 76.02 76.88 76.33 77.62 25.25 24.89 26.20 27.98 28.77
(95%) CI LL UL
1.04 1.56 1.15 1.76 0.93 1.34 0.85 1.22 1.01 1.52 0.75 1.28 56.25 62.29 58.33 64.06 58.64 64.42 60.73 66.13 66.60 71.91 68.44 73.28 76.47 79.37 74.83 77.79 74.05 77.99 75.43 78.34 74.76 77.90 76.13 79.10 24.16 26.34 23.76 26.03 25.16 27.23 26.81 29.15 27.68 29.87 No
PR**
1.25 1.21 1.45 1.59 1.32 1.01 1.39 1.32 1.35 1.28 1.20 1.17 1.12 1.13 1.15 1.10 1.13 1.12 1.19 1.26 1.24 1.25 1.19
(95%)CI LL UL
M alta D Indicator* Smokers Overweight** Obesity** Bean intake Regular FLV Recommended FLV Meat with visible fat Whole milk Alcohol abuse
Poor self-assessed health Reported hypertension Reported diabetes Total soft drinks Watch TV 3 h per day Drinking and driving
Mammogram in the past 2 years Pap test in the past 3 years
Sufficient free-time physical activity
Table 2. Analysis of the time series trends for indicators corresponding to the population with private health insurance. Set of 26 state capitals and the Federal District, 2008-2013.
* Weighted percentage to adjust the sociodemographic distribution of the Vigitel sample to the projected distribution of the adult population from the
same city per study year (see Methodological Features 2012). ** Imputed missing data.
2008 12.39 45.81 12.93 59.77 40.39 24.90 28.00 52.13 17.09 3.46 23.77 6.03 26.06 23.83 1.90 84.94 90.44 2009 11.20 45.62 13.72 59.82 39.22 24.93 28.38 53.73 18.82 3.10 22.77 5.96 25.75 22.22 2.11 84.95 89.04 35.10 2010 10.94 48.62 14.33 61.45 38.94 23.93 28.61 51.41 19.36 3.11 22.52 6.51 26.58 25.28 2.10 85.68 89.83 36.11 2011 10.06 49.35 15.05 63.82 39.98 25.91 29.71 51.00 16.56 3.19 22.79 6.29 25.85 24.48 2.07 85.70 87.88 37.64 2012 9.37 50.96 16.24 63.35 41.71 28.28 27.89 47.96 19.03 2.81 23.05 6.78 24.03 24.33 2.07 86.73 89.03 39.49 2013 8.61 49.66 16.42 62.54 43.13 28.33 27.95 49.09 16.77 3.18 22.79 6.57 21.76 26.01 1.23 85.82 88.99 39.27 Regression coefficient -0.72 1.03 0.74 0.77 0.64 0.83 -0.02 -0.94 -0.11 -0.06 -0.11 0.14 -0.78 0.66 -0.10 0.28 -0.24 1.17 p- value 0.00 0.02 0.00 0.05 0.09 0.04 0.93 0.03 0.76 0.25 0.36 0.05 0.05 0.16 0.26 0.06 0.30 0.01 R2 0.98 0.79 0.98 0.68 0.56 0.71 0.00 0.71 0.03 0.31 0.21 0.67 0.66 0.54 0.30 0.62 0.26 0.93 Trend Decrease Increase Increase -Increase -Decrease -Increase Indicator* Smokers Overweight** Obesity** Bean intake Regular FLV Recommended FLV Meat with visible fat Whole milk Alcohol abuse
Poor self-assessed health Reported hypertension Reported diabetes Total soft drinks Watch TV 3 h per day Drinking and driving
Mammogram in the past 2 years Pap test in the past 3 years
Sufficient free-time physical activity
Table 3. Analysis of the time series trendsfor indicators corresponding to the population without private health insurance. Set of 26 state capitals and the Federal District, 2008-2013.
* Weighted percentage to adjust the sociodemographic distribution of the Vigitel sample to the projected distribution of the adult population from the
same city per study year (see Methodological Features 2012). ** Imputed missingdata.
e C
ole
tiv
a,
20(4):1005-1016,
2015
insurance, the differences are smaller among un-insured women, as Pap testing is performed at the primary care level by the SUS Family Health Program, which has wide coverage, particularly among the SUS-dependent, low-income
pop-ulation6. The target established for the Plan for
Combat of Chronic Diseases is to achieve 85% average coverage of Pap testing by 2022, which has already been accomplished among the pop-ulation with private health insurance and is very close to being met among the population with
only SUS care (76.3%)3,25.
In 2008, the global prevalence of diabetes was estimated to be 10% and that of arterial
hyper-tension to range from 25 to 40%1. As Vigitel
con-siders self-reported morbidity, the prevalence of some diseases might be underestimated because of previously established medical diagnoses, thus implying access to services. Such measurements might be advantageous for surveys from the point of view of cost and speed. Several studies conducted in Brazil and the USA show that the sensitivity of this strategy is good for the
self-re-ported diagnoses of hypertension26,27.
No differences were detected in the trends of hypertension and diabetes throughout the inves-tigated period. Those conditions were most often diagnosed in individuals without private health insurance, which might be accounted for by their poorer access to health promotion habits, such as healthy eating and practice of physical activity. The possibility of access to primary care and the opportunity of diagnosis at SUS primary care
fa-cilities is emphasized28.
The frequency of physical activity was higher among the population with private health insur-ance, while that of physical inactivity was similar in both groups. Some studies found associations between physical activity with more schooling,
higher income and health insurance coverage29,30.
Populations with better socioeconomic condi-tions have wider access to information on healthy habits and to private facilities for exercising can purchase healthy foods such as fruits, legumes and vegetables and have more knowledge of the negative effects of smoking, among other disease
factors9. Despite their unfavorable circumstances,
the level of physical activity increased among the population without health insurance coverage, attesting to a reduction in access inequalities in this regard. The relevance attributed to popula-tion-based programs to promote physical activ-ity, including the establishment of specific areas
for exercising in the community, such as the Health Academy Program, is worth mentioning, as is the funding for municipal physical activi-ty programs, in addition to the encouragement given to exercising by healthcare professionals,
which might support these changes31.
Self-assessed state of health is an important
indicator that is used worldwide32,33. In general,
individuals with higher income and educational
levels tend to better assess their state of health32,33,
which might account for the fact that the pop-ulation without health insurance coverage rat-ed their state of health poor almost three times more often compared to the insured population. In addition, the vast majority of the insured pop-ulation is inserted in the job market and, thus, is younger, with consequent better self-assessed state of health.
Both overweight and obesity exhibited in-creasing trends in both groups, which shows that the problem of excess weight is general, affecting all social groups. The obesity epidemic is a glob-al phenomenon resulting from complex causes, including increased consumption of high-cal-orie density processed foods and reduced levels
of physical activity34,35. It is worth noting that the
prevalence of excess weight did not increase from 2012 to 2013 in either group. Although this find-ing must be reassessed in the future, it already seems promising.
The variables alcohol abuse and drinking and driving remained stable throughout the inves-tigated period. The frequency of drinking and driving was higher among the population with private health insurance, which might be ac-counted for by their greater income, which allows them to own cars. Data from Vigitel indicate that the frequency of drinking and driving is higher
among the population with more schooling11.
M
alta D
Conclusions
This study was the first analysis of the trends ex-hibited by Vigitel indicators in the population with or without private health insurance from all Brazilian capitals. This study is fully justified by the relevance of monitoring indicators of risk and protection factors for NCDs, morbidi-ty and access to screening tests in various social segments aiming at the establishment of public policies for promotion and prevention and at the promotion of equity. Differences were detected
Collaborators
Malta DC participated in the study design, re-viewed the literature, performed data analysis, drafted the initial version and approved the final version of the present article; RTI Bernal partic-ipated in the study design, performed data and statistical analysis and approved the final version of the present article; M Oliveira made substan-tial contributions and approved the final version of the present article.
e C
ole
tiv
a,
20(4):1005-1016,
2015
Paula GA. Modelos de Regressão com apoio computacio-nal. São Paulo: IME-USP; 2004.
Hayward RA, Shapiro MF, Freeman HE, Corey C. Ine-qualities in health services among insured Americans. Do working-age adults have less access to medical care than the elderly? N Engl J Med 1988; 318(23):1507-1512.
Hagdrup NA, Simoes EJ, Browson, RC. Health care co-verage: traditional and preventive measures and asso-ciations with chronic disease risk factor. J Community Health 1997; 22(5):387-399.
Lima-Costa MF, Guerra HL, Firmo JO, Vidigal PG, Uchoa E, Barreto SM. The Bambuí Health and Ageing Study (BHAS): private health plan and medical care utilization by older adults. Cad Saude Publica 2002; 18(1):177-186.
Lima-Costa MA. A escolaridade afeta, igualmente, comportamentos prejudiciais à saúde de idosos e adul-tos mais jovens?: Inquérito de Saúde da Região Metro-politana de Belo Horizonte, Minas Gerais, Brasil. Epi-demiologia e Serviços de Saúde 2004; 13(4):201-208. Comissão sobre Determinantes Sociais da Saúde (CSDH). Iniqüidades em saúde no Brasil, nossa mais grave doença. [acessado 2009 jun (informar o dia)]. Disponível em: http://www.determinantes.fiocruz.br/ iniquidades.htm
Brasil. Ministério da Saúde. Instituto Nacional do Can-cer. Programa Nacional de Controle do Câncer do Colo do Útero. [acessado 2013 set 4]. Disponível em: http:// www1.inca.gov.br/inca/Arquivos/PROGRAMA_UTERO _internet.PDF.
Brasil. Ministério da Saúde (MS). Instituto Nacional do Cancer (Inca). Programa Nacional de Controle do Câncer de mama. [acessado 2013 set (dia)]. Disponível em: http://www2.inca.gov.br/wps/wcm/connect/acoes _programas/site/home/nobrasil/programa_controle _cancer_mama/deteccao_precoce
Santos IS, Ugá MAD, Porto SM. O mix público-privado no Sistema de Saúde Brasileiro: financiamento, oferta e utilização de serviços de saúde. Cien Saude Colet 2008; 13(5):1431-1440.
Brasil. Ministério da Saúde. Portaria SAS/MS nº 827, de 3 de julho de 2013. Programa nacional de qualidade da mamografia. Diário Oficial da União 2013; 4 jul. Silva JB, Magalhães HM. Initiatives in cancer control from Brazil’s Ministry of Health. Lancet Oncol 2013; 14(5):385-386.
Malta DC Silva JB O Plano de Ações Estratégicas para o Enfrentamento das Doenças Crônicas Não Transmis-síveis no Brasil e a definição das metas globais para o enfrentamento dessas doenças até 2025: uma revisão. Epidemiol. Serv. Saúde 2013; 22(1):151-164.
Lima-Costa MF, Peixoto SV, Firmo JO. A Validade da hipertensão arterial autoreferida e seus determinantes (Projeto Bambuí). Rev Saude Publica 2004; 38(5):637-642.
Vargas CM, Burt VL, Gillum RF, Pamuk ER. Validity of self-reported hypertension in the National Health and Nutrition Examination Survey III, 1988-1991. Prev Med 1997; 26(5 Pt 1):678-685.
14.
15.
16.
17.
18.
19.
20.
21.
22.
23.
24.
25.
26.
27. References
World Health Organization (WHO). Global status re-port on noncommunicable diseases 2010 [Internet]. Geneva: World Health Organization; 2011. [acrescen-tar data de acesso: ano mês dia]. Disponível em: http:// www.who.int/nmh/publications/ncd_report2010/en/ Schmidt MI, Duncan BB, Azevedo e Silva G, Mene-zes AM, Monteiro CA, Barreto SM, Chor D, MeneMene-zes PR. Chronic non-communicable diseases in Brazil: burden and current challenges. The Lancet 2011; 377(9781):1949-1961.
Malta DC, Morais Neto OL, Silva Junior JB. Apresenta-ção do plano de ações estratégicas para o enfrentamen-to das doenças crônicas não transmissíveis no Brasil, 2011 a 2022. Epidemiol. Serv. Saúde 2011; 20(4):425-438.
World Health Organization (WHO). Global action plan for the prevention and control of NCDs 2013-2020 [internet]. Geneva: WHO; 2013. [cited 2014 Jan 27]. Available from: http://www.who.int/nmh/events/ ncd_action_plan/en/
Bonita R, Magnusson R, Bovet P, Zhao D, Malta DC, Geneau R, Suh Il, Thankappan KR, Mckee M, Hos-pedales J, De Courten M, Capewell S, Beaglehole R. Country actions to meet UN commitments on non-communicable diseases: a stepwise approach. Lancet 2013; 381(9866):575-584.
Instituto Brasileiro de Geografia e Estatística (IBGE). Pesquisa Nacional por Amostra de Domicílios (PNAD 2008). Um panorama da saúde no Brasil: acesso e uti-lização dos serviços, condições de saúde: 2008. Rio de Janeiro: IBGE; 2010.
Ahluwalia JB, Bolen J, Garvin B. Health insurance cove-rage and use of selected preventive services by working age women, BRFSS 2006. J Womens Health (Larchmt) 2007; 16(7):935-940.
Nelson KM, Chapko MK, Reiber G, Boylo EJ. The as-sociation between health insurance coverage and dia-betes care; data from the 2000 behavior risk factor sur-veillance system. Health Serv Res 2005; 40(2):361-372. Lima e Costa MF. Estilos de vida e uso de serviços pre-ventivos de saúde entre adultos filiados ou não a plano privado de saúde (inquérito de saúde de Belo Horizon-te). Cien Saude Colet 2004; 9(4):857-864.
Malta Deborah Carvalho, Bernal Regina Tomie Iva-ta. Comparação dos fatores de risco e proteção de doenças crônicas na população com e sem planos de saúde nas capitais brasileiras, 2011. Rev. bras. epi-demiol. [serial on the Internet]. 2014 [cited 2014 Sep 02]; 17(Supl. 1):241-255. Available from: http:// www.scielo.br/scielo.php?script=sci_arttext&pid= S1415-790X2014000500241&lng=en. http://dx.doi.org /10.1590/1809-4503201400050019.
Brasil. Ministério da Saúde (MS). Secretaria de Vigilân-cia em Saúde. Vigitel Brasil 2012: VigilânVigilân-cia de fatores de risco e proteção para doenças crônicas por inquérito telefônico. Brasília: MS; 2013.
Bernal R. Inquéritos por telefone: inferências válidas em regiões com baixa taxa de cobertura de linhas residenciais [tese]. São Paulo: USP; 2011.
Izrael D, Hoaglin, DC, Battaglia MP. A SAS Macro for Balancing a Weighted Sample. Proceedings of the Twen-ty-Fifth Annual SAS Users Group International Confe-rence, Paper 275, 2000.
1.
2.
3.
4.
5.
6.
7.
8.
9.
10.
11.
12.
M
alta D
Ferreira SRG, Moura EC, Malta DC, Sarno F.Hiperten-são arterial autorreferida no Brasil: freqüência e fatores associados. RSP 2009; 43(2):98-106.
Florindo AA, Hallal PC, Moura EC, Malta DC. Prática de atividades físicas e fatores associados em adultos, Brasil, 2006. Rev Saude Publica 2009; 43(Supl. 2):65-73. Knuth AG, Malta DC, Dumith SC, Cimar A, Morais Neto OL, Temporão JG, Penna G, Hallal PC. Prática de atividade física e sedentarismo em brasileiros: resulta-dos da Pesquisa Nacional por Amostra de Domicílios (PNAD) 2008. Cien Saude Colet 2011; 16(9):3697-3705. Malta DC, Silva Júnior JB. Policies to promote physical activity in Brazil. Lancet 2012; 380(9838):195-196. Molarius A, Berglund K, Eriksson C, Lambe M, Nords-tröm E, Eriksson H, Eriksson HG, Feldman I. Socio-economic conditions, lifestyle factors, and self-rated health among men and women in Sweden. Eur J Public Health 2006; 17(3):125-133.
Dachs JNW, Santos APR. Autoavaliação do estado de saúde no Brasil: análise dos dados da PNAD/2003. Cien Saude Colet 2006; 11(4):887-894.
Reporter of World Health Organization (WHO) Con-sultation. Obesity: preventing and managing the global epidemic. Geneva: WHO; 2000. Technical reporter Se-ries. Nº 894. 2000.
International Association for the Study of Obesity (IASO) (2013) Adult overweight and obesity in the European Union (EU27). [acessado 2013 nov 02]. Dis-ponível em: http://www.iaso.org/resources/world-map -obesity/ Accessed novembro 2013.
Article submitted 09/23/2014 Approved 11/05/2014
Final version submitted 11/07/2014 28.
29.
30.
31.
32.
33.
34.