Microsatellite analysis of pacu broodstocks
used in the stocking
program of Paranapanema River, Brazil
Jayme Aparecido Povh
1*; Ricardo Pereira Ribeiro
2; Nelson Mauricio Lopera-Barrero
1; Carolina
Bespalhok Jacometo
2;
Lauro Vargas
2; Patrícia Cristina Gomes
2; Taís da Silva Lopes
31
UFMT/Inst. de Ciências Agrárias e Tecnológicas, Rod. MT 270, km 06 – 78735-901 – Rondonópolis, MT – Brasil.
2
UEM/Centro de Ciências Agrárias – Núcleo de Pesquisa PeixeGen, Av. Colombo, 5790 – 87020-900 – Maringá, PR – Brasil.
3
UNESP/CAUNESP – Via de Acesso Prof. Paulo Donato Castellane, s/n – 14884-900 Jaboticabal, SP – Brasil. *Corresponding author <[email protected]>
ABSTRACT: Monitoring the genetic diversity has fundamental importance for fish stocking programs. This experiment aims to evaluate the genetic diversity in two hatchery stations (A and B) with pacu Piaractus mesopotamicus (Holmberg, 1887) in Andirá, state of Paraná, Brazil used in stocking programs of Paranapanema River. Six microsatellite loci were amplified using DNA extracted from 60 fin-clipping samples. The broodstock B had the average number of alleles and the mean heterozygosity (alleles: 3.7 and HO: 0.628) higher than the broodstock A (alleles: 3.5 and HO: 0.600). Alleles with low frequency levels were observed in the both broodstocks. The positive coefficients of endogamy in the locus Pme2 (broodstock A: FIS = 0.30 and broodstock B: FIS = 0.20), Pme5 (broodstock B: FIS = 0.15), Pme14 (broodstock A: FIS = 0.07) and Pme28 (broodstock A: FIS = 0.24 and broodstock B: FIS = 0.20) indicated deficiency of heterozygotes. Presence of null allele in the locus Pme2 was detected. The negative estimates in loci Pme4 (broodstock A: FIS = - 0.43 and broodstock B: FIS = - 0.37), Pme5 (broodstock A: FIS = - 0.11), Pme14 (broodstock B: FIS = - 0.15) and Pme32 (broodstock A: FIS = - 0.93 and broodstock B: FIS = - 0.60) were indicating the excess of heterozygotes. Evidence of linkage disequilibrium and lower allelic richness was found only in the broodstock A. Nei’s gene diversity was high in both broodstocks. The genetic distance (0.085) and identity (0.918) showed similarity between broodstocks, which reflects a possible common origin. 6.05% of the total genetic variance was due to differences among broodstocks. Recent bottleneck effect in two broodstocks was observed. The results indicated a higher genetic diversity in the two broodstocks and they presented low genetic difference. This was caused by the reproductive management in both hatchery stations, reduction of population size and genetic exchange between the hatchery stations.
Key words: Piaractus mesopotamicus, genetic variability, hatchery stations, molecular markers
Análise microssatélite de estoques de reprodutores de pacu
utilizados no
programa de repovoamento do rio Paranapanema
RESUMO: O monitoramento da diversidade genética é fundamental em um programa de repovoamento. Avaliou-se a diversidade genética de pacu Piaractus mesopotamicus (Holmberg, 1887) em duas estações de piscicultura em Andirá - Paraná, Brasil, utilizadas no programa de repovoamento do Rio Paranapanema. Foram amplificados seis loci microssatélite para avaliar 60 amostras de nadadeira. O estoque de reprodutores B apresentou maior número de alelos e heterozigose (alelos: 22 e HO: 0,628) que o estoque de reprodutores A (alelos: 21 e HO: 0,600). Alelos com baixos níveis de frequência foram observados nos dois estoques. Os coeficientes positivos de endogamia no locus Pme2 (estoque A: FIS = 0,30 e estoque B: FIS = 0,20), Pme5 (estoque B: FIS = 0,15), Pme14 (estoque A: FIS = 0,07) e Pme28 (estoque A: FIS = 0,24 e estoque B: FIS = 0,20), indicaram deficiência de heterozigotos. Foi detectada a presença de um alelo nulo no lócus Pme2. As estimativas negativas nos loci Pme4 (estoque A: FIS = - 0,43 e estoque B: FIS = - 0,37), Pme5 (estoque A: FIS = - 0,11), Pme14 (estoque B: FIS = - 0,15) e Pme32 (estoque A: FIS = - 0,93 e estoque B: FIS = - 0,60) foram indicativas de excesso de heterozigotos. Foi evidenciado desequilíbrio de ligação e riqueza alélica baixa só no estoque A. A diversidade genética de Nei foi alta nos dois estoques. A distância (0,085) e identidade (0,918) genética mostraram similaridade entre os estoques, o qual reflete uma possível origem comum. 6,05% da variância genética total foi devida a diferenças entre os estoques. Foi observado um recente efeito gargalo nos dois estoques. Os resultados indicaram uma alta diversidade genética nos estoques de reprodutores e baixa diferenciação genética entre eles, o que foi causado pelo manejo reprodutivo das pisciculturas, redução do tamanho populacional e intercâmbio genético entre as pisciculturas.
Palavras-chave: Piaractus mesopotamicus, variabilidade genética, estação de piscicultura, marcadores moleculares
Introduction
In the Alto Paraná Basin, Paraná state Brazil, the
pacu is classified in the order Characiformes, family Characidae, sub-family Serrasalminae, and the species is the
Piaractus mesopotamicus (Holmberg, 1887) which is
en-demic in the Neotropical region, and widely distributed along the Paraná, Paraguay and Uruguay basins (Urbinati and Gonçalves, 2005). The pacu, which is now endangered along the Paranapanema river (Bressan et al., 2009), has been im-portant either in the wild or in the fish farming due to its important economic contribution to the national fish mar-ket (IBAMA, 2007).
In Brazil, endangering or even the extinction of many freshwater species has been caused by water pollution, soil erosion, and over fishing (Agostinho et al., 2003; Hatanaka et al., 2006). Moreover, the Paranapanema river is obstructed by ten power plants (Leuzzi et al., 2004) which have been affecting the migratory path, and modifying the life cycle of several aquatic organisms along several ecosystems (Agostinho et al., 2003). Currently, many hatchery stations are releasing juveniles for enhancing the natural populations, and reducing the adverse effects in the fish stocks of many rivers. In the State of Paraná, more than 8.5 million of ju-veniles were released into the Paranapanema, where the aim is to release 20 million of juveniles (SEAB, 2006).
Although these governmental programs have been re-leasing the juveniles for more than three decades (Agostinho et al., 2003), the broodstocks still have to be evaluated for the presence of genetic diversity, since the similarity reduces the effectiveness of the program. Therefore, monitoring the genetic diversity is of fundamental importance to the long-term success of any stocking program (Povh et al., 2008; Lopera Barrero, 2009), and the microsatellite marker is the foremost method for achieving these purposes (Calcagnotto and DeSalle, 2009; Liu et al., 2005; Ortega-Villaizán Romo et al., 2006).
In the present study, we estimated the genetic diversity of pacu reared in two hatchery stations (captive broodstock A and captive broodstock B) at Andirá, Paraná, Brazil.
Material and Methods
In May 2007, we collected 30 fin-clipping samples from each captive broodstock of pacu reared in two hatchery sta-tions (A and B) in Andirá (23º03' S and 50º13' W), Paraná, Brazil. These hatchery stations are important because they have been enhancing the fish stocking program in the Paranapanema river. These 5-year-old captive broodstocks (F1), without the introduction of new individuals, had their parents collected in the Paraná River, but there was no record of the reproductive management adopted before the estab-lishment of both broodstocks. Currently, the extrusion re-productive system (Zaniboni-Filho and Nuñer, 2004) is the most used in the two fish farms aiming to obtain offspring for stocking programs.
DNA was isolated from fin-clipping with 0.5 cm–2, and the extraction was based on the methods described by Lopera Barrero et al. (2008). Samples were treated with 550 μL lise buffer (50 mM Tris-HCl, 50 mM EDTA, 100 mM NaCl, and 1% SDS), 7 μL–1 proteinase K (200 μg mL–1) per sample, and incubated overnight at 50ºC. Then, 600 μL–1
5 M NaCl were
added to each sample before being centrifuged for 10 min at 12,000 rpm. The aqueous layer was removed carefully to new microtubes where the DNA was precipitated with 700 μL of freezing ethanol and incubated later at - 20ºC for 2 h. The DNA samples were centrifuged again, washed with 700 μL 70% ethanol, re-suspended in TE buffer (10 mM Tris and 1 mM EDTA), and treated with with 6 μL–1
RNAse (30 μg mL–1
) at 38ºC for 40 min. The DNA was quantified by com-paring concentrations of DNA fago λ in 1% agarose gel. The electrophoresis was carried out in TAE 1X (40 mM Tris-ac-etate and 1 mM EDTA) buffer at 70 V for 1 h, the profile was visualized under UV-radiation, and photographed with Kodak EDAS-290 (Kodak 1D Image analysis 3.5).
The DNA was amplified to 20 μL–1
by using the buffer 1X Tris-KCl, 2.0 mM MgCl2, 0.8 μM from each primer (for-ward and reverse), 0.2 mM dNTP, one unit of Platinum Taq
DNA polymerase and 20 ng–1
DNA. The following primers (Calcagnotto et al., 2001) were used: Pme2 (GenBank acces-sion AF362445), Pme4 (AF362446), Pme5 (AF362447), Pme14 (AF362448), Pme28 (AF362451) and Pme32 (AF362452). The PCR reactions were performed with Eppendorf Mastercycler Gradient thermocycler under the following conditions: initial denaturation for 4 min at 94ºC, 30 cycles of 30 s, denaturation at 94ºC, 30 s at a primer-spe-cific annealing temperature (Table 1), and 1 min of exten-sion at 72ºC followed by final extenexten-sion for 10 min at 72ºC.
The amplified samples were submitted to gel electro-phoresis by using 10% polyacrylamide (acrylamide:bisacrylamide – 29:1), denaturant (6 M urea), and 1X TBE buffer (90 mM Tris-Borate and 2 mM EDTA) by using 50 mA for 7 hrs. The alleles were detected by silver nitrate according to Bassan et al. (1991). In the present case, the gel was fixed by using 10% ethanol and 0.5% acetic acid for 20 minutes, coloured by 6 mM Ag2NO3 for 10 minutes, and fixed by 0.75 M of NaOH and 0.22% of 40% formal-dehyde. A Sony digital camera DSC-P93A was used to pho-tograph the gels. The size of the alleles was calculated by using the Kodak EDAS-290 program, and the 10 bp and 50 bp DNA Ladders were used as the markers.
The number and frequency of alleles, the observed (HO) and the expected (HE) heterozygosity, and the Hardy-Weinberg equilibrium were calculated by using the GENEPOP 4.0.6 (Rousset, 2007). Tests for Hardy– Weinberg’s equilibrium (EWH) at every locus was based on a test analogous to the Fisher’s exact test for the Markov-chain method (Markov Markov-chain length: 100,000; dememorizations: 10,000) which was run in the same statis-tical software. The significance of P-values was adjusted fol-lowing Bonferroni sequential corrections for multiple simul-taneous statistical tests (Rice, 1989), with an initial alpha value of 0.05 k, k being the number of tests. To test the possibil-ity of null allele occurrence, which can be one of the causes of heterozygote deficiencies, we estimated the expected fre-quency of a presumed null allele using the MICRO-CHECKER 2.2.3 program (Van Oosterhout et al., 2004). This program was also used to test the effect Wahlund in the EWH deviation.
ad-dress the EWH deviation. FIS from each broodstock for each locus was calculated using FSTAT 2.9.3.2 (Goudet, 2002). The distortion from independent segregation of genotypes (linkage disequilibrium) was tested using the exact test (Markov chain: dememorization: 1000; batches: 100; iterations per batch: 1000) (Guo and Thompson, 1992) facilitated also by GENEPOP 4.0.6. To quantify hierarchical genetic varia-tion between broodstocks, the analyses of molecular vari-ance (AMOVA) was performed following Excoffier et al. (1992) using the program ARLEQUIN version 2.0 (Excoffier et al., 2005). The genetic distance and identity and Nei’s gene diversity were calculated by using the POPGENE 1.31 (Yeh et al., 1999). A recent reduction of effective population size (bottleneck) was tested in the broodstocks using the BOTTLENECK version 1.2.02 program (Cornuet and Luikart, 1996). The Duncan test was used to determine dif-ferences between means.
Results and Discussion
All six primer pairs used in this study were polymorphic and amplified consistent and reproducible microsatellite alle-les with the allele size ranging from 182 (Pme5) to 247 bp (Pme32). The average number of alleles per locus per broodstock ranged from 3.5 (± 1.05) in A to 3.7 (± 1.21) in B
(Table 1). Alleles with low frequency levels (lower than 0.1) were observed in the broodstock A (Pme2: 213 bp; Pme4: 191 bp; Pme5: 186 bp; Pme14: 203 bp and Pme32: 247 bp) and the broodstock B (Pme5: 187 bp). The allele with 203 bp in the locus Pme5 was not detected in the broodstock A (Table 1).
The broodstock A had the observed heterozigosity (HO) in the loci Pme5 and Pme32 higher than the broodstock B, which had higher number of heterozygotes in the loci Pme2, Pme4, Pme14 and Pme28. The average Ho was slightly higher (0.628 ± 0.29) in the broodstock B than in the A (0.600 ± 0.18) (Duncan test, p < 0.05) (Table 2). The difference be-tween the broodstocks for both the observed and the mean heterozygosity was small (p < 0.05). However, the highest number of alleles under low frequency levels, and the ab-sence of the 203 bp allele (locus Pme5) in the broodstock A may contribute to indicating low genetic diversity in this broodstock. Changes in the frequencies of alleles and the ab-sence of alleles in commercial stocks may be due to genetic drift and inbreeding that creates differentiation processes, with according Cameron-Brown et al. (2005) are caused by low effective population size (Ne). Therefore, some alleles of the broodstock A can be eliminated in the next generations (Innes and Elliott, 2006).
The positive coefficients of endogamy in the locus Pme2 (broodstock A: FIS = 0.30 and broodstock B: FIS = 0.20),
Locus Primer sequence (5'- 3') Motif T S A Broodstock
A A
Broodstock B
Pme2
F: TGGGTGCACAGCACAGTAAC (GT)18 60 195 5 0.117 5 0.200
R: TTTGCATTTCTGGTGCAAAG 205 0.267 0.117
207 0.450 0.250
210 0.117 0.283
213 0.050 0.150
Pme4
F: CATGCTGCTGCAGATTAGAC (GT)14 60 191 4 0.036 4 0.196
R: CGCTTGCAATTTAACGCAGT 200 0.518 0.446
202 0.304 0.196
203 0.143 0.161
Pme5
F: CAGAGCATCTGGAGGGACAT (GA)10 gggagctggta
(GT)10 C(GT)12 60 182 4 0.317 5 0.357
R: TCTGAGACACTGATATCTAAACACACA 186 0.083 0.107
187 0.250 0.054
200 0.350 0.268
203 0 0.214
Pme14
F:ACCGTTATGCCCTACCCTTC (CTG)7 62 195 3 0.183 3 0.250
R: GCGTTCTAGACAGAACTCATGG 200 0.783 0.596
203 0.033 0.154
Pme28 F: CCCAGAAGAGTGGAAGCTGT (GT)15 60 209 2 0.138 2 0.362
R: TGGTGGGAATTGACAAGAAA 214 0.845 0.638
Pme32
F: GCGAGAAATCTGCCTGTGAC (CTG)7 66 242 3 0.482 3 0.310
R: AGGAGGGCATCATGGAGAA 245 0.500 0.500
247 0.018 0.190
Table 1 – Characterization of loci investigated and frequency of alleles in Piaractus mesopotamicus broodstocks.
Pme5 (broodstock B: FIS = 0.15), Pme14 (broodstock A: FIS
= 0.07) and Pme28 (broodstock A: FIS = 0.24 and broodstock B: FIS = 0.20) indicating deficiency of heterozygotes. The MI-CRO-CHECKER software analysis only detected the pres-ence of null allele in this locus. In contrast, the negative esti-mates in loci Pme4 (broodstock A: FIS = - 0.43 and broodstock B: FIS = - 0.37), Pme5 (broodstock A: FIS = - 0.11), Pme14 (broodstock B: FIS = - 0.15) and Pme32 (broodstock A: FIS = - 0.93 and broodstock B: FIS = - 0.60) are indicating the excess of heterozygotes.
In both captive broodstocks, the deficiency of heterozy-gotes in the locus Pme2 may be not attributed to the in-breeding. Probably, the presence of null alleles indicated by MICRO-CHECKER analysis for this locus is contributing to reduce the heterozygosity levels. Unfortunately, the man-agement decisions that were made to rear the present broodstocks are unknown. On the other hand, the excess of heterozygotes indicate that despite the presence of het-erozygote deficiency in loci Pme2, Pme5, Pme14 e Pme28 the broodstock is not experiencing a process of inbreeding. A significant (p > 0.05) Wilcoxon test and the shift-mode of allele frequency distribution obtained by BOTTLENECK program, showed that a recent bottleneck had occurred in two broodstocks, sug gesting that a severe reduction of population size occurred. Usually bottleneck is always accom-panied by homozygote excess, which causes a reduction of genetic variability.
Endogamy, small effective number of contributing par-ents (Ne), inappropriate selection of parents, founder effect and the misuse of the reproduction period are some con-straints capable of inducing losses in the genetic variability (Povh et al., 2008). The breeding system used in mating (Lopera Barrero et al., 2010; Povh et al., 2010) and the use of sequential or simultaneous semen during artificial fertili-zation (Withler and Beacham, 1994) are also factors that may affect the genetic variability of progeny used in stocking pro-grams. Reproductive management is of fundamental impor-tance to preserve the genetic diversity of juveniles which will participate in the stocking programs. Nonetheless, the en-hancing programs may have less survival of juveniles and, consequently, the populations in the wild will be permanently
affected. The analysis of the genetic differences between the captive broodstocks and populations in the wild is also very important because every one has specific genes for local adapt-ability, and consequently the survival of juveniles will be af-fected (Sønstebø et al., 2007; Vasemägi et al., 2005).
Evidence of linkage disequilibrium (p < 0.05) was found only for Pme4 × Pme32 locus pair in the broodstock A. This disequilibrium may be due to the number of samples col-lected. These results are similar to those obtained by Povh et al. (2010) where they observed different patterns of link-age disequilibrium in the parental and progeny fishes, with-out affecting the estimates of genetic diversity.
Both broodstocks had deviations in the Hardy-Weinberg equilibrium (EWH) for the loci Pme2, Pme4 and Pme32 af-ter sequential Bonferroni correction (p < 0.008) (Table 2). Al-though HWE deviations may be due to the presence of null alleles, detected to Pme2 locus, the influence of the Wahlund effect can not be dismissed in these populations, which also showed excess of heterozygotes for other loci.
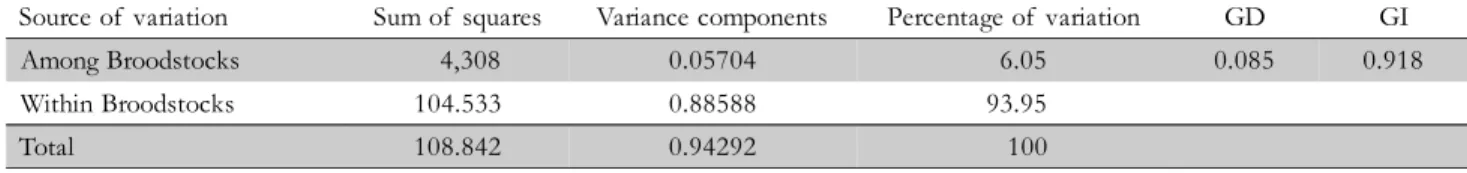
Nei’s gene diversity (hs) was high in both broodstocks. It was found that this measurement of genetic variation ranged from 0.52 (± 0.19) to 0.64 (± 0.12) for the broodstocks A and B, respectively (Table 2). The Duncan test showed differences among broodstocks for HO and hs pa-rameters (p > 0.05). The genetic distance (0.085) and iden-tity (0.918) showed similarity between broodstocks, which reflects a possible common origin. However, 6.05% of the total genetic variance was due to differences among broodstocks (p < 0.001) (Table 3).
These results may be due to broodstocks expressing pro-files of populations which could have been collected along the Basin of the Paraná River because this fact explains the differences in the heterozygosity and in the frequency of al-leles. However, it is not possible to verify this hypothesis, since there is no information to report differences between natural populations of these rivers. Calcagnotto and DeSalle (2009) analyzed the genetic structure of P. mesopotamicus
natural populations sampled inside and outside the Pantanal of Mato Grosso state, and did not observe a positive corre-lation between the genetic differentiation and the natural loga-rithm of geographical distances and when the sampling sites
Locus Broodstock A Broodstock B
HO HE FIS EWH hs NA HO HE FIS EWH hs NA
Pme2 0.50NS 0.71 0.30 0.004** 0.70 5.0 0.63NS 0.79 0.20 0.003** 0.78 5.0
Pme4 0.83** 0.59 - 0.43 0.011** 0.62 4.0 0.90** 0.66 - 0.37 0.000** 0.70 4.0
Pme5 0.80** 0.72 - 0.11 0.060NS 0.71 4.0 0.60NS 0.70 0.15 0.118NS 0.74 5.0
Pme14 0.33NS 0.36 0.07 0.515NS 0.35 3.0 0.57** 0.49 - 0.15 0.144NS 0.56 3.0
Pme28 0.20NS 0.26 0.24 0.053NS 0.24 2.0 0.37NS 0.45 0.20 0.416NS 0.46 2.0
Pme32 0.93** 0.49 - 0.93 0.000** 0.52 3.0 0.70** 0.44 - 0.60 0.000** 0.62 3.0 Mean 0.60 b 0.52 b - 0.16 - 0.52 b 3.5 0.63 a 0.59 a - 0.09 - 0.64 a 3.7
Table 2 – Observed (HO) and expected (HE) heterozygosities, coefficient of endogamy (FIS), probability test for the Hardy-Weinberg equilibrium (PHW), Nei’s gene diversity (hs) and number of alleles by locus (NA) in loci investigated in broodstocks of Piaractus mesopotamicus.
were compared there were also no genetic differentiation among them. Furthermore, Lervolino et al. (2010), using the D-loop control region of mtDNA sequence data to investi-gate genetic variability within and among populations of P. mesopotamicus in the different rivers in the Upper-Paraguay Basin, observed the absence of genetic differentiation, sug-gesting that the populations could be treated as a single ge-netic stock. Differences could also be caused by the repro-ductive management in both hatchery stations, which could be the cause of the low genetic diversity in the broodstock A. Therefore, special care with the reproductive management will be of fundamental importance for enhancing and then maintain the genetic diversity in the broodstock A.
The excess of heterozygotes (loci Pme4, Pme5, Pme14 and Pme32) and the average FIS may be an indication of the genetic exchange between the hatchery stations, a fact that could explain the low genetic difference between both cap-tive broodstocks (genetic distance: 0.085). This excess of het-erozygotes may also indicate the breakdown of the Wahlund effect if they have been trained by fish collected from differ-ent locations of the Paraná River. However, the contribu-tion of this effect in valued broodstocks should not be dis-carded. Calcagnotto et al. (2001) collected pacu in the Pantanal Basin, Mato Grosso, Brazil, and found different lev-els of the observed heterozygosity after analysing six microsatellite loci. Calcagnotto et al. (2001) found high lev-els of heterozygosity in the loci Pme2 (0.852), Pme14 (0.667), and Pme28 (0.643), but low levels in Pme4 (0.656) and Pme32 (0.200) in comparison to the responses from the present broodstocks (Table 1). However, in the locus Pme5 they found heterozigosity of 0.606 which was slightly higher than the present result from the broodstock B (0.600), but lower than found in the A (0.800). In all the loci, these au-thors detected a higher number of alleles ranging from 7 (Pme4) to 10 (Pme2 and Pme28), except in the locus Pme32 that had the same three alleles (Table 1). They had an aver-age of 6.5 alleles per locus in comparison to 3.6 observed in the present study. These results may have also been caused by the fish origin, founder effects, and management deci-sions.
Currently, stocking programs have been the best alterna-tive to the other methods for enhancing the naalterna-tive fish popu-lations or the threatened species (Barroso et al., 2005; Lopera-Barrero, 2009). However, the reduction in the genetic diver-sity can make the enhancement program inefficient, which means less survival of juveniles in the freshwater ecosystems and, therefore, irreversible effects on the native populations. Lopera-Barrero et al. (2009) to analyze P. mesopotamicus
broodstocks used in stocking programs, recommended
year-round evaluation of broodstocks used in this programs, of their offspring released in rivers, and of native populations to monitor the effectiveness of these programs and the pos-sible effects on the ecosystem.
The genetic monitoring of broodstock and juveniles is important, and has to be included in the routine tests be-cause this decision will make the reproductive management more efficient (Lopera-Barrero et al., 2009). Therefore, the broodstock used in stocking programs, as analyzed in this study, should begin with a large number of carefully selected individuals (Aho et al., 2006). The correct chioce of the re-producers to be used in the formation of broodstock and their genetic evaluation can offer important bases for formu-lating reproductive management strategies (Sønstebø et al., 2007). These strategies will permit safe exchange of broodstocks among fish farms stations to break up cycles of endogamy that are common in controlled environments (Moreira et al., 2007). Finally, monitoring the genetic diver-sity in conjunction with conservative decisions should be made in the present freshwater ecosystems. For this purpose, microsatellite markers have been used successfully in this pa-per and can be used to discriminate genotypes with breed-ing objectives (Muzzalupo et al., 2009), stockbreed-ing programs (Povh et al., 2010) and conservation (Lopera Barrero, 2009).
Acknowledgements
To the Research Bureau in the State of Paraná for pro-viding the funds for this study, the undergraduate students and the technicians for the important contributions to the success of this experiment.
References
Agostinho, A.A.; Gomes, L.C.; Suzuki, H.I.; Júlio Jr, H.F. 2003. Migratory fish of upper Paraná River basin, Brazil. p. 19-99. In: Carolsfeld, J.; Harvey, B.; Baer, A.; Ross, C., eds. Migratory fishes of South America: biology, fisheries, and conservation status. World Fisheries Trust, Victoria, BC, Canada.
Aho, T.; Rönn, J.; Piironen, J.; Björklund, M. 2006. Impacts of effective population size on genetic diversity in hatchery reared Brown trout (Salmo trutta L.) populations. Aquaculture 253: 244-248. Barroso, R.M.; Hilsdorf, A.W.S.; Moreira, H.L.M.; Cabello, P.H.;
Traub-Cseko, Y. 2005. Genetic diversity of wild and cultured populations of Brycon opalinus (Cuvier, 1819) (Characiforme, Characidae, Bryconiae) using microsatellites. Aquaculture 247: 51-65. Bassan, B.J.; Caetano-Anollés, G.; Gresshoff, P.M. 1991. Fast and sensitive
si lve r stai ning of DNA i n p oly acrylamid e ge ls. An aly tic al Biochemistry 196: 80-83.
Brazilian Institute of Environment and Natural Resources [IBAMA]. Fishing Statistics 2007. Brazil: Major Regions and Federative Units. IBAMA, Brasília, DF, Brazil. (in portuguese).
Source of variation Sum of squares Variance components Percentage of variation GD GI
Among Broodstocks 4,308 0.05704 6.05 0.085 0.918
Within Broodstocks 104.533 0.88588 93.95
Total 108.842 0.94292 100
Bressan, P.M.; Kierulff, M.C.M.; Sugieda, A.M. 2009. Threatened Fauna in the São Paulo State: Vertebrates. Zoological Park Foundation of São Paulo/Department of the Environment, São Paulo, SP, Brazil. (in Portuguese).
Britto, S.G.C.; Sirol, R.N.; Vianna, N.C.; Jardim, M.S.; Santos, J.C.; Pelisari, E. 2003. Fish of Paranapanema river. Duke Energy Internacional/ Geração Paranapanema, São Paulo, SP, Brazil. (in Portuguese). Calcagno tto, D.; Russel lo, M.; De sal le, R. 2001. Isolatio n and
characterization of microsatellite loci in Piaractus mesopotamicus and their applicability in other Serrasalminae fish. Molecular Ecology Notes 1: 245-247.
Calcagnotto, D.; DeSalle, R. 2009. Population genetic structuring in pacu (Piaractus mesopotamicus) across the Paraná-Paraguay basin: evidence from microsatellites. Neotropical Ichthyology 7: 607-616.
Cameron-Brown, R.; Woolliams, J.A.; McAndrew, B.J. 2005. Factors influencing effective population size in commercial populations of gilthead seabream, Sparus aurata. Aquaculture 247: 219-225. Cornuet, J.M. ; Luikart, G. 1996. Description and power analysis of
two tests for detecting recent population bottlenecks from allele frequency data. Genetics 144: 2001-2014.
Excoffier, L.; Laval, G.; Schneider, S. 2005. Arlequin ver. 3.0: an integrated so ftware package for po pul ati on gen eti cs dat a anal ysi s. Evolutionary Bioinformatics Online 1: 47-50.
Excoffier, L.; Smouse, P.E.; Quattro, J.M. 1992. Analysis of molecular variance inferred from metric distances among DNA haplotypes: application to human mitochondrial DNA restriction data. Genetics 131: 479-491.
Goudet, J. 2002. FSTAT, a program to estimate and test gene diversities an d f ixatio n i ndi ces (version 2.9.3.2). Avail abl e at h ttp // www.unil.ch/izea/softwares/fstat.html. [Accessed Jul. 10, 2010]. Guo, S.; Thompson. E. 1992. Performing the exact test of
Hardy-Weinberg proportion for multiple alleles. Biometrics 48: 361-372. Hatanaka, T.; Henrique-Silva, F.; Galetti Jr, P.M. 2006. Population substructuring in a migratory freshwater fish Prochilodus argenteus (Characiformes, Prochilodontidae) from the São Francisco River. Genetica 126: 513-517.
Innes, B.H.; Elliott, N.G. 2006. Genetic diversity in a Tasmanian hatchery population of Atlantic salmon (Salmo salar L.) compared with its Canadian progenitor population. Aquaculture Research 37: 563-569.
Lervolino, F.; Resende, E.K.; Hilsdorf, A.W.S. 2010. The lack of genetic differentiation of pacu (Piaractus mesopotamicus) populations in the Upper-Paraguay Basin revealed by the mitochondrial DNA D-loo p reg ion: i mplic ation s for fishe ry management. F isheries Research 101: 27-31.
Leuzzi, M.S.P.; Almeida, F.S.; Orsi, M.L.; Sodré, M.L.K. 2004. Analysis by RAPD of the genetic structure of Astyanax altiparanae (Pisces, Characiformes) in reservoirs of the River Paranapanema. Genetics and Molecular Biology 27: 355-362.
Liu, Y.; Chen, S.; Li, B. 2005. Assessing the genetic structure of three Japanese flounder (Paralichthys olivaceus) stocks by microsatellite markers. Aquaculture 243: 103-111.
Lopera-Barrero, N.M.; Povh, J.A.; Ribeiro, R.P.; Gomes, P.C.; Jacometo, C.B.; Lopes, T.S. 2008. Comparison of DNA extraction protocols of fish fin and larvae samples: modified salt (NaCl) extraction. Ciencia e Investigación Agraria 35: 65-74.
Lopera Barrero, N.M. 2009. Conservation of Brycon orbignyanus natural po pul ati ons an d stoc ks for th eir re pro duc tive, gen eti c, environmental sustainability: a model for species threatened with extinction. Ciencia e Investigación Agraria 36: 191-208.
Lopera Barrero, N.M.; Ribeiro, R.P.; Povh, J.A.; Vargas, L.; Jacometo, C.B.; Gomes, P.C. 2009. Genetic diversity in Piaractus mesopotamicus stocks used in stock enhancement programs and implications for conservation. Agrociencia 43: 249-256.
Lopera Barrero, N.M.; Vargas, L.; Sirol, R.N.; Ribeiro, R.P.; Povh, J.A.; Streit Jr, D.P.; Gomes, P.C. 2010. Genetic diversity and reproductive contribution of Brycon orbignyanus offspring in the semi-natural reproductive system using microsatellites markers. Agrociencia 44: 171-181.
Moreira, A.A.; Hilsdorf, A.W.S.; Silva, J.V.; Souza, V.R. 2007. Genetic variability of two Nile Tilapia strains by microsatellites markers. Pesquisa Agropecuaria Brasileira 42: 521-526. (in Portuguese, with abstract in English).
Muzzalupo, I.; Stefanizzi, F.; Salimonti, A.; Falabella, R.; Perri, E. 2009. Microsatellite markers for identification of a group of Italian olive accessions. Scientia Agricola 66: 685-690.
Ortega-Villaizán Romo, M.M.; Aritaki, M.; Taniguchi, N. 2006. Pedigree analysis of recaptured fish in the stock enhancement program of spotted halibut Verasper variegatus. Fisheries Science 72: 48-52. Povh, J.A.; Ribeiro, R.P.; Sirol, R.N.; Streit Júnior, D.P.; Lopera-Barrero,
N.M.; Vargas, L.; Gomes, P.C.; Lopes, T.S. 2008. Genetic diversity of pacu from the Paranapanema River and from the broodstock of a stock enhancement program. Pesquisa Agropecuária Brasileira 43: 201-206. (in Portuguese, with abstract in English).
Povh, J.A.; Ribeiro, R.P.; Sirol, R.N.; Streit Jr, D.P.; Moreira, H.L.M.; Siewerdt, F.; Lopera Barrero, N.M.; Mangolin, C.A.; Vargas, L. 2010. Microsatellite analysis of the parental contribution of Piaractus mesopotamicus to the production of offspring in the semi-natural sy ste m o f repro duc tio n. Brazil ian Archi ves of Bio log y and Technology 53: 389-396.
Rice, W.R. 1989. Analyzing table of statistical tests. Evolution 43: 223-225.
Rousset, F. 2007. Genepop 2007: a complete re-implementation of the GENEPOP software for Windows and Linux. Molecular Ecology Research 8: 103-106.
Secretaria da Agricultura e do Abastecimento do Paraná [SEAB]. 2006. Fish stock enhancement program of Paraná river. Available at http://www.agenciadenoticias.pr.gov.br. [Accessed Jul 9, 2010]. (in Portuguese).
Sønstebø, J.H.; Borgstrøm, R.; Heun, M. 2007. Genetic structure of brown trout (Salmo trutta L.) from the Hardangervidda mountain plateau (Norway) analyzed by microsatellite DNA: a basis for conservation guidelines. Conservation Genetics 8: 33-44. Urbinati, E.C.; Gonçalves, F.D. 2005. Pacu (Piaractus mesopotamicus).
p. 225-255. In: Baldisserotto, B.; Gomes, L.C., eds. Native species for hatchery stations in Brazil. UFSC, Santa Maria, SC, Brazil. (in Portuguese).
Van Oosterhout, C.; Hutchinson, W.F.D.; Wills, P.M.; Shipley, P. 2004. MICRO-CHECKER: software for identifying and correcting genotyping errors in microsatellite data. Molecular Ecology Notes 4: 535-538.
Vasemägi, A.; Cross, R.; Paaver, T.; Koljonen, M.L.; Nilsson, J. 2005. Extensive immigration from compensatory hatchery releases into wild Atlantic salmon population in the Baltic sea: spatio-temporal analysis over 18 years. Heredity 95: 76-83.
Withler, R.E.; Beacham, T.D. 1994. Genetic consequences of the simultaneous or sequential addition of semen from multiple males during hatchery spawning of chinook salmon (Oncorhynchus tshawytscha). Aquaculture 126: 11-23.
Yeh, F.C.; Boyle, T.Y.Z.; Xiyan, J.M. 1999. POPGENE Version 131: Mi cro sof t Windo w-Base d F ree ware f or Pop ulat ion Ge net ic Analysis. University of Alberta/Center for International Forestry Research, Alberta, AB, Canada.
Zaniboni-Filho, E.; Nuñer, A.P.O. 2004. Physiology of reproduction and artificial propagation of fish. p. 45-73. In: Cyrino, J.E.P.; Urbinati, E.C.; Fracalossi, D.M.; Castagnolli, N., eds. Special topics in tropical freshwater fish farming intensive. TecArt, São Paulo, SP, Brazil. (in Portuguese).