(Holmberg, 1887) in the pantanal of Mato Grosso do Sul, Brazil
Peixer, J.
a*, Catella, AC.
band Petrere Júnior, M.
a*
aDepartamento de Ecologia, UNESP, Av. 24A nº1515, CP 199, CEP 13506-900, Rio Claro, SP, Brazil bEMBRAPA Pantanal, Rua 21 de Setembro, 1880, CP 109, CEP 79320-900, Corumbá, MS, Brazil
*e-mail: mpetrere@rc.unesp.br, janicepx@hotmail.com
Received October 10, 2005 – Accepted November 16, 2005 – Distributed August 31, 2007 (With 3 figures)
Abstract
Among the several fish species comercially exploited at the Pantanal of Mato Grosso do Sul, the “pacu” (Piaractus mesopotamicus) stands as one of the most important. Information regarding its exploitation level is necessary for the
proper management of its stocks. Between 1996 and 1997 data on total length of the pacu were collected on a monthly basis from specimens caught by professional and sport fishers in the municipality of Corumbá. These data were used to estimate growth parameters and to assess the exploitation level for this species, applying the Beverton and Holt yield per recruit model. Length frequency analysis, carried out with the software FISAT (ELEFAN), was used to estimate growth parameters: 1996: L∞ = 87.20 cm; K = 0.34 year-1; φ´=3.41; C = 0.74; WP = 0.81; Longevity = 8.40 years;
and 1997: L∞ = 86.50 cm; K = 0.34 year-1; φ´=3.40; C = 0.60; WP = 0.80; Longevity = 8.40 years. The value for
t0 is –0.363 years for mean values of L∞ and k. The weight-length relationship, calculated from data derived from experimental fisheries carried out in 1999 and 2000, is described by the equation: W = 0.048LF2.835. Estimated
mortalities and survival rates were: 1996: Z = 1.51 year-1; M = 0.62 year-1; F = 0.89 year-1; S = 21.9%; and 1997:
Z = 1.65 year-1; M = 0.63 year-1; F = 1.02 year-1; S = 19.1%. The yield per recruit analysis showed the following
val-ues: FPresent = 0.96 year-1; F
max = 0.67 year-1 ; F0.1 = 0.51 year-1 (for Lc = 26.7 cm). These results suggest that the pacu is
overexploited in the area, so that restrictive measures are in need to manage the pacu fisheries.
Keywords: pacu, Piaractusmesopotamicus, yield per recruit, Pantanal, Brazil.
Rendimento por recruta do pacu
Piaractus mesopotamicus
(Holmberg, 1887)
no Pantanal de Mato Grosso do Sul, Brasil
Resumo
O pacu (Piaractus mesopotamicus) é uma das espécies mais capturadas no Pantanal de Mato Grosso do Sul, e para manejá-lo adequadamente são necessárias informações a respeito do seu nível de explotação. Nos anos de 1996 e 1997 foram coletadas amostras mensais de comprimentos de pacu capturados por pescadores profissionais e esportivos desembarcados em Corumbá, Pantanal de Mato Grosso do Sul (MS), com o objetivo de estimar os parâmetros de cres-cimento e o seu nível de explotação. Para a determinação do nível de explotação foi utilizado o modelo de rendimento por recruta de Beverton e Holt. Através da análise de freqüência de comprimento, pelo pacote FISAT (ELEFAN), fo-ram estimados os parâmetros de crescimento, com os seguintes valores: 1996: L∞ = 87,20 cm; K = 0,34 ano-1; φ´= 3,41;
C = 0,74; WP = 0,81; Longevidade = 8,40 anos; e 1997: L∞ = 86,50 cm; K = 0,34 ano-1; φ´= 3,40; C = 0,60; WP = 0,80;
Longevidade = 8,40 anos. O valor de t0 é –0,363 para os valores médios de L∞ e k. A relação peso-comprimento foi de-terminada através de dados de pescarias experimentais em 1999 e 2000, e foi a seguinte: W = 0,048 LF2.835. As taxas de
mortalidade estimadas e a taxa de sobrevivência foram: 1996: Z = 1,51 ano-1; M = 0,62 ano-1; F = 0,89 ano-1; S = 21,9%;
e 1997: Z = 1,65 ano-1; M = 0,63 ano-1; F = 1,02 ano-1; S = 19,1%. A análise de rendimento por recruta apresentou os
seguintes resultados: Fatual = 0,96 ano-1; F
máx= 0,67 ano-1 ; F0,1 = 0,51 ano-1 (quando Lc = 26,7 cm). Este resultado indica
que o pacu está sobreexplotado, e assim há necessidade de se estabelecer medidas restritivas para sua pescaria.
Palavras-chave: pacu, Piaractus mesopotamicus, rendimento por recruta, Pantanal, Brasil.
1. Introduction
For an adequate management of a species, detailed information on its growth parameters, as a life-history component, is central in understanding its population
such as the Pantanal, growth also depends on the annual flooding cycles (Barco et al., 1993). Growth parameters can be estimated from morphological analysis of the growth of calcified structures such as otholits and scales, as well as from mark-recapture studies and from length frequency analysis.
The simplest model for the analysis of stock man-agement is based on the surplus production (Hilborn and Walters, 1992). However, this model requires a long series of catch and effort data. Whenever age determina-tion is difficult, or a long series of catch and effort data is unavailable, models based on yield per recruit offer a valuable alternative (Holden, 1995). Holden (1995) sug-gests that yield per recruit curves offer a simple and clear way for managers involved in fisheries to take decisions regarding, for example, the advantages of reducing mor-tality rates and/or increasing the minimum age of recruit-ment for fisheries.
Silva (1986) estimated the mean length of first ma-turity of the pacu Piaractus mesopotamicus as 43 cm. Ferraz de Lima (1984a) estimated in 42 cm the mean length for females to be ready for reproduction (L50). Based on the surplus production analysis carried out by Catella (2001), the mean minimum length for catch of pacu increased from 40 to 45 cm in 2000.
The main objective of this study is to determine the growth parameters for the pacu caught by hook, the only permitted fishing gear in the region, and use them for the yield per recruit analysis.
2. Material and Methods
2.1. Data collection
Between 1996 and 1997, data on the total length of the pacu were collected on a monthly basis from speci-mens caught by professional and sport fishers in the municipality of Corumbá, State of Mato Grosso do Sul, Brazil.
The furcal length (FL, cm), the distance between the tip of the nose and the fork of the caudal fin, was used as a proxy for the length measurement. This measurement is easy to obtain using an ichtyometer and thus, relatively free from errors, and avoids the problems associated with mutilated caudal fins.
A research team from EMBRAPA-Pantanal collected data from the professional fisheries. These data were col-lected from fishes landed at the Cooperativa de Pesca de Corumbá – COOPECOR, from the fish markets of Praia Vermelha and from the Colônia de Pescadores (Fisher´s Colony) Z01, at Porto Geral. The fishers of COOPECOR mostly operate along the length of the Paraguay River, above Corumbá, at the lower passage of the Cuiabá River (locally known as São Lourenço River), and at the vicini-ties of the Pantanal Mato-Grossense National Park. The fish markets at Praia Vermelha acquire the fish caught in the Paraguay River, close to Corumbá, and Z01 operates along the Paraguay River. We did not weigh the fish due
to lack of facilities and proper scales at each sampling site.
Data from hook ad line sport fisheries came from fish caught by tourists that use local facilities for fish-ing in the Pantanal. An employee was trained to collect furcal length data. The sport fishers operated downriver and upriver from Corumbá. These samples were taken just from March to October of 1996 and 1997, due to the fishing ban in the Pantanal which lasts from November to February.
Data from experimental fishing carried out be-tween November 1999 and January 2000, weight (here we could use a scale) and length measurements, were used to establish the relationships between body weight (WC), total length (LT), furcal length (LF) and standard length (LS) for the pacu.
2.2. Estimate of the von Bertalanffy growth in length model parameters
Growth parameters were estimated using the pro-gram FISAT (FAO–ICLARM Stock Assessment Tools). ELEFAN (Eletronic Length Frequency Analysis; Pauly and David, 1981) is a module within this program that specifically uses length frequency data.
Vaz (2001) compared several methods to estimate growth parameters of pacu and concluded that ELEFAN was the most adequate. She also used scales to identify age rings and carried out a length frequency analysis, concluding that the latter is the most appropriate.
The growth equation used by ELEFAN is the season-al Von Bertseason-alanffy growth function (VBGF) (Gayanilo and Pauly, 1997).
The current methodology is not fully explained here due to lack of space, although it is explained at length in Sparre and Venema (1997)
2.3. Index of growth performance (φ´)
This index was calculated according to the formula proposed by Pauly (1979):
φ´ = log10K + 2.(log10L∞) (1)
2.4. Longevity (Tm)
Taylor (1960) model was used to estimate longev-ity:
A t
K
0 95. = 0+ 2 996.
æ è
ççç öø÷÷÷÷ (2) To estimate t0 the empirical formula of Pauly and Martosubroto (1980) was used:
log(–t0) = –0.3922 – 0.2752.logL∞ – 1.038.logK (3)
2.5. Total mortality (Z)
Z k L L L L = • -• - ¢ Ê Ë
Á ˆ¯˜ (4)
where Z = Coefficient of total mortality (year-1);
L´ = Minimum adopted catch length (cm) (this measure was used because no data on gear selectivity was avail-able; the original equation assumes that this parameter is equal to the smallest length in the sample); and L = Mean length of all fishes with lengths above L’ (cm)
Total mortality was also estimated accordingly to Ault and Ehrhardt (1991) apud (Gayanilo and Pauly, 1997):
L L
L L Z L
Z K • -• - ¢ È Î Í Í Í Í Í ˘ ˚ ˙ ˙ ˙ ˙ ˙ =
( )
¢ - +(
• -)
-(
)
+ • max /--(
)
È Î Í Í Í ˘ ˚ ˙ ˙ ˙ (5) L L L LZ L L K L L
Z L L K L
Z K • -• - ¢ È Î Í Í Í Í Í ˘ ˚ ˙ ˙ ˙ ˙ ˙ =
( )
¢ - +(
• -)
-(
)
+ • max /max
(
--)
È Î Í Í Í ˘ ˚ ˙ ˙ ˙ L
where Lmax= Maximum length of a specimen in the sam-ple (cm); and L = Mean length of all fishes with lengths above L’ (cm)
The Z value used for subsequent analysis was the mean value derived from the two methods.
2.6. Fishing mortality
This rate was just estimated by the difference be-tween total and natural mortality
F = Z – M (6)
2.7. Survival rate
The annual survival rate (S) is estimated by the for-mula:
S = e-z.100
2.8. Natural mortality (M)
The empirical equation proposed by Pauly (1980) was used to calculate natural mortality.
1nM = –0.0152 – 0.279.1nL∞ + 0.6543.1nK + (7) 0.463.1nT
where M = Coefficient of natural mortality (year-1); and
T = mean annual water temperature, which is assumed to be equal to the mean annual air temperature (°C).
2.9. Relative yield per recruit analysis (Y´/R)
The relative yield per recruit model of Beverton and Holt (1966) was used to estimate the yield per recruit:
¢ =
-+ Ê
ËÁ ˆ¯˜+ +
Ê ËÁ ˆ ¯˜- + Ê ËÁ ˆ ¯˜ È Î Í Í ˘ ˚ ˙ ˙ Y R EU U m U m U m m 1 3 1 3
1 2 1 3
2 3
(8)
where U L L c =
-• Ê ËÁ ˆ¯˜
1 ; m E
M
K K
Z
=1- = ; and Lc= length
at the beginning of the fishery recruitment E is the exploitation rate, given by:
E F
Z
= (9)
For fisheries management, it is necessary to adopt some reference points for the Beverton and Holt (1966) model. The most used ones are: Fmax and F0.1. Fmax is the mortality level when the yield is at a maximum, as a function of a given catch length. F0,1 was proposed by Gulland and Boerema (1973) as the fishing mortality rate where the slope of the yield per recruit curve is 10% of its value at the origin.
3. Results
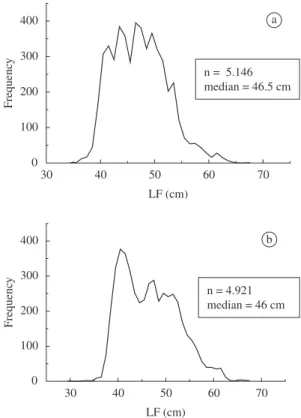
In 1996, 5146 specimens of pacus were sampled, while in 1997 this number amounted to 4921. The highest number of specimens measured during 1996 came from samples taken in April and August (993 and 939 specimens, respectively). During 1997, the highest number of specimens measured, 856 and 897, occurred during April and September, respectively. The mean fur-cal length for 1996 was 49.6 cm, with a maximum value of 69 cm, while during 1997 this value equaled 46.2 cm, with a maximum value of 68 cm. The distributions of individual furcal lengths are shown in Figure 1 for 1996 and 1997.
Biometric relationships for the pacu were only cal-culated from specimens caught between November 1999 and January 2000. During this period, 363 specimens were caught and the following measurements were tak-en: standard length, furcal length, total length and total weight. Mean furcal length was 38.4 cm, with a maxi-mum and minimaxi-mum value of, respectively, 57 and 30 cm. Mean total weight was 1536 g, with a minimum and maximum value of, respectively, 685 and 4985 g.
Estimated population parameters of pacu are shown in Table 1. In general, no difference was observed be-tween values obtained in 1996 and 1997. These results
Table 1. Estimates of the population parameters of pacu Piaractus mesopotamicus, landed at Corumbá, MS, between 1996 and 1997. L∞ - asymptotic length; K – curvature parameter of the VBGF; WP – winter point = ts + 0.5, where ts is the sum-mer point; Rn – ‘goodness of fit’ index of the ELEFAN I routine (=10ESP/ASP)/10); M – natural mortality; Z – total mortality; F – fishing mortality.
Year L∞(cm) K (year-1) C WP Rn M (year-1) Z (year-1) F (year-1)
suggest oscillation in the growth rate, with a minimum occurring in September, which corresponds to the dry season in the Pantanal. The growth performance index (φ’) was equal to 3.41, and its longevity was estimated as 8.4 years. The parameters associated with total and fishing mortalities were estimated as Z1996 =1.518 year-1
and F1996 = 0.898 year-1 and Z
1997 = 1.655 year-1 and
F1997 = 1.025 year-1. Survival rates were S
1996 = 21.9%
and S1997 = 19.1%.
Yield per recruit analysis was based on mean values for 1996 and 1997, where L∞ = 86.85 cm, K = 0.34 year-1, M = 0.625 year-1, Z = 1.580 year-1,
F = 0.960 year-1. Figure 2 shows the curves for different
values of Lc. Such values were obtained according to the following specifications:
• Lc = 26.7 cm: length of the smallest fish caught with a hook during the experimental fishing, (Peixer, 2003);
• Lc = 32.5 cm = length of the smallest fish caught during 1996 and 1997;
• Lc = 38 cm = Minimum catch length established by law during 1996 and 1997; and
• Lc = 42.6 cm = Minimum catch length established by law during 2002.
F2002 = 0.960 year-1 surpassed the maximum value
Fmax = 0.679 year-1 for L
c = 26.7 cm and 0.933 year-1 for
Lc = 32.5 (Table 2). For the other values, Lc = 37.9 cm
and 42.6cm, Fmax are, respectively, 1.292 year-1 and
1.883 year-1, (Table 2).
For F0.1 the values for each value of Lc are: 26.7 cm = 0.515 year-1; 32.5 cm = 0.785 year-1;
37.9 cm = 1.011 year-1 ; 42.6 cm = 1.472 year-1 (Table 2).
It can be seen that for the highest Lc values, this refer-ence point was already surpassed.
The present exploitation rate is equal to 0.607. Thus, for Lc = 26.7 cm (Emax = 0.52) and for Lc = 32.5 cm (Emax = 0.599), this value is above Emax (Table 3). For the other values of Lc (37.9 and 42.6 cm), Emax values are 0.674 and 0.751 respectively, which are very close to the present exploitation rate (Figure 3).
4. Discussion
Values for the oscillation parameters (C) in Table 1 indicate slower growth during unfavorable periods, which corresponds to the dry season in the Pantanal (WP = 0.8). This lower WP value took place in September. Pacu is an omnivorous species, with a diet mostly composed of vegetable items. As usual, the period with the highest growth rate corresponded to flooding periods, whereas the period with the slowest growth rate corresponds to the dry season, when food is relatively scarce, as usual and in agreement with Vaz (2001). Isaac and Ruffino (1996) found C = 0.505 and the highest WP value during July for the tambaqui Colossoma macropomum, a close relative of the pacu, in the Lower Amazon. According to
30 40 50 60 70
0 100 200 300 400
Frequenc
y
LF (cm)
n = 5.146 median = 46.5 cm
a
30 40 50 60 70
0 100 200 300 400
Frequenc
y
LF (cm)
n = 4.921 median = 46 cm
b
Figure 1. Furcal length (cm) frequency distribution of pacu Piaractus mesopotamicus landed at Corumbá, Pantanal, be-tween a) March 1996; and b) October 1997.
0 2 4 6 8 10 12
0.00 0.01 0.02 0.03 0.04 0.05
present value of F (1996/1997)
Y´/R
F (year-1) Lc = 26.7 cm Lc = 32.5 cm
Lc = 37.9 cm Lc = 42.6 cm
Figure 2. Yield per recruit ( Y´/R) and fishing mortality (F) for the pacu Piaractus mesopotamicus between 1996/1997, according to several fishing recruitment length (Lc, cm).
Table 2. Length at the first capture (Lc) and reference points (Fmax and F0.1) for the pacu Piaractus mesopotamicus based on the data collected in 1996 and 1997. Values estimated from the yield per recruit equation.
Lc (cm) Fmax (year-1) F 0.1(year
-1)
26.7 0.679 0.515
32.5 0.933 0.785
37.9 1.292 1.011
these authors, during July the water level is decreasing whereas the period of highest growth rate was associated with those months in which the water level was higher and hence, food availability is not a limiting factor for frugivore species, such as the tambaqui.
Vaz (2001) concluded that growth rings of
P. mesoptamicu s were formed twice a year. The first
during September, matching the reproductive migration, while the other was formed in February during the troph-ic migration. Similar results concerning growth ring for-mation were reported by Mateus and Petrere (2004) for the “pintado” (Pseudoplatystoma corruscans), from the
Cuiabá River basin, and by Penha et al. (2004) for the “jurupensem” (Sorubim cf. lima) from the Cuibá River.
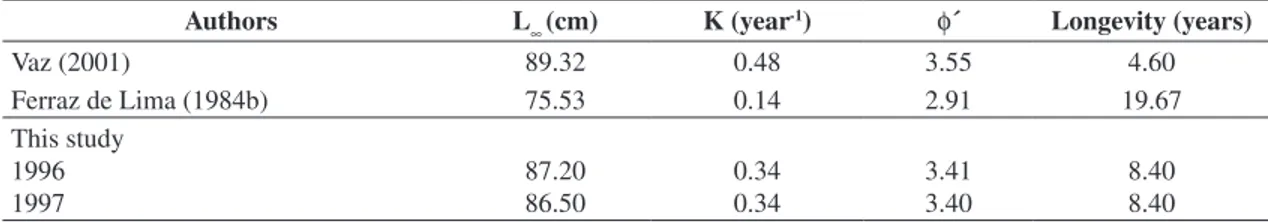
The growth performance index calculated in this study was equal to 3.41, a value similar to those ob-tained by Vaz (2001). Ferraz de Lima et al. (1984b) did not calculate this index but, through the analysis of their data, it was possible to estimate it as being equal to 2.91. According to Sparre and Venema (1997), this index is the best way to calculate the average of the growth parame-ters of a given species and should not differ widely when one compares different groups of data from the same species. If the difference is too high, then one might be-come suspicious about the estimate of the parameters K and L∞.
Differences in L∞ and K values shown in Table 3 can be partially attributed to differences in the way the model was adjusted.
The longevity estimated in this study was estimated as Tm = 8.4 years. Vaz (2001) found 4.6 years using the parameters estimated by ELEFAN, and a maximum age of 5 years through scale reading. Ferraz de Lima et al. (1984b) found a very high estimate for longevity, 19.6 years. This difference might be due to the fact that, in order to calculate longevity, it is necessary to estimate the parameters t0 and K. These parameters, in turn, were quite different among the studies, as they were obtained by different methods. It is worth mentioning that those two studies that used scale analysis also reached quite different estimates for longevity (Vaz, 2001; Ferraz de Lima et al. 1984b). Probably, this difference rests on the fact that one study (Vaz, 2001) found the formation of two growth rings per year, while the other (Ferraz de Lima et al. 1984b) detected the formation of a sin-gle growth ring during the reproductive period without any further validation. It is also possible that the small sample size analyzed by Ferraz de Lima et al. (1984b) somehow biased his results.
The natural mortality rate found in this study (0.62 year-1) was high, but still lower than the one
pre-sented by Vaz (2001), who estimated M = 0.78 year-1,
using the same Pauly (1980) formula.
Based on the total mortality rates per year, the sur-vival rate S1996 = was 21.9% and S1997 = 19.1%. These values are slightly higher than the value of S = 17.6% found by Vaz (2001).
The fishing mortality rate was estimated at 0.96 year-1
and the yield per recruit analysis indicated that the refer-ence point, directly estimated by ELEFAN, Fmax varied from 0.67 to 1.88 year-1 for the different values of L
c. For
the lowest lengths, Fmax was already surpassed and for the two values of minimum catch length (37.9 and 42.6 cm), FPresent is very close to Fmax. Moreover, the fishing mortal-ity rate that maximizes the yield per recruit is very high and probably exceeded FMSY (Clark, 1991). In some situ-ations it has been observed that Fmax exceeded FMSY (pro-duction models) and, therefore, Fmax has been regarded as a less conservative estimate (Gallucci et al., 1996; Quinn II and Deriso, 1999; Caddy and Mahon, 1995).
With respect F0.1, since the yield curve typically be-comes more shallow as mortality rate increases, this es-timate approaches the maximum yield per recruit (Clark, 1991). Furthermore, the increase in F above F0.1 leads to a smaller profit in terms of yield per recruit, even though there is considerable increase in the costs (Butterworth et al. 1989). This reference point is recognized, both
Table 3. Estimates of the growth parameters for the pacu Piaractus mesopotamicus obtained in this study as compared to those obtained in other studies. L∞ - asymptotic growth; K – growth rate; and φ´ = log10 K + 2.(log10L∞).
Authors L∞(cm) K (year-1) φ´ Longevity (years)
Vaz (2001) 89.32 0.48 3.55 4.60
Ferraz de Lima (1984b) 75.53 0.14 2.91 19.67 This study
1996 1997
87.20 86.50
0.34 0.34
3.41 3.40
8.40 8.40
0.2 0.4 0.6 0.8 1.0
0.00 0.01 0.02 0.03 0.04 0.05
Y´/R
Exploitation rate (E) Lc = 26.7 cm
Lc = 32.5 cm Lc = 38.0 cm Lc = 42.6 cm
from an economical and biological point of view, as de-noting conservative exploitation (Martínez-Garmendia, 1997).
The yield per recruit analysis might not be adequate to describe multispecific fisheries, where interactions are intense and usually not well recognized (Pauly, 1979; Brothers, 1979). However, according to Petrere (1983), who used this method for the tambaqui, which being an omnivorous fish, would have a reduced interaction with other species and, hence, the yield per recruit analysis would be adequate in such case. Given that the pacu is also an omnivorous species, the rationale of Petrere (1983) should also hold for the present study.
Caddy and Mahon (1995) argued that, for those well-studied fisheries, the coefficient of variation associated with F values might be lower than 15-30%. On the other hand, coefficients of variation estimated from less-stud-ied fisheries are usually higher. Thus, this might be an-other fact that should be taken into account when control actions are established for the fishing of pacu, especially when a conservative strategy is to be adopted.
The use of hooks for the pacu fisheries leads to the catch of specimens above 26.7 cm (LF), (Peixer, 2003). Thus, it can be concluded that the fishing mortality starts from this length. It is worth mentioning that the maximum reference point was surpassed for this fishery recruitment length. The present minimum length deter-mined by the current legislation is 45 cm and there is no safe information as to the survival rate of individuals below this minimum length that are caught and released. If the mortality after release (catch-and release fishery) is higher, the adoption of this strategy might not be efficient to account for stock renewing and, thus, new regulation strategies must be adopted to protect this species.
The reference point F = M, would also be already surpassed, indicating that the pacu is overexploited in the Pantanal. Deriso (1987) argued that, whenever the M/K ratio is between 1 and 4, this reference point is a value that does not depart widely from the F0,1 point. In the present study, M/K = 1.838, and the variation in F0.1 ranged from 0.5 to 1.4, an interval which included the natural mortality rate (0.625). Thus, this data seems to corroborate the suggestion of Deriso (1987), at least for the smallest catch lengths.
Vaz (2001) found that the pacu had a fishing mor-tality equal to 0.955 year-1 for F
Present and, in that case,
FMSY = 1, when M = 0.78 year-1. Thus, this author
con-cluded that this species is close to its maximum sustain-able yield.
Using the surplus production model, Catella (2001) concluded that the maximum sustainable yield of the pacu had already been exceeded. This author used data from landings for 1994 and 1995 for the en-tire basin of the Upper Paraguay River at the State of Mato Grosso do Sul. He found a YMSY = 430 t/year and FMSY = 149.691 fishers per fishing day. The fishing effort during 1999 was 243.982 fishers per fishing day and the production amounted to 314 t, which was lower than the
1994 production (452 t). Del Barco (2000) also conclud-ed that the pacu is overexploitconclud-ed in the Paraná River in Argentina.
The excessive fishing effort decreases not only the potential catches and catch rates, but also the stock size up to a point where reproduction is jeopardized and a collapsing level is reached (Garrod, 1987). Over-fishing also leads to a narrow group of age classes that are effec-tively caught, and to a decrease in the mean length of the specimens caught (Caddy and Mahon, 1995).
Calcagnotto (1998), based on data derived from mi-tochondrial DNA analysis of the pacu, concluded that this species represents a single genetic pool. Thus, if the results from the present study corroborate those from Catella (2001) and Vaz (2001), it can be safely assumed that its stock is presently overexploited and urgent action has to be taken in order to prevent its collapse.
Acknowledgments — We thank UNESP and CNPq for partially supporting this research. Dr. Lúcia Ap. de Fátima Mateus and Dr. Gonzalo Velasco Canziani for help with the FISAT software and for critically reading an early draft of this manuscript. Thanks are also due to EMBRAPA Pantanal for logistic support and for assembling length data, and to the fishing tourism companies of Corumbá, Cooperativa de Pesca and several fish markets that facilitated collection of length data.
References
AULT, JS. and EHRHARDT, M., 1991. Correction to the Beverton and Holt Z-estimator for truncated catch length-frequency distributions. ICLARM Fishbyte, vol. 9, no. 1, p. 37-39.
BARCO, MBV., PETRERE, M., VILLAREAL, MZ. and VERA, EG., 1993. Parámetros poblacionales (mortalidad, rendimento máximo sostenible) y estado de explotación del bocachico (Prochilodus magdalenae Steindachner, 1878; Prochilodontidae) del Bajo Río Magdalena (Colombia). Boletin Cientifico INPA, vol. 1, p. 43-60.
BEVERTON, RJH. and HOLT, SJ., 1966. Manual of methods for fish stock assessment. Part 2. Tables of yield functions. FAO Fish. Tech. Pap. 38. 67p.
BROTHERS, EB., 1979. Age and growth studies on tropical fishes. In ROEDEL, PM., SAILA, SB. (ed.). Stock assessment for tropical small-scale fisheries. University of Rhode Island/ ICMRD, 198p.
BUTTERWORTH, DS., PUNT, AE., BORCHERS, DL., PUGH, JB., HUGHES, GS., 1989. A manual of mathematical techniques for linefish assessment. South African National Scientific Programmes Report n° 160. Cape Town, (Marine Linefish Programme´s), 89p.
CADDY, JF. and MAHON, R., 1995. Reference points for fisheries management. Roma: FAO, 83p.
CALCAGNOTTO, D. 1998., Caracretização de bancos genéticos selvagens de pacu (Piaractus mesopotamicus) e de tambaqui (Colossoma macropomum) através da análise do DNA mitocondrial. (PhD Thesis) – Instituto de Biociências. Universidade de São Paulo, São Paulo, 131p.
(1994-1999). (PhD Thesis) – INPA - Instituto Nacional de Pesquisas da Amazônia, Universidade do Amazonas, Manaus, 343p. CLARK, WG., 1991. Groundfish exploitation rates based on life history parameters. Can. J. Fish. Aquat. Sci., Ottawa, vol. 48, p. 734-750.
DEL BARCO, DM., 2000. Informe sobre la situación actual de la actividad pesquera en la provincia de Santa Fe. Seminario Internacional de Pesca Continental. Santa Fé, Argentina, 6 e 7 dezembro. (não publicado).
DERISO, RB., 1987. Optimal F0,1 criteria and their relationship to maximum sustainable yield. Can. J. Fish. Aquat. Sci, Ottawa, vol. 44, sup. 2, p. 339-348.
FERRAZ DE LIMA, JA., BARBIERI, G. and VERANI, JR., 1984a. Período de reprodução, tamanho e idade de primeira maturação gonadal do pacu, Colossoma mitrei, em ambiente natural (Rio Cuiabá, Pantanal de Mato Grosso). In Anais Simp. Brás. de Aquicul. III. São Carlos, SP, 477-497.
FERRAZ DE LIMA, JA., FERRAZ DE LIMA, CLB. and BARBIERI, G., 1984b. Crescimento do pacu (Colossoma mitrei), em ambiente natural (Rio Cuiabá – Pantanal de Mato Grosso). In Anais Simp. Bras. Aquicul. III. São Carlos, SP, p. 499-521.
GALLUCCI, VF., AMJOUN, B., HEDGEPETH, J. and LAI, HL., 1996. Size-based methods of stock assessment of small-scalle fisheries. In GALLUCCI, VF., SAILA, BS., GUSTAFSON, DJ. and ROTHSCHILD. (eds). Stock assessment: quantitative methods and applications for small-scale fisheries. New York. Lewis Publishers, p. 9-81.
GARROD, DJ., 1987. The scientific essentials of fisheries management and regulations. Lowestoft: Ministry of Agriculture Fisheries and Food/ Directorate of Fisheries Research. 14p. (Laboratory, 60).
GAYANILO, FC. JR. and PAULY, D. 1997. FAO-ICLARM stock assessment tools (FISAT) Reference Manual. Roma: FAO, 262p.
GULLAND, JA. and BOEREMA, LK., 1973. Scientific advice on catch levels. Fishery Bulletin, vol. 71, no. 2, p. 325-335. HILBORN, R. and WALTERS, CJ., 1992. Quantitative fisheries stock assessment: choice, dynamics and uncertainty. New York: Chapman and Hall, 570 p.
HOLDEN, M., 1995. Beverton and Holt revisited. Fisheries Research, Dartmouth, vol. 24, no. 1, p. 3-8.
ISAAC, VJ., RUFFINO, ML., 1996. Population dynamics of tambaqui, Colossoma macropomum Cuvier, in the Lower Amazon, Brazil. Fisheries Management and Ecology, vol. 3, no. 4, p. 315-333.
MARTÍNEZ-GARMENDIA, J., 1997. Effects of length-at-age data on growth and management benchmark F0,1 estimates in
the face of size-selective mortality. Fisheries Research, vol. 32, no. 3, p. 233-247.
MATEUS, LAF. and PETRERE, JR. M., 2004. Age, growth and yield per recruit analysis of the pintado Pseudoplatystoma corruscans (Agassiz, 1829) in the Cuiabá River Basin, Pantanal Matogrossense, Brazil. Braz. J. Biol., vol. 64, no. 2, p. 257-264.
PAULY, D., 1979. Theory and management of tropical multispecies stocks: a review with emphasis on the Southeast Asian demersal fisheries. ICLARM Stud. Rev. 1, 35p.
-, 1980. On the interrelationships between natural mortality, growth parameters and mean environmental temperature in 175 fish stocks. J. Cons. CIEM, vo. 39, no. 3, p. 175-192.
PAULY, D. and MARTOSUBROTO, P., 1980. The population dynamics of Nemipterus marginatus (Cuvier & Val.) off Western Kalimantan, South China Sea. J. Fish Bio., vol. 17, no. 3, p. 263-273.
PAULY, D. and DAVID, N., 1981. ELEFAN I, a basic program for the objective extraction of growth parameters from length-frequency data. Meeresforsch, vol. 28, no. 4, p. 205-211. PEIXER, J. 2003. A seletividade de anzol e o rendimento por recruta do pacu Piaractus mesopotamicus (Holmberg, 1887) no Pantanal de Mato Grosso do Sul, Brasil. (MSC dissertation) – Universidade Estadual Paulista “Júlio de Mesquita Filho”, Rio Claro, 77p.
PENHA, JMF., MATEUS, LAF. and BARBIERI, G., 2004. Age and growth of the duckbill catfish (Sorubim cf. lima) in the Pantanal. Braz. J. Biol., vol. 61, no. 1, p. 125-134.
PETRERE, M., 1983. Yeld per recruit of the Tambaqui, Colossoma macropomum Cuvier, in the Amazonas State, Brazil. J. Fish Biol., vol. 22, no. 2, p. 133-144.
QUINN II, TJ., DERISO, RB., 1999. Quantitative fish dynamics. Oxford: Oxford University Press. 542p.
SILVA, MV., 1986. Mitos e verdades sobre a pesca no Pantanal sul-mato-grossense. Campo Grande, FIPLAN-MS. 146p. SPARRE, P. and VENEMA, SC. 1997. Introdução á avaliação de mananciais de peixes tropicais. Parte 1 – Manual. FAO Documento Técnico sobre as Pescas, 306/1, Ver. 2, 404p. TAYLOR, CC., 1960. Temperature, growth, and mortality – the pacific cockle. J. Cons. Int. Explor. Mer, vol. 26, no. 1, p. 117-124.
VAZ, MM., 2001. Problemas no ajuste da curva de crescimento do pacu, Piaractus mesopotamicus (Holmberg, 1887) (Pisces: Characidae), e seu manejo no Pantanal Mato-Grossense. PhD Thesis CAUNESP – Centro de Aquicultura/Universidade Estadual Paulista, Jaboticabal, 98p.