Stalk yield and technological attributes of planted cane
as related to nitrogen fertilization
Henrique Coutinho Junqueira Franco
1; Paulo Cesar Ocheuze Trivelin
1*; Carlos Eduardo
Faroni
2; André Cesar Vitti
3; Rafael Otto
41
USP/CENA – Lab. de Isótopos Estáveis, C.P. 96 – 13400-970 – Piracicaba, SP – Brasil. 2
Centro de Tecnologia Canavieira, C.P. 162 – 13400-970 – Piracicaba, SP – Brasil. 3
APTA/Pólo Regional Centro Sul, C.P. 28 – 13400-970 – Piracicaba, SP – Brasil. 4
USP/ESALQ – Programa de Pós-Graduação em Solos e Nutrição de Plantas, Av. Pádua Dias, 11 – 13418-900 – Piracicaba, SP – Brasil
*Corresponding author <pcotrive@cena.usp.br>
ABSTRACT: A still unclear question related to sugarcane cropping refers to the low response of the planted cane to nitrogen fertilization. Two experiments were carried out in areas under a Typic Hapludox, located in Pirassununga, São Paulo State, Brazil, and an Arenic Kandiudult, located in Jaboticabal, São Paulo State, Brazil, with the objective to evaluate planted cane response to nitrogen fertilization at planting. The experimental design was organized as random blocks and treatments consisted of three N rates (40, 80, and 120 kg ha–1
N-urea) and a control without N. Nitrogen fertilizers were applied to the bottom of the planting furrow and then incorporated into the soil. During the maximum growth stage, +1 leaf samples were collected from all experimental plots to evaluate the crop nutritional status. In the Pirassununga experiment, N fertilization at planting increased N, K, Mg, and S contents in the leaves and increased the stalk yield, without effect in the technological attributes. Conversely, no stalk yield response was observed at the Jaboticabal experiment, but N fertilization benefited the stalk technological attributes. The N rates increased the sugar yield per hectare in both experiments. The highest margin of agricultural contribution was obtained at the rate of 40 kg ha–1
N. Key words: Saccharum spp., nitrogen, urea
Produção de colmos e atributos tecnológicos da cana planta
relacionados com a adubação nitrogenada
RESUMO: Uma questão não esclarecida na cultura da cana-de-açúcar se refere à baixa resposta da cana planta à adubação nitrogenada de plantio. Nesse sentido, foram desenvolvidos dois experimentos em áreas cultivadas sobre um Latossolo Vermelho-Amarelo Distrófico (Pirassununga, SP) e um Latossolo Vermelho Distrófico (Jaboticabal, SP), com objetivo de avaliar a resposta da cana planta a adubação nitrogenada de plantio. O delineamento experimental foi em blocos ao acaso, e os tratamentos foram três doses de N (40, 80 e 120 kg ha–1 na forma de uréia) mais um tratamento controle sem adição de N. Os fertilizantes nitrogenados foram aplicados no fundo de sulco de plantio e incorporados ao solo. Durante a fase de máximo crescimento da cultura, foram coletadas amostras de folhas +1 em todas as parcelas experimentais para a determinação do estado nutricional. Em Pirassununga, a adubação nitrogenada de plantio aumentou as concentrações de N, K, Mg e S nas folhas diagnósticas e a produção de colmos, sem apresentar efeito nos atributos tecnológicos. Por outro lado, em Jaboticabal não houve resposta em produtividade, mas houve efeito nos atributos tecnológicos. Obtiveram-se incrementos na produção de açúcar por hectare em ambas as áreas em função da fertilização nitrogenada. A maior margem de contribuição agrícola foi obtida com a dose de 40 kg ha–1
de N. Palavras-chave: Saccharum spp., nitrogênio, uréia
Introduction
The great importance of nitrogen for sugarcane re-lates to the fact that the plant is a Poaceae, with C4-type carbon metabolism, characterized by high liquid pho-tosynthesis rate, and high nitrogen and solar energy use efficiency, thus being highly effective in producing dry matter. However, a still unclear question related to sug-arcane cropping refers to the low response of newly planted cane to nitrogen fertilization. Literature is quite rich in papers that evaluated the effect of rates, sources, and forms of nitrogen application in sugarcane, with
very heterogeneous responses in planted cane and rela-tively homogeneous responses in ratoon cane (Carnaúba, 1990).
crops (Azeredo et al., 1986; Carnaúba, 1990; Urquiaga et al., 1992; Carneiro et al., 1995; Orlando Filho et al., 1999). Although a great number of authors did not find N fertilization benefits in planted cane, this practice is rec-ommended and performed in most Brazilian sugar mills, even under conditions of low response expectations. Why is that so? Would it be a lack of confidence in experi-mental results? Within this context, the objective of this study was to evaluate planted cane response to nitrogen fertilization at planting, by assessing stalk production, dry matter weight, foliar diagnosis, stalk technological attributes, sugar yield per unit area, and margin of agri-cultural contribution.
Material and Methods
The experiments were performed in two sugar cane producing areas located in the state of São Paulo, Bra-zil. The first is in Pirassununga, São Paulo state, Brazil (21º55’ S; 47º10’ W, altitude is 650 m and the climate is Aw - Tropical Savanna, according to Köppen classifica-tion). This area has a slightly rolling slope (< 5%), and the soil is a Typic Hapludox (Soil Survey Staff, 2003) or Latossolo Vermelho-Amarelo Distrófico (Embrapa,
2006). The chemical characterization of the soil is pre-sented in Table 1. For soil preparation, two heavy diskings were performed, before and after subsoiling. The first was done to eliminate the old ratoon, and the second was done to incorporate 2 t ha–1 of dolomitic lime and 2 t ha–1 of phosphogypsum. Medium-depth disking
was also performed for the final preparation of the soil before the opening of the furrows (planting). The sugar cane was planted from February 21-24, 2005.
The second area is in Jaboticabal, São Paulo state, Brazil (21º19’ S, 48º19’ W, predominant altitude in the region is 600 m, and the climate is Aw - Tropical sa-vanna). The area presents a slightly rolling slope (< 5%), and the soil is an Arenic Kandiustult (Soil Survey Staff, 2003) or Latossolo Vermelho Distrófico (Embrapa, 2006). The chemical characterization of the soil is presented in Table 1. The main operations performed for the reno-vation of the sugar cane fields before planting were: chemical desiccation of the previous ratoon with the ap-plication of 4 L ha–1 of herbicide (glyphosate); deep plow-ing for the incorporation of plant residues and 2 t ha–1 of
dolomitic lime; and disking for the final preparation of the soil before the opening of furrows (planting). The sugar cane was planted from April 4-8, 2005.
Table 1 – Chemical attributes of soil samples collected in the areas of Pirassununga and Jaboticabal before the developing of the experiments (collected in November of 2004).
s e t u b i r t t a l a c i m e h
C Depth Chemicalattributes Depth 5
2
-0 25-50 50-75 75-100 0-25 25-50 50-75 75-100 -m c
--- ---cm--- --x o t s u l p a H c i p y T -a g n u n u s s a r i P l C a C ( H
p 2) 5.5 4.7 4.6 4.6 CEC(mmolcdm 3
–) 59.6 44.8 38.6 34.7
m d g ( . M . O .
S –3) 20 13 10 8 BS(%) 66 31 28 28
m d g m (
P –3) 9 6 2 4 m(%) 2.5 18 22 24
l o m m (
K cdm–3) 2.4 1.0 0.8 0.7 S-SO 4(mgdm
3
–) 6 45 68 74
l o m m ( a
C cdm–3) 29 10 7 6 Cu(mgdm–3) 1.2 0.9 0.6 0.4
l o m m ( g
M cdm–3) 8 3 3 3 Fe(mgdm–3) 25 20 11 7
l o m m ( l A +
H cdm–3) 20 31 28 25 Zn(mgdm–3) 0.4 0.4 0.3 0.5
l o m m ( l
A cdm–3) 1 3 3 3 Mn(mgdm–3) 3.4 0.4 0.3 0.5
l o m m ( B
S cdm–3) 39.4 14.0 10.9 9.7 B(mgdm–3) 0.17 0.18 0.14 0.12
s t l u t s u i d n a K c i n e r A -l a b a c i t o b a J l C a C ( H
p 2) 5.1 4.2 4.3 4.8 CEC(mmolcdm–3) 47.7 41.1 41.3 33.8
m d g ( . M . O .
S –3) 16 11 10 8 BS(%) 42 17 17 33
m d g m (
P –3) 15 5 2 2 m(%) 4.8 54 54 8
l o m m (
K cdm–3) 3.9 1.8 2.0 3.3 S-SO 4(mgdm
3
–) 4 38 71 68
l o m m ( a
C cdm–3) 11 4 4 6 Cu(mgdm–3) 0.7 0.4 0.3 0.2
l o m m ( g
M cdm 3
–) 5 1 1 2 Fe(mgdm–3) 16 11 6 4
l o m m ( l A +
H cdm–3) 28 34 34 22 Zn(mgdm–3) 0.5 0.4 0.1 0.2
l o m m ( l
A cdm–3) 1 8 6 1 Mn(mgdm–3) 20.4 9.4 13.9 11.7
l o m m ( B
S cdm–3) 19.9 6.8 7.0 11.3 B(mgdm–3) 0.24 0.21 0.16 0.14
Both experiments consisted of a random block de-sign with four replicates. Treatments were three N rates (40, 80, and 120 kg ha–1 N in the form of urea) applied to
the bottom of the planting furrow and incorporated into the soil, in addition to a control. The experimental plots consisted of 48 rows with 15 m-long (furrows) spaced 1.5 m apart. At planting, all plots received the applica-tion of 120 kg ha–1 K
2O and P2O5 in the bottom of the
furrow, using potassium chloride and triple superphos-phate as sources, respectively.
Two seed cane billets per meter were used at sugar-cane planting thus providing a distribution of 17 to 20 buds per meter of furrow. The sugarcane seedlings de-posited on the bottom of the furrow were cut into bil-lets containing 2 to 3 buds, after which the furrows were machined-covered. The experiment was planted with sugarcane cv SP81- 3250.
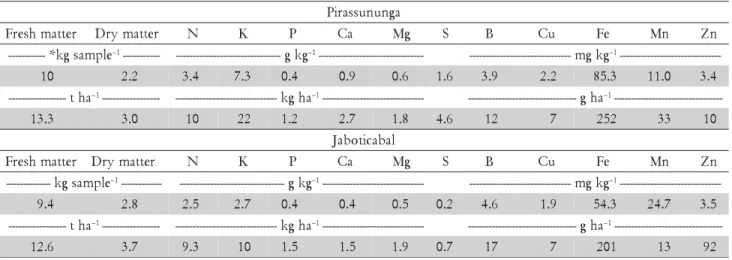
As part of the evaluation of the availability of N to the crop during the planted cane season, 30 seedpieces were collected at random during planting, which were divided into three subsamples (no. of seedlings necessary for the planting of 15 m of a row) and, in these, fresh matter, dry matter and nutrients content were deter-mined (Malavolta et al., 1997) (Table 2).
The nutritional state of the plants was evaluated at the stage of maximum development of the crop, on Janu-ary 12 and 17, 2006 in the experiments in Pirassununga and Jaboticabal, respectively. Evaluation followed the recommendation of van Raij and Cantarella (1997), in which five leaves in the +1 position (F+1) were col-lected at random in each plot, which then constituted a random sample. From each leaf (F+1) only the middle third was collected, approximately 0.2 m, excluding the center nervure. The F+1 is the first leaf from the top of the plant that visibly presents the point of separation be-tween limbus and sheath of the leaf, denominated as the dewlap, also being denominated as the TVD (“Top Vis-ible Dewlap”). These samples were dried in a forced air circulation oven at 65oC until reaching a constant
weight, then being ground in a Wiley type mill and
ana-lyzed in regard to their macronutrients content (Malavolta et al., 1997).
In order to evaluate the final planted cane produc-tivity as a function of N fertilization at planting, the cane was harvested on 06/07/2006 in Pirassununga and on 07/11/2006 in Jaboticabal. Dry matter yield of the above-ground part was estimated by harvesting all sug-arcane plants from a 3 m row in all plots; cane samples were separated into dry leaves, tips, and stalks. Deter-minations were made directly in the field with those samples for natural plant material mass. All materials were chopped in a forage chopper, producing subsamples that were placed in plastic bags which were then closed, identified, and taken for moisture deter-mination. Samples were dried in a lab oven at 65°C for 72 h in order to obtain dry matter. The results were extrapolated to kg ha–1, considering a row spacing of 1.5 m.
Root sampling was carried out after harvesting the above-ground part of the sugarcane plants, by using a probe (55 mm internal diameter) and at the 0 to 60 cm of depth. The sampling method and calculation proce-dures for transforming the mass per unit area (kg ha-1)
were adopted according to Otto et al. (2009). In those samples, the roots were separated from the soil by dry sifting (sieve mesh - 2 mm). The roots separated from the soil were washed in running water, dried in a venti-lated oven at 65°C, and dry matter values were obtained. Stalk productivity (tons of sugarcane stalks per hect-are - TSS) for all planted cane plots (four blocks) was evaluated by cutting the cane mechanically and weigh-ing the chopped cane in a truck equipped with instru-ments in 16 rows per plot (four sequences of four con-secutive rows – 240 m). The other rows were harvested mechanically without weighing. In this harvest, samples consisting of ten stalks per plot were separated and har-vested in sequence on the row, in order to evaluate tech-nological parameters: Brix, Purity, Fiber, Juice Pol, Cane Pol, Reducing Sugars (RS), and Total Recoverable Sugars (TRS), according to Fernandes (2003).
a g n u n u s s a r i P r
e t t a m h s e r
F Drymatter N K P Ca Mg S B Cu Fe Mn Zn
e l p m a s g k *
--- –1----------- -------------------------------gkg–1------------------------------- ------------------------------mgkg–1---------------------------- --0
1 2.2 3.4 7.3 0.4 0.9 0.6 1.6 3.9 2.2 85.3 11.0 3.4 a
h t
--- –1----------------- ------------------------------kgha–1 ------------------------------ --------------------------------gha–1 ------------------------------ --3
. 3
1 3.0 10 22 1.2 2.7 1.8 4.6 12 7 252 33 10
l a b a c i t o b a J r
e t t a m h s e r
F Drymatter N K P Ca Mg S B Cu Fe Mn Zn
e l p m a s g k
--- –1 ------------ -------------------------------gkg–1 ------------------------------ ------------------------------mgkg–1---------------------------- --4
.
9 2.8 2.5 2.7 0.4 0.4 0.5 0.2 4.6 1.9 54.3 24.7 3.5 a
h t
--- –1----------------- ------------------------------kgha–1 ------------------------------ --------------------------------gha–1 ------------------------------ --6
. 2
1 3.7 9.3 10 1.5 1.5 1.9 0.7 17 7 201 13 92 Table 2 – Chemical characterization and matter content and nutrients of the sugar cane seedlings.
The margin of agricultural contribution (MAC) was calculated from TRS price data at the closure of the 2006/ 2007 cropping season, HLT costs (harvesting, loading, and transporting), and cost per ton of urea, provided by the farming departments of each sugar mill. The model employed to calculate MAC was processed according to Fernandes (2003). The margin of contribution repre-sents the difference between gross income obtained with the products and variable costs of the production sys-tem. Contribution margin can be analyzed from the grower’s standpoint: the grower delivers cane for grind-ing (agricultural system) or for agricultural mills that produce their own raw materials (agroindustrial system). In this research, we chose to use margin of agricultural system contribution (MAC), which can be determined more easily and does not require expected income data from sugar and alcohol sales. Therefore, MAC represents the difference between income with raw materials (TSS) delivered to a processing plant and variable costs such as harvesting, loading, and transporting (HLT), manage-ment practices (urea application), and leasehold (not con-sidered in the calculation).
Throughout the entire period of the experiment, the meteorological parameters (solar radiation, wind speed, relative humidity, temperature and rainfall) were mea-sured by means of automatic meteorological stations in-stalled near the two experimental areas. The reference evapotranspiration (ET0) was calculated by the Penman-Monteith method, in accordance with Allen et al. (1998). For the calculation of crop evapotranspiration (ETc), the crop coefficient (Kc) for each stage of crop development was considered, in accordance with Doorenbos and Kassan (1994). However, the Kc of 1.05 for the period of maximum growth was replaced by the Kc of 1.25, in ac-cordance with modifications for sugar cane proposed by Allen et al. (1998), which were confirmed by Inman-Bamber and McGlinchey (2003). With this information, in addition to the rainfall measured at the experimental areas, the climatologically water balance was calculated using electronic spreadsheets (Rolim et al., 1998), in ac-cordance with Thornthwaite and Mather (1955), thus obtaining the real evapotranspiration (ETr) (Figure 1).
Results were submitted to analysis of variance, us-ing F test at the 90% confidence level. The effects of N rates were compared by polynomial regression analy-sis.
Results and Discussion
Nutritional Status of the Planted Cane
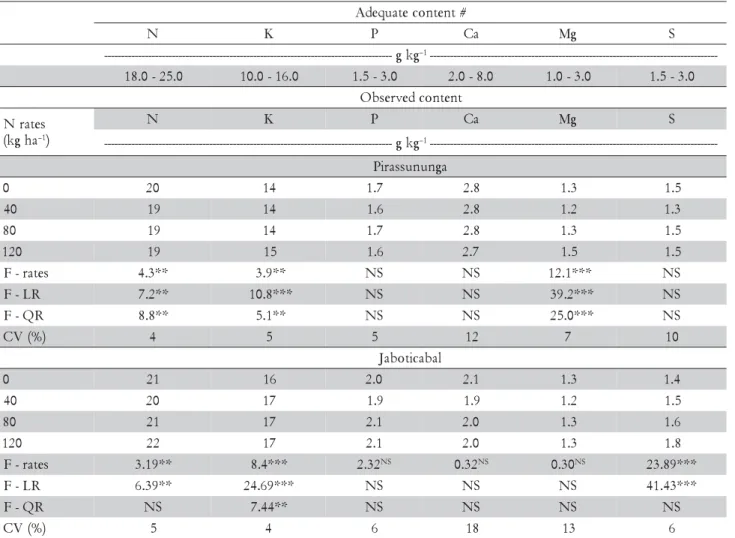
The majority of nutrient contents were in the range of sufficiency suggested for the sugar cane crop planted in the São Paulo State, Brazil (van Raij and Cantarella, 1997), an exception being made for the content of S in both experiments and the contents of Ca in samples from Jaboticabal (which were below the lower limit of suffi-ciency), and the contents of K at SA (which were above the upper limit of sufficiency). Nevertheless, the results mentioned for Ca and S are at the threshold of the ranges
of sufficiency and were not owing to the availability of the nutrients in the soil, because the contents of S and Ca (Tables 1) ranged from average to high (van Raij et al., 1997). Therefore, these results are probably due to the effect of dilution arising from growth of the crop (Jarrell and Beverly, 1981) which occurred at the time of collection of the leaves for diagnosis.
In the experiment carried out in Pirassununga, there was a reduction in the N contents in the F+1 in the treat-ments with application of N (Table 3), but as there was an increase in the dry matter production (Table 4), the dilution effect may have occurred. On the other hand, in the experiment carried out in Jaboticabal, an increase in the N contents was observed in the treatments with the application of N fertilizer. However, there was no effect of the N on the dry matter production of the crop (Table 4), which generated an effect of N concentration in the plants, which may characterize luxury consump-tion by the crop.
The K contents increased in a linear fashion with N fertilization in the two experiments. At SA the contents of K in the F+1 leaves were above the upper limit of the range of sufficiency suggested for the São Paulo State, Brazil (Table 3). Nevertheless, as the K content in the soil was elevated at the beginning of the experiment (Table 1), there may have been luxury consumption of K by the plants, which was confirmed by the K extrac-tions obtained at harvest of the plant cane (Franco et. al., 2008). Together with this, the greater availability of K in the soil may have influenced uptake of the nutrient due to the greater spatial variation of K distribution in the soil (Souza et al., 2006).
In both experiments, there was no effect of the doses of N on the contents of P and Ca of the diagnostic leaves (Table 3). Regarding the Mg contents, there was no ef-fect of the N rates on the experiment located in Figure 1 – Climatologically water balance of the experimental areas of Jaboticabal and Pirassununga. ETc: crop evapotranspiration; ETr: real evapotranspiration; R: rainfall
-150 -50 50 150 250 350 450
feb. mar. ap r. may jun ju l. aug . sep . oct. no v. dec. jan. feb . mar. ap r. may ju n jul.
mm
Deficit Rainfall ETc ETr
-150 -50 50 150 250 350 450
feb. mar. a pr. may jun jul. a ug. sep. oct. nov. dec. ja n. f eb. ma r. a pr. ma y jun jul.
mm
Jaboticabal
Pirassununga
R = 1522 mm ETc = 1830 mm ETr = 1163 mm Deficit = -667 mm
R = 1614 mm ETc = 1922 mm ETr = 1348 mm Deficit = -574 mm
Jaboticabal. In Pirassununga there was a linear increase in the Mg content of the leaves. This fact may be ex-plained by the participation of Mg in the chlorophyll molecule and also as an enzyme activator (Epstein and Bloom, 2006). In this case, there is a synergism between Mg and N, keeping in mind that nitrogen fertilization increased the biomass production of the plants of this area (Pirassununga).
There was a linear increase in the leaf S content with the N rates in Jaboticabal’s experiment (Table 3), al-though without response in Pirassununga. Sulfur is found in plants mainly as cysteine, methionine, proteins, co-enzymes, thiamine, biotine and coenzyme A, and its de-ficiency may interfere in the synthesis of regulatory pro-teins, essential for maintenance of cellular activity (Epstein and Bloom, 2006). There is synergism between N and S, with the deficiency of S being able to limit re-sponse of the plant to nitrogen fertilization. This may have occurred in Jaboticabal, since the plants of that ex-periment presented the greatest contents of N in the leaves, such that the contents of S, if not below the range
considered as adequate, are near the lower limit of 1.5 g kg-1 S (van Raij and Cantarella, 1997). Nevertheless, S
par-ticipates in many organic compounds (all the plant pro-teins contain S in the same way that all of them have N), and there is a ratio between the content of N and S in the leaves, generally between 10 and 15, which indi-cates adequate nutrition (Prates et al., 2006). A strongly stoichiometry is established between these two ele-ments: on average, there are approximately 34 atoms of N for each atom of S and, for most crops, the ratio be-tween these nutrients in the plant dry matter is in the order of 15/1 (Malavolta, 1980). Taking into account the N/S ratios in the two experiments (14, 14, 13 and 13 for the treatments 0, 40, 80 and 120 kg ha–1 N, respectively,
in the experiment at Pirassununga; and 15, 14, 13 e 12 for these same treatments at Jaboticabal), one concludes that the N and S contents of the diagnostic leaves were satisfactory.
Dry Matter and Stalk Yield
An increase in stalk productivity (tons of sugarcane
# t n e t n o c e t a u q e d A
N K P Ca Mg S
g k g
--- –1----------------------------------------------------------------------------------- --0 . 5 2 -0 . 8
1 10.0-16.0 1.5-3.0 2.0-8.0 1.0-3.0 1.5-3.0
t n e t n o c d e v r e s b O s e t a r N a h g k
( –1)
N K P Ca Mg S
g k g
--- –1-----------------------------------------------------------------------------------
--a g n u n u s s a r i P
0 20 14 1.7 2.8 1.3 1.5
0
4 19 14 1.6 2.8 1.2 1.3
0
8 19 14 1.7 2.8 1.3 1.5
0 2
1 19 15 1.6 2.7 1.5 1.5
s e t a r
-F 4.3** 3.9** NS NS 12.1*** NS
R L
-F 7.2** 10.8*** NS NS 39.2*** NS
R Q
-F 8.8** 5.1** NS NS 25.0*** NS
) % ( V
C 4 5 5 12 7 10
l a b a c i t o b a J
0 21 16 2.0 2.1 1.3 1.4
0
4 20 17 1.9 1.9 1.2 1.5
0
8 21 17 2.1 2.0 1.3 1.6
0 2
1 22 17 2.1 2.0 1.3 1.8
s e t a r
-F 3.19** 8.4*** 2.32NS 0.32NS 0.30NS 23.89***
R L
-F 6.39** 24.69*** NS NS NS 41.43***
R Q
-F NS 7.44** NS NS NS NS
) % ( V
C 5 4 6 18 13 6
Table 3 – Adequate content of nutrients in the diagnostic leaf for the sugar cane crop of São Paulo State, Brazil, and nutrient content on leaf of planted cane.
stalks per hectare - TSS) was observed in the Jaboticabal experiment for treatments receiving N at planting (Table 4). In addition, dry matter for the stalks, above-ground part (stalks, dry leaves, and tip), and total (above-ground part plus roots) showed a quadratic response (p < 0.05), in which the treatment involving the application of 80 kg ha–1 N stood out.
No effect of N fertilization on the production param-eters evaluated was observed in Jaboticabal (Table 4). However, in the root dry matter yield evaluation, the 40 kg ha–1 N rate increased this variable, yielding more
than 1,000 kg ha–1 above the control (Table 4). Trivelin
et al. (2002) observed a linear response in the root sys-tem dry matter productivity of planted cane (cv SP80-1842) as a function of N rates at planting. This fact may provide greater productivity in the 1st ratoon (residual
effect), because roots and rhizomes constitute storage organs in sugarcane. Vitti et al. (2007) verified a pro-nounced residual effect of nitrogen fertilization applied to the 3rd ratoon on stalk productivity of the subsequent
ratoon.
Nitrogen fertilization in planted cane is still an open question in the sugarcane industry. However, positive effects of nitrogen nutrition on planted cane productiv-ity have been found. Trivelin et al. (2002) observed a stalk productivity increase in cv SP80-1842 as a response to nitrogen fertilization at planting (rates of 30, 60, and
90 kg ha–1 N). Korndörfer et al. (2002) obtained positive response to the addition of 60 kg ha–1 N in seven
sugar-cane cultivars, with a mean increase of 10 TSS. Orlando Filho et al. (1999) observed a 35% reduction in planted cane stalk productivity without N application as in com-parison to when the nutrient was applied. Korndörfer et al. (1997) stated that planted cane productivity in-creased linearly with N rates (30, 60, and 120 kg ha–1),
and that for each 10 kg ha–1 N applied there was a mean
increase of 3.5 TSS. In an experiment with 18-month-old planted cane, Paes et al. (1997) observed that the appli-cation of N rates provided a linear TSS productivity in-crease in cultivars RB739359 and NA56-79, while cv CB45-3 did not respond to nitrogen fertilization. Accord-ing to Paes et al. (1997), these results highlight a differ-ential behavior between cultivars, thus demonstrating that there are variety-related differences with respect to nitrogen use effectiveness on stalk productivity. In addi-tion, Espironelo et al. (1977), and Espironello et al. (1987), also observed that planted cane responded to N fertilization.
The results obtained in Jaboticabal corroborate those of Azeredo et al. (1986), and Bittencourt et al. (1986), who reported a lack of planted cane response to nitrogen fertilization. Nevertheless, Azeredo et al. (1986) indicated response in 20% of the experiments (two out of a total of nine assays), at a 120 kg ha–1 N rate, yielding
Table 4 – Stalk productivity (TSS), and planted cane dry matter of stalks, tip, dry leaves, roots, above-ground part, and total in experiment areas of Pirassununga and Jaboticabal.
NSnon-significant; ***, ** and *significant at 1%, 5%, and 10% probability, respectively. TSS: tons of sugarcane stalks per hectare; LR and QR: Linear Regression and Quadratic Regression, respectively.
s e t a r
N TSS Drymatter
k l a t
S Tip Dryleaves Aboveground Roots Total a
h g
k –1 Mgha–1 -------------------------------------------------------------------------kgha–1----------------------------------------------------------------------- --a
g n u n u s s a r i P
0 134 36,175 2,893 5,123 44,191 1,859 46,050
0
4 142 37,014 3,170 4,692 44,875 2,490 47,365
0
8 139 40,004 3,711 5,267 48,982 2,258 51,241
0 2
1 141 37,167 3,264 5,170 45,601 3,716 49,316
s e t a r
-F 1.9* 5.3** NS NS 5.2** NS 3.5*
R L
-F 2.6* NS NS NS 4.0* 5.2** 6.3**
R Q
-F NS 6.4** NS NS 4.7* NS NS
) % ( V
C 4 4 17 15 4 40 5
l a b a c i t o b a J
0 145 37,238 4,371 6,415 48,024 1,611 49,635
0
4 144 38,116 3,930 6,749 48,794 2,792 51,586
0
8 147 40,219 3,142 6,557 49,918 1,708 51,626
0 2
1 146 38,028 4,364 6,471 48,862 2,289 51,151
s e t a r
-F NS NS NS NS NS 2.8* NS
R L
-F NS NS NS NS NS NS NS
R Q
-F NS NS NS NS NS NS NS
) % ( V
twice as much as the control. Although not having ob-tained planted cane response to nitrogen fertilization, Bittencourt et al. (1986) suggested that in soils without very high available N contents, the addition of 60 kg ha–1
N at planting should be considered the maximum amount. These authors reported a comprehensive review of the literature in their studies, demonstrating the low response of planted cane to nitrogen fertilization at plant-ing: Azeredo et al. (1986) reported that nitrogen fertili-zation in planted cane provided productivity increases in just 19% of the 135 experiments cited; Bittencourt et al. (1986) observed planted cane response to N fertiliza-tion in 50% of the studies reviewed.
The different responses in the experiments were not caused by the rainfall regime, since monthly and total rainfall was similar in both locations (Figure 1). On the other hand, due to high experimental error, sometimes associated with fertilization assays, studies that show a little response in yield caused by nitrogen fertilization do not achieve statistical significance, leading many tech-nicians to consider that planted cane can dismiss the ap-plication of the nutrient. However, a different scenario emerges when data from groups of assays are evaluated together (Cantarella et al., 2007). Penatti and Cantarella (data not published), cited by Cantarella et al. (2007), pooled together 74 field experiments and observed that the majority of those studies did not show a significant response to nitrogen fertilization individually, but when analyzed conjointly, they showed a clear tendency of re-sponse, with an economic rate of 75 kg ha–1 N.
In that study, planted cane response to added N-fer-tilizer could be also associated with soil type. Azeredo et al. (1994) obtained a highly significant TSS increase by adding 180 kg ha–1 N to an Inceptisol (a 68 TSS
in-crease), while only a tendency of response was seen in Oxisols. These results led Azeredo et al. (1994) to con-clude that planted cane response to N fertilization in the soils studied was associated with the soil capacity to pro-vide the nutrient due to organic nitrogen mineralization. Within the same line of thought, Orlando Filho (1993) emphasized that there are three conditions in which planted cane may respond to nitrogen fertilization: eutrophic soils (high fertility); soils where sugarcane is cultivated for the first time, and soils under reduced till-age. Consequently, based on the attributes of the soils of our experiments, since conventional soil tillage was used in the experiments and the soils have been culti-vated with sugarcane for several years, planted cane would respond to fertilizer-N additions in Pirassununga (epiutrophic soil), while no response would be obtained in Jaboticabal (dystrophic soil). Vinasse was applied in the Jaboticabal experiment (150 m3 ha–1 year–1) during
about ten years until 24 months before beginning this assay, and this practice may explain the lack of sugar-cane yield response (TSS) to nitrogen fertilization, prob-ably due to increase of organic-N soil due to the vinasse. The interpretation of fertilizer-N response results in planted cane presents, in general, a series of difficulties,
due to the complex behavior of this nutrient in the soil, and also there is not an effective and economically vi-able analytical method to establish soil N availability to plants. Several factors have been listed to explain poor responses to N in planted cane, including the mineral-ization of soil organic matter and crop residues from the sugarcane itself, favored by soil turning during sugarcane field renovation (Cantarella et al., 2007). Zambello Júnior and Orlando Filho (1981) observed that soil till-age operations increase soil aeration during a season of increased temperature and moisture, causing increased soil microbial activity, which quickly breaks down crop residues (especially roots), decreasing the C/N ratio, thus providing greater N availability to planted cane planted between February and March in the South-Cen-tral region of Brazil.
Organic N mineralization over the planted cane cycle is probably the most important source of N for the crop (Salcedo et al., 1985). The fact that ratoon cane responds more frequently to nitrogen fertilization (Carnaúba, 1990) could be explained by the reduction in mineral N content in the soil profile at the end of the planted cane cycle (Salcedo and Sampaio, 1984), together with a potential decrease in organic N mineralization over the cycle. Microbial activity in the ratoon cane would become more difficult because of decreased soil aeration caused by soil compaction, as well as by low temperature and moisture conditions (typical in the Cen-tral-Western region of Brazil) (Zambello Júnior and Or-lando Filho, 1981). The breakdown of this organic mat-ter (crop residues and roots) with high C/N ratio and a period of great N requirement by the crop would cause any addition of N to the process to be accompanied by rapid response, in terms of growth, from the ratoon. In fact, Salcedo et al. (1985) studied C and N mineraliza-tion in a soil cultivated with sugarcane and verified that the amounts of soil N that were mineralized over the planted cane cycle were sufficient to meet the crop’s de-mand for nitrogen.
The survey conducted to quantify the stock of nutri-ents in crop residues at SA (Franco et al., 2007) showed that a large quantity of N (about 200 kg ha–1) was
incor-porated into the soil in the renovation of the sugarcane plantation. After sugarcane trash had remained in the field for 18 months, Ng Kee Kwong et al. (1987) ob-served that 73 to 83% of the N contained in the residue remained in the soil organic matter, that is, there was an average release of 25% during that period. Nitrogen recovery by sugarcane from crop residues incorporated into the soil varies from 2.4% to 15%. (Ng Kee Kwong et al., 1987; Chapman et al., 1992; Gava et al., 2005). Based on these values around 30 kg ha–1 N present in crop
other factors (Salcedo and Sampaio, 1984). These quan-tities, however, represent a small amount of the N ab-sorbed by the crop.
Other researchers have attributed the low planted cane response to nitrogen fertilization at planting to bio-logical atmospheric nitrogen fixation (BNF) performed by diazotroph organisms capable of forming associa-tions (or associative symbiosis) by colonizing roots and internal plant tissues, that is, by establishing endophytic associations (Cantarela, 2007). Döbereiner et al. (1972) observed an abundant population of free-living N-fixing bacteria in sugarcane plantations, whose numbers mark-edly increased near tussocks. The energy provided by sugarcane billets at planting allows the development of N-fixing microorganisms in the rhizosphere, providing an extra supply of the nutrient. When added to the soil, this supply seems to allow adequate planted cane devel-opment (Carnaúba, 1990). Urquiaga et al. (1992) esti-mated the contribution from nitrogen biological fixation in sugarcane to be in the order of 40 to 60% of the plant’s total N, or about 30 to 160 kg ha–1 year; the quantity of
fixed N varied with sugarcane cultivar. Based on 15N/N
balance, Boddey et al. (1991) observed that some sugar-cane cultivars can obtain high amounts of N from their association with diazotroph organisms, at values equiva-lent to 60 to 80% of the plant’s N total (about 200 kg ha–1
year). Because no response from planted cane to N has been observed in most experiments, the presence of fix-ing microorganisms in the sugarcane rhizosphere is an indication that fixation must play an important role in N self-sufficiency (Carnaúba, 1990). However, the sub-ject of BNF in sugarcane raises controversy, since there is no evidence, under field conditions, that biological N2 fixation can guarantee that N will be supplied to me-dium- or high-productivity crops (Cantarella, 2007). Ac-cording to Cantarella (2007), studies conducted in South Africa and Australia demonstrated that biological N2 fixation is not a significant source of this nutrient for sugarcane, although N2 fixing bacteria have been isolated from the field. Also, the use of inoculants is still not pos-sible, since the N2 fixing population in sugarcane is di-versified and a species that could be pointed out as the main responsible for fixation has not been identified so far (Boddey et al., 2003).
The majority of these organisms have other forms of promoting vegetative growth, such as the production of plant hormones, resistance to stress, production of siderophores, and antibiosis, among others (Reis et al., 2006). According to Reis et al. (2006), some questions re-lating to BNF in grasses remain unanswered: Is there enough C supply to support a high bacterial population? Or the bacteria can become a sink for the plants? Fixa-tion products are directly transferred to the plant or this occurs only after cell death and mineralization? Num-bers found in non-legume plants are around 10,000,000 cells per gram of green matter; in the case of rhizobium, this number reaches 100,000,000,000 bacteroids per gram of green matter. Would these numbers be enough? Many aspects still remain to be studied in order to make this
association more effective. Therefore, biological N2 fixa-tion in sugarcane is a much more complex and doubtful question, so far without practical results, as to fertiliz-ing planted cane with nitrogen. It is presently at least illogical to attribute the lack of response of planted cane to nitrogen fertilization exclusively to BNF, in view of the available knowledge on the subject. Possibly, part of planted cane total N really comes from BNF, but that amount does not actually meet the crop nitrogen re-quirements, especially in high productivity sugarcane plantations.
Altogether, nutritional reserves in the planting bil-let constitute an important source of N for planted cane. Carneiro et al. (1995) attempted to demonstrate that the N content in planting billets (seed cane) can contribute towards sugarcane nitrogen nutrition and, together with other factors that make N available for the crop, would justify, in part, the lack of response from planted cane to nitrogen fertilization. However, the N amounts present in the seed cane in the experiments (Table 2) were low (about 10 kg ha–1). According to Carneiro et al. (1995), about 50% of the N from seed cane is translo-cated to new plant parts (roots and above-ground part). Based on this result, the N contribution from planting billets to the total N quantity of the entire plant was only 5 kg ha–1, thus not justifying the lack of response from
planted cane to nitrogen fertilization at SA.
Based on the various literature data, it can be stated that the lack of response from planted cane at SA and the poor response in Pirassununga to N fertilization were mostly due to the mineralization of the native or-ganic matter freshly incorporated into the soil during the crop renovation, together with the type of soil till-age adopted (conventional mantill-agement) and the long newly planted cane cycle (about 16 months).
Technological Parameters of the Planted Cane
The technological parameters analyzed at sugarcane harvest were not modified by nitrogen fertilization at SL (Table 5), except for the moisture. Similar results were obtained by Orlando Filho and Zambello Júnior (1980); Azeredo et al. (1986); Espironelo et al. (1987); Korndörfer et al. (1997); Orlando Filho et al. (1999); Trivelin et al. (2002); Korndörfer et al. (2002). On the other hand, the addition of N to planted cane at plant-ing improved stalk technological quality in Jaboticabal, and all technological parameters analyzed were in-creased at the 40 and 80 kg ha–1 N rates, except for RS
(Table 5), but with a tendency for the values to be smaller at the 40 and 80 kg ha–1 N rates. Reducing sugars (RS), a
was linearly and inversely correlated with reducing sug-ars percentages. Increased qualitative attributes due to N addition were only observed by Paes et al. (1997), who verified a linear response in cane Pol in cv RB73 9359 as a function of N rates ( 0, 50, and 100 kg ha–1), similarly to what occurred at SA.
Nitrogen fertilization is normally associated with greater vegetative growth, which invariably determines plants with higher moisture contents, but with decreased sucrose accumulation (Korndörfer and Martins, 1992). In fact, Fritz (1974 cited by Korndörfer and Martins, 1992) studied the effect of increasing N rates and ob-served a reduction in sucrose content due to an increase in stalk moisture, since sucrose contents determined in dry matter did not change. In the same line of thought, Innes (1960 cited by Korndörfer and Martins, 1992) stated that for each percentage increase unit in TSS due to N, there is a 0.01% decrease in stalk sugar content. In both experiments (without statistical significance in the ex-periment located in Jaboticabal) the moisture of the stalks was lower at the 80 kg ha–1 N rate (Table 5). Trivelin et al. (2002) did not observe any effect of nitro-gen fertilization at planting on stalk moisture. However, Trivelin et al. (1996) verified over the entire ratoon growth and maturation period in sugarcane cv SP70-1143 that moisture in the above-ground part of plants con-ducted without nitrogen fertilization was smaller than in plants fertilized with 100 kg ha–1 N. According to Silva
NSnon-significant; ***, ** and *significant at 1%, 5%, and 10% probability, respectively; RS: reducing sugars; TRS: total recoverable sugar; LR and QR: Linear Regression and Quadratic Regression respectively.
Table 5 – Technological parameters evaluated at sugarcane harvest as a function of N rates at planting. Experiments at Pirassununga and Jaboticabal.
s e t a R
N Moisture Brix Fiber Purity JuicePol CanePol RS TRS
a h g
k –1 --------------------------------------------------------------------------------% ---------------------------------------------------------------------------------- kgt–1
a g n u n u s s a r i P
0 73 19.70 10.34 84.61 16.69 14.54 0.64 140.34
0
4 74 20.08 10.84 84.94 17.05 14.73 0.63 141.94
0
8 71 19.98 10.77 84.82 16.95 14.66 0.63 141.32
0 2
1 74 18.83 10.51 84.57 15.93 13.84 0.64 133.84
s e t a r
-F 13.5*** NS NS NS NS NS NS NS
R L
-F NS NS NS NS NS NS NS NS
R Q
-F 6.6** NS NS NS NS NS NS NS
) % ( V
C 1 5 5 2 7 6 7 6
l a b a c i t o b a J
0 74 20.43 10.89 88.53 18.10 15.62 0.63 153.92
0
4 74 22.00 11.80 90.47 19.94 16.95 0.50 165.48
0
8 73 21.73 11.15 90.31 19.59 16.83 0.53 164.62
0 2
1 74 20.73 10.94 88.12 18.29 15.76 0.65 155.51
s e t a r
-F NS 4.6** 6.5** 3.6* 4.4** 4.2** NS 2.9*
R L
-F NS NS NS NS NS NS NS NS
R Q
-F NS 13.1*** 11.5** 10.4*** 12.9*** 12.3*** 5.7** 8.9**
) % ( V
C 2 3 3 1 5 4 19 4
and Casagrande (1983), N facilitates Ca absorption, an essential element in the salt composition of the cyto-plasm and in the cell wall makeup in the form of cal-cium pectate, resulting in greater cell structuring and fa-cilitating water absorption, which could negatively af-fect the product’s technological quality (Silva, 1983).
Other authors also verified the deleterious effects of nitrogen fertilization, especially with the application of high rates (> 120 kg ha–1 N) on sucrose accumulation by sugarcane, similar to what occurred in Jaboticabal with the application of 120 kg ha–1 N, where Brix, Juice
Pol, cane Pol, and TRS were lower in relation to the other treatments. Silveira and Crocomo (1981) observed a decreased sucrose content in sugarcane plants grown in the presence of a high N content. Espironelo et al. (1977) verified that sugar contents in stalk samples were not significantly influenced by N rates and modes of ap-plication; however, smallest values were obtained at rates of 120 and 180 kg ha–1 N. Espironelo et al. (1987)
obtained a negative linear effect for sucrose content as a function of N rates (0, 70, 140, and 210 kg ha–1). Orlando Filho and Zambello Júnior (1980) observed that cane Pol percentage only decreases with the application of 480 kg ha–1 N.
The decrease in fiber contents at SA at the 40 and 80 kg ha–1 N rates is a direct result of higher Brix contents
water, referred to as cane fiber (Fernandes, 2003). The juice contains water (cane moisture) and total soluble solids, which correspond to sugars and non-sugars, re-ferred to as Brix. Therefore, there is a direct antagonis-tic relationship between Brix and Fiber contents. Korndörfer et al. (1997) observed a fiber content reduc-tion in four sugarcane cultivars (planted cane) with N application, which is interesting from the sugar and al-cohol industry point of view, since grinding those stalks with smaller fiber content will increase yield.
Nitrogen fertilization of planted cane in the experi-ments of this study resulted in higher sugar production per hectare, but in a distinct manner. The increased TSS in Pirassununga generated higher sugar production per hectare, while at SA the increase was due to increased cane Pol. There is consensus in the literature as to the effects of adding N on sugar production per area, i.e., stalk sugar content decreases with nitrogen fertilization, but the amount of sugar produced per hectare is higher as a result of higher TSS productivity (Espironelo et al., 1987; Korndörfer et al., 1997; Paes et al., 1997; Korndörfer et al., 2002; Trivelin et al., 2002).
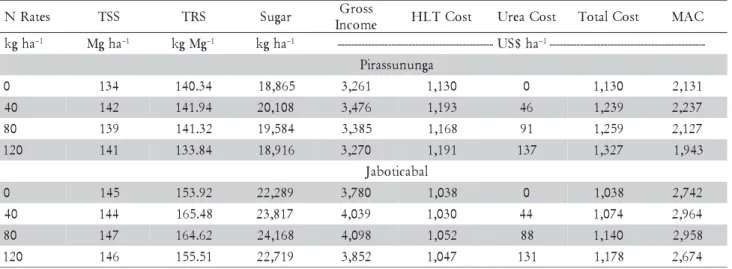
The margin of contribution was calculated in order to attest benefits of N fertilization at planting. The data employed to calculate MAC in both experiments are presented in Table 6. The 40 kg ha–1 N rate resulted in
the highest MAC in Pirassununga. The use of higher N rates would result in financial disadvantages. The same result was obtained at SA, i.e., the application of 40 kg ha–1 N in the form of urea applied at planted cane
plant-ing (buried at bottom of the furrow) generated the high-est financial return, with a positive difference of US$ 7.00 ha–1 relative to the 80 kg ha–1 N rate.
The application of 40 kg ha–1 N in Jaboticabal
gener-ated a return of US$ 223.00 ha–1, while the same
manage-ment practice in Pirassununga provided a smaller return,
in the order of US$ 106.00 ha–1. These results were due
to the higher HLT cost in Pirassununga when compared to Jaboticabal, and also because nitrogen fertilization in Pirassununga increased TSS, thus generating a higher HLT cost per ha. In addition, harvesting seasons were different in each experiment, causing Jaboticabal’s plants to accumulate more sugar in relation to SL plants.
As a conclusion, N fertilization in 18-month-old new cane, planted between February and April is an indispensable practice. The N rate to be applied in sug-arcane plantation areas of the State of São Paulo (culti-vated for several years with sugarcane, under conven-tional soil tillage when sugarcane is planted) should be similar to the rate at which the best MAC was obtained in this study (40 kg ha–1 N applied in the form of urea
in the planting furrow). Other authors have also rec-ommended similar amounts of N (varying from 40 to 60 kg ha–1) for planted cane (Bittencourt et al., 1986;
Morelli et al., 1997).
Acknowledgements
To FAPESP and CNPq for financial support and scholarships, and the Sugar Mills (São Luiz and Santa Adélia) and the Center of Sugar Cane Technology (CTC) to logistical support in the development of the project.
References
Allen, R.G.; Pereira, L.S.; Raes, D.; Smith, M. 1998. Crop Evapotranspiration: Guidelines for Computing Crop Water Requirements. FAO, Rome, Italy.
Azeredo, D.F.; Bolsanello, J.; Lima, E.; Fernandes, M.S.; Vieira, J.R. 1994. Split application of nitrogen fertilization in planted cane in the northern of Rio de Janeiro state. Revista Brasileira de Ciência do Solo18: 441-447. (in Portuguese, with abstract in English).
Sugar = TSS × TRS; Gross Income = Sugar × TRS in the closure of the 2006/2007 cropping season (0.3544 at SL and 0.3476 at SA); HLT: harvesting, loading, and transporting costs; HLT = R$ 14.69 (SA) and R$ 17.27 (SL); Urea cost at SL in February/2005 = R$ 1,050.00 or R$ 2.33/ kg N; Urea cost at SA in March/2005 = R$ 1,010.00 or R$ 2.24/ kg N; Total Cost = HLT + Urea; MAC: Margin of agricultural contribution. US$ 1.00 = R$ 2.05 (April 2007 – closure of the 2006/2007 cropping season). Table 6 – Sugar productivity and financial yield, as a function of nitrogen fertilization at planting.
s e t a R
N TSS TRS Sugar Gross
e m o c n
I HLTCost UreaCost TotalCost MAC
a h g
k –1 Mgha–1 kgMg–1 kgha–1 ----------------------------------------------US$ha–1 --------------------------------------------
--a g n u n u s s a r i P
0 134 140.34 18,865 3,261 1,130 0 1,130 2,131
0
4 142 141.94 20,108 3,476 1,193 46 1,239 2,237
0
8 139 141.32 19,584 3,385 1,168 91 1,259 2,127
0 2
1 141 133.84 18,916 3,270 1,191 137 1,327 1,943
l a b a c i t o b a J
0 145 153.92 22,289 3,780 1,038 0 1,038 2,742
0
4 144 165.48 23,817 4,039 1,030 44 1,074 2,964
0
8 147 164.62 24,168 4,098 1,052 88 1,140 2,958
0 2
Azeredo, D.F.; Bolsanello, J.; Webwe, H.; Vieira, J.R. 1986. Nitrogen in planted cane: rates and fractionation. STAB. Açúcar, Álcool e Subprodutos4: 25-29. (in Portuguese, with abstract in English).
Bittencourt, V.C.; Faganello, B.F.; Salata, J.C. 1986. Efficiency of nitrogen fertilization in sugar cane (plant). STAB. Açúcar, Álcool e Subprodutos 5: 26-33 (in Portuguese, with abstract in English).
Boddey, R.M.; Urquiaga, S.; Alvez, B.J.R.; Reis, V. 2003. Endophitic nitrogen fixation in sugarcane: present kwonlegde and future applications. Plant and Soil 252: 139-149.
Boddey, R.M.; Urquiaga, S.; Reis, V.; Dobereiner, J. 1991. Biological nitrogen fixation associated with sugar cane. Plant and Soil 137: 111-117.
Cantarella, H. 2007. Nitrogen. p. 375-470. In: Novais, R.F.; Alvarez, V.H.V.; Barros, N.F.; Fontes, R.L.F.; Cantarutti, R.B.; Neves, J.C.L., eds. 2007. Fertilidade do solo, Viçosa, MG, Brazil. (in Portuguese).
Cantarella, H.; Trivelin, P.C.O.; Vitti, A.C. 2007. Nitrogen and sulfur in the cultivation of sugarcane. p. 355-412. In: Yamada, T.; Abdalla, S.R.S.; Vitti, G.C., eds. Nitrogen and sulfur in the cultivation of sugarcane. IPNI Brasil, Piracicaba, SP, Brazil. (in Portuguese).
Carnaúba, B.A.A. 1990. The nitrogen and sugar cane. STAB. Açúcar, Álcool e Subprodutos 8: 24-41. (in Portuguese, with abstract in English).
Carneiro, A.E.V.; Trivelin, P.C.O.; Victoria, R.L. 1995. Utilization of the organic and nitrogen reserve of the seedpiece by the planted cane. Scientia Agricola52: 199-209. (in Portuguese, with abstract in English).
Chapman, L.S.; Haysom, M.B.C; Saffigna, P.G. 1992. N cycling in cane fields from 15
N labelled trash and residual fertiliser. Australian Society Sugar Cane Technologist, 14: 84-89. Döbereiner, J.; Day, J.M.; Dart, P.J. 1972. Nitrogenase activity in
the rhizosphere of sugarcane ans some other tropical grasses. Plant and Soil 37: 191-196.
Doorenbos, J.; Kassam, A.H., 1994. Effect of water on crop yield. UFPB, Campina Grande, PB, Brazil. (In Portuguese). Empresa Brasileira de Pesquisa Agropecuária [EMBRAPA]. 2006.
Brazilian System of Soil Classification. 2ed. Embrapa Solos, Rio de Janeiro, RJ, Brazil. (in Portuguese).
Epstein, E.; Bloom, A. 2006. Mineral nutrition of plants: principles and perspectives. 2.ed. Editora Planta, Londrina, PR, Brazil. (in Portuguese).
Espironelo, A.; Costa, A.A.; Landell, M.G.A.; Pereira, J.C.V.N.A.; Igue, T.; Camargo, A. P. de; Ramos, M.T.B. 1987. Effects of NK application and two row spacings on yield of three varieties of sugarcane. Bragantia 46: 247-268. (in Portuguese, with abstract in English).
Espironelo, A.; Oliveira, H.; Nagai, V. 1977. Effects of nitrogen fertilization on sugarcane (plant-crop), in consecutive years of planting. I. Results of 1974/75 and 1975/76. Revista Brasileira de Ciência do Solo 1: 76-81. (in Portuguese, with abstract in English).
Fernandes, A.C. 2003. Calculated on the ethanol plant cane. 2ed. STAB. Açúcar, Álcool e Subprodutos. Piracicaba, SP, Brazil. (in portuguese).
Franco, H.C.J.; Vitti, A.C.; Faroni, C.E.; Cantarella, H.; Trivelin, P.C.O. 2007. Stock of nutrients in residues ratoon crop incorporated into the soil during at planting of sugar cane. STAB. Açúcar, Álcool e Subprodutos 25: 32-36. (in Portuguese, with abstract in English).
Franco, H.C.J.; Cantarella, H.; Trivelin, P.C.O.; Vitti, A.C.; Otto, R.; Faroni, C.E.; Sartori, R.H.; Trivelin, M.O. 2008. Nutrients accumulation by planted cane. STAB. Açúcar, Álcool e Subprodutos 26: 47-51. (in Portuguese, with abstract in English).
Gava, G.J.C.; Trivelin, P.C.O; Vitti. A.C.; Oliveira, M.W. 2005. Urea and sugarcane straw nitrogen balance in a soil-sugarcane crop system. Pesquisa Agropecuária Brasileira, 40: 689-695.
Inman-Bamber, N.G.; Mcglinchey, M.G. 2003. Crop coefficients and water use estimates for sugarcane based on long-term Bowen ratio energy balance measurements. Field Crops Research 83: 125-138.
Jarrell, W.M.; Beverly, R.B. 1981. The dilution effect in plant nutrition studies. Advances in Agronomy 34: 197-224. Korndörfer, G.H.; Colombo, C.A.; Chimello, M.A.; Leoni, P.L.C.
2002. Performance of sugar cane varieties grown with and without nitrogen. STAB. Açúcar, Álcool e Subprodutos 20: 28-31. (in Portuguese, with abstract in English).
Korndörfer, G.H.; Martins, M. 1992. Importance of fertilization on the sugar cane quality.STAB. Açúcar, Álcool e Subprodutos 10: 26-31. (in Portuguese, with abstract in English).
Korndörfer, G.H.; Valle, M.R.; Martins, M.; Trivelin, P.C.O. 1997. Utilization by planted cane of nitrogen from urea. Revista Brasileira de Ciência do Solo 21: 23-26. (in Portuguese, with abstract in English).
Malavolta, E. 1980. Elements of plant nutrition. Agronômica Ceres, São Paulo, SP, Brazil. (in Portuguese).
Malavolta, E., Vitti, G.C.; Oliveira, S.A. 1997. Nutritional status of nutrition of plants.2ed. Potafos, Piracicaba, SP, Brazil. (in Portuguese).
Morelli, J.; Demattê, J.L.I.; Dalben, A.E.; Nelli, E. 1997. Split application of nitrogen in sugarcane: application to the soil. STAB. Açúcar, Álcool e Subprodutos 15: 26-30. (in Portuguese, with abstract in English).
Ng Kee Kwong, K.F.; Deville, J.; Cavalot, P.C.; Riviere, V. 1987. Value of cane trash in nitrogen nutrition of sugarcane. Plant and Soil 102: 79-83.
Orlando Filho, J. 1993. Liming and fertilization of sugarcane. p. 133-146. In: Câmara, G.S.; Oliveira, E.A.A., eds. Produção de cana-de-açúcar.FEALQ, Piracicaba, SP, Brazil. (in Portuguese). Orlando Filho, J.; Rodella, A.A.; Beltrame, J.A.; Lavorenti, N.A. 1999. Rates, Sources and forms of nitrogen application in sugar cane. STAB. Açúcar, Álcool e Subprodutos 17: 39-41. (in Portuguese, with abstract in English).
Orlando Filho, J.; Zambello Júnior, E. 1980. Effects of NPK fertilization on the technological quality of sugar cane variety CB41-76. Brasil Açucareiro 96: 37-44. (in Portuguese). Otto, R., Franco, H.C.J., Faroni, C.E., Vitti, A.C., Trivelin,
P.C.O., 2009. Fitomassa de raízes e da parte aérea da cana-de-açúcar relacionada à adubação nitrogenada de plantio. Pesq. Agropec. Bras., 44, 398-405 (in Portuguese, with abstract in English)
Paes, J.M.V.; Marciano, N.; Brito, C.H.; Cardoso, A.A.; Martinez, H.H.P.; Mendes, A. 1997. Study of spacing and nitrogen rates in production and some biometric characteristics of three varieties of sugar cane. STAB. Açúcar, Álcool e Subprodutos 15: 18-20. (in Portuguese, with abstract in English).
Prates, H.S.; Lavres Junior, J.; Moraes, M.F. 2006. The sulfur as a nutrient and agent of defense against pests and diseases. Informações Agronômicas POTAFOS 115: 8-9. (in Portuguese). Reis, V.M.; Oliveira, A.L.M.; Baldani, V.L.D.; Olivares, F.L.; Baldani, J.I. 2006. Symbiotic nitrogen fixation and associative. p. 153-174. In: Fernandes, M.S., ed. Mineral plant nutrition. Sociedade Brasileira de Ciência do Solo, Viçosa, MG, Brazil. (in Portuguese).
Rolim, G.S.; Sentelhas, P.C.; Barbieri, V. 1998. Spreadsheets environment EXCELTM
for calculating water balance: normal, sequential, culture and real productivity and potential. Revista Brasileira de Agrometeorologia 6: 133-137. (in Portuguese, with abstract in English).
Salcedo, I.H.; Sampaio, E.V.S.B. 1984. Nutrient dynamics in sugar cane. II. Vertical and Horizontal Displacement of NO3
- - N e NH4+
- N in the soil. Pesquisa Agropecuária Brasileira 19: 1103-1108. (in Portuguese, with abstract in English).
Silva, L.C.F. 1983. Effects of nitrogen fertilization on the quality of sugarcane. p. 317-332. In: Orlando Filho, J., ed. Nutrition and fertilization of cane sugar in Brazil. Instituto do Açúcar e do Álcool, Piracicaba, SP, Brazil. (in Portuguese).
Silva, L.C.F.; Casagrande, J.C. 1983. Mineral nutrition of sugar cane (macronutrients). p. 77-99. In: Orlando Filho, J., ed. Nutrition and fertilization of cane sugar in Brazil. Instituto do Açúcar e do Álcool, Piracicaba, SP, Brazil. (in Portuguese). Silveira, J.A.G.; Crocomo, O.J. 1981. Biochemical and physiological
aspects of sugarcane (Saccharum spp.). I. Effects of NO3 nitrogen concentration on the metabolism or sugar and nitrogen. Energia Nuclear e Agricultura 3: 19-33.
Soil Survey Staff. 2003. Keys to soil taxonomy. 9ed. Department of Agriculture/National Resources Conservation Service, Washington, D.C., USA.
Souza, Z.M.; Marques Jr., J.; Pereira, G.T.; Barbieri, D.M. 2006. Small relief shape variations influence spatial variability of soil chemical attributes. Scientia Agricola 63: 161-168.
Thornthwaite, C.W.; Mather, J.R., 1955. The water balance. Laboratory of climatology Elmer, NJ, USA.
Trivelin, P.C.O.; Rodrigues, J.C.S.; Victoria, R.L. 1996. Utilization by early harvest sugar cane ratoon of the nitrogen from 15
N-Aqua ammonia and 15
Urea applied to the soil as vinasse N-complement. Pesquisa Agropecuária Brasileira 31: 89-99. (in Portuguese, with abstract in English).
Trivelin, P.C.O.; Vitti, A.C.; Oliveira, M.W.; Gava, G.J.C.; Sarriés, G.A. 2002. Nitrogen utilization and sugar cane (planted cane) yield on a Sandy soil with incorporated crop residues. Revista Brasileira de Ciência do Solo 26: 637-646. (in Portuguese, with abstract in English).
Urquiaga, S.; Cruz, K.H.S.; Boddey, R.M. 1992. Contribution of nitrogen fixation to sugar cane: nitrogen-15
N and nitrogen-balance estimates.Soil Science Society of America Journal 56: 105-114.
Van Raij, B.; Andrade, J.C.; Cantarella, H.; Quaggio, J.A., eds. 2001. Chemical Analysis for Evaluation of the Fertility of Tropical Soils. Instituto Agronômico, Campinas, SP, Brazil. (in Portuguese).
Van Raij, B.; Cantarella, H. 1997. Other industrial crops. p. 233-243. In: van Raij, B.; Cantarella, H.; Quaggio, J.A.; Furlani, A.M.C., eds. Lime and fertilizer recommendations for the State of Sao Paulo. Fundação IAC, Campinas, SP, Brazil. (in Portuguese).
Vitti, A.C.; Trivelin, P.C.O; Gava, G.J.C.; Penatti, C.; Bologna, I.R.; Faroni, C.E.; Franco, H.C.J. 2007. Sugar cane yield related to the residual nitrogen from fertilization and the root system. Pesquisa Agropecuária Brasileira 42: 249-256. (in Portuguese, with abstract in English).
Zambello Júnior, E.; Orlando Filho, J.A. 1981. Fertilization of sugar cane in the Center-South region of Brazil. Boletim Técnico PLANALSUCAR 3: 5-26. (in Portuguese).